OPEN-SOURCE SCRIPT
Quarterly Earnings
Here's a ready-to-paste TradingView publication description:
---
**Quarterly Earnings Dashboard**
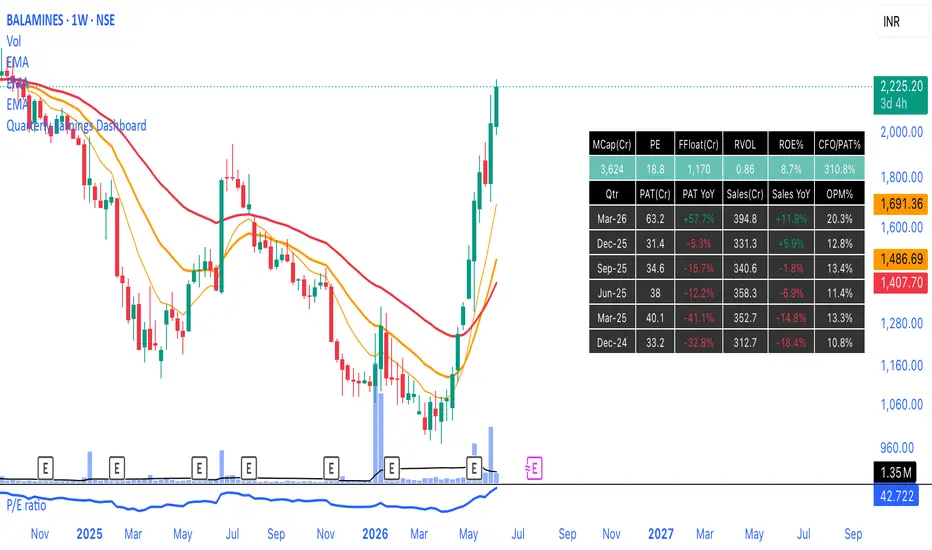
A clean on-chart table that puts a stock's key fundamentals next to its price action — built for fundamentals-aware swing/position traders who want valuation, quality, and earnings trend in one glance without leaving the chart.
**Current snapshot (top row)**
- **MCap (Cr)** — market capitalisation
- **PE** — price-to-earnings
- **FFloat (Cr)** — free-float market cap (MCap × float shares ÷ total shares)
- **RVOL** — relative volume vs the N-bar average (configurable), to spot unusual activity
- **ROE%** — return on equity
- **CFO/PAT%** — cash conversion: operating cash flow ÷ profit after tax. ~100%+ signals profits backed by real cash; persistently low is a quality red flag.
**Quarterly earnings table**
For the last N reported quarters: **PAT (Cr)**, **PAT YoY%**, **Sales (Cr)**, **Sales YoY%**, and **OPM%**. YoY columns are colour-coded green/red so accelerating or decelerating earnings jump out.
**Inputs**
- Quarters to show (1–16)
- Reporting period (FQ / FY / TTM)
- RVOL length
- Table position and colours
**Notes**
- All data is pulled from TradingView's built-in fundamentals via `request.financial()`. Best used on a single stock's weekly or daily chart.
- Some IDs (free float, cash flow) aren't published on the quarterly feed for every market, so the snapshot falls back FQ → FY → TTM. If a cell still reads "n/a", TradingView simply doesn't carry that data for the symbol.
- RVOL is relative to the chart timeframe — on a weekly chart it's volume vs the 20-week average.
Not financial advice; for research and educational use.
---
---
**Quarterly Earnings Dashboard**
A clean on-chart table that puts a stock's key fundamentals next to its price action — built for fundamentals-aware swing/position traders who want valuation, quality, and earnings trend in one glance without leaving the chart.
**Current snapshot (top row)**
- **MCap (Cr)** — market capitalisation
- **PE** — price-to-earnings
- **FFloat (Cr)** — free-float market cap (MCap × float shares ÷ total shares)
- **RVOL** — relative volume vs the N-bar average (configurable), to spot unusual activity
- **ROE%** — return on equity
- **CFO/PAT%** — cash conversion: operating cash flow ÷ profit after tax. ~100%+ signals profits backed by real cash; persistently low is a quality red flag.
**Quarterly earnings table**
For the last N reported quarters: **PAT (Cr)**, **PAT YoY%**, **Sales (Cr)**, **Sales YoY%**, and **OPM%**. YoY columns are colour-coded green/red so accelerating or decelerating earnings jump out.
**Inputs**
- Quarters to show (1–16)
- Reporting period (FQ / FY / TTM)
- RVOL length
- Table position and colours
**Notes**
- All data is pulled from TradingView's built-in fundamentals via `request.financial()`. Best used on a single stock's weekly or daily chart.
- Some IDs (free float, cash flow) aren't published on the quarterly feed for every market, so the snapshot falls back FQ → FY → TTM. If a cell still reads "n/a", TradingView simply doesn't carry that data for the symbol.
- RVOL is relative to the chart timeframe — on a weekly chart it's volume vs the 20-week average.
Not financial advice; for research and educational use.
---
오픈 소스 스크립트
트레이딩뷰의 진정한 정신에 따라, 이 스크립트의 작성자는 이를 오픈소스로 공개하여 트레이더들이 기능을 검토하고 검증할 수 있도록 했습니다. 작성자에게 찬사를 보냅니다! 이 코드는 무료로 사용할 수 있지만, 코드를 재게시하는 경우 하우스 룰이 적용된다는 점을 기억하세요.

면책사항
해당 정보와 게시물은 금융, 투자, 트레이딩 또는 기타 유형의 조언이나 권장 사항으로 간주되지 않으며, 트레이딩뷰에서 제공하거나 보증하는 것이 아닙니다. 자세한 내용은 이용 약관을 참조하세요.
오픈 소스 스크립트
트레이딩뷰의 진정한 정신에 따라, 이 스크립트의 작성자는 이를 오픈소스로 공개하여 트레이더들이 기능을 검토하고 검증할 수 있도록 했습니다. 작성자에게 찬사를 보냅니다! 이 코드는 무료로 사용할 수 있지만, 코드를 재게시하는 경우 하우스 룰이 적용된다는 점을 기억하세요.
면책사항
해당 정보와 게시물은 금융, 투자, 트레이딩 또는 기타 유형의 조언이나 권장 사항으로 간주되지 않으며, 트레이딩뷰에서 제공하거나 보증하는 것이 아닙니다. 자세한 내용은 이용 약관을 참조하세요.