Probability Clouds + Entry Level [Rider Algo]
Probability Clouds + Entry Level [Rider Algo]
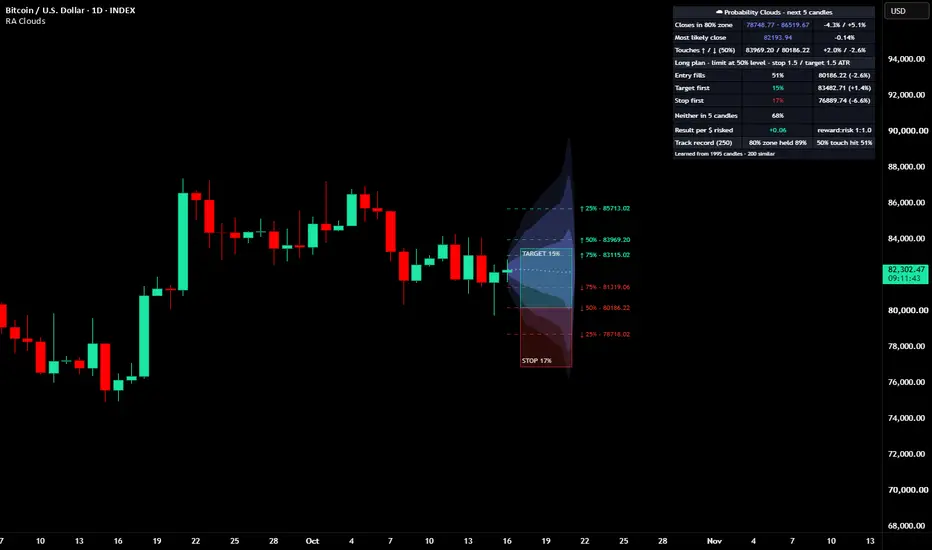
Probability Clouds draws a weather-style forecast to the right of the last candle: clouds that show where price is likely to close over the next few candles, levels that show how likely price is to touch each price, and an entry planner that shows how often a limit order fills and whether the target or the stop usually comes first. Like a weather map, it does not promise rain or sun; it shows how much it usually rains on days like today.
═══════════════════════════════════════════════════════════════════════════
HOW IT WORKS
Everything is learned from the chart you are looking at, using only its own history.
1. Every past candle is described by four features: trend (distance to the EMA 50), short-term momentum (last 5 candles), position inside the 20-candle range, and volatility regime (ATR 14 vs ATR 100).
2. For the current candle, the script finds the past moments that looked most similar on those features (200 by default).
3. It blends what price did after those moments with what it did after every past candle, so the forecast stays specific without trusting a small sample.
4. Moves are measured in ATR, so calm and wild periods compare, and are converted back to prices at today's volatility.
Only past candles whose full outcome has already closed are used. The forecast never looks at future data.
═══════════════════════════════════════════════════════════════════════════
WHAT YOU SEE ON THE CHART
The clouds (where price may CLOSE)
- Inner cloud: the range where the close landed 50% of the time in similar past situations.
- Middle cloud: 80% of the time. Outer cloud: 90% of the time.
- Dotted line: the most likely path.
A wide cloud means large moves are normal right now; a narrow one means the market usually stays quiet in this kind of situation. A lean up or down reflects how similar moments resolved: treat it as context, not as a signal.
The touch levels (where price may REACH)
Dashed lines labelled 75%, 50% and 25%: the share of similar past situations in which price touched that level (a wick is enough) before the cloud ended. Use them to judge whether a limit order is likely to fill, whether a take-profit is realistic in the time you plan to hold, and where normal noise ends for a stop.
The entry planner (Trade odds)
Choose Long or Short, an entry (now, or a limit at the 75%, 50% or 25% level), a stop and a target in ATR. The script replays that exact trade on the same similar past moments and shows:
- Entry fills: how often price reached the entry within the cloud's candles.
- Target first / Stop first: once filled, which one came first. A candle that touches both counts as the stop.
- Neither: still open when the cloud ends.
- Result per $ risked: the average outcome in units of risk, with open trades valued at the last close. Fees are not included.
The plan is drawn as green and red boxes, like TradingView's position tool. A result near zero means a fair bet: the odds help you place and size orders, they do not create an edge.
Freeze at a candle
The forecast normally starts from the last close, so it moves with every new candle. Turn on Freeze at a candle and pick the day you placed your order: the clouds, levels and plan stay fixed from that close, new candles appear inside the frozen cloud, and the table tracks the order: waiting, filled, target, stop or expired.
The table
The 80% zone, the most likely close, the 50% touch levels, the entry planner and the Track record: the latest candles are forecast again with only the data available at each moment and checked, so you can verify the calibration on the exact symbol and timeframe you trade. The Full table adds the 50% and 90% zones and every touch level.
═══════════════════════════════════════════════════════════════════════════
HOW TO USE IT
1. Check the Track record. If the 80% zone held close to 80% of the time, the clouds are well calibrated on that chart; if much lower, give the levels extra room.
2. Read the width of the cloud before the lean. It tells you how far price usually travels from here.
3. Set your entry, stop and target in the entry planner and check how often it fills and which side usually comes first. Match Candles ahead to how long you plan to hold.
4. Once the order is placed, freeze the forecast on that day and follow its status in the table.
The clouds forecast ranges, not direction. Combine them with your own trend or signal tool.
═══════════════════════════════════════════════════════════════════════════
INPUTS
1 · Forecast
- Candles ahead (default 5): how many candles the cloud projects.
- History to learn from (default 2000 candles; about 310 are needed).
- Similar moments (default 200): fewer = more specific but noisier.
- Freeze at a candle (off by default) and its date.
- Weight of similar moments (default 50%): 0% gives a pure volatility cloud; 100% uses only the similar moments.
2 · Clouds and 3 · Touch levels
- Show or hide each element, pick colors, and choose the three Chances (%) (default 75, 50 and 25).
4 · Trade odds
- Plan (Long, Short or Off), Entry, Stop and Target in ATR (defaults: Long, limit at the 50% level, 1.5 and 1.5 ATR) and Draw the plan.
5 · Table
- Content (Compact or Full), Position, Size and Track record (default 250 candles; 0 loads faster).
═══════════════════════════════════════════════════════════════════════════
TECHNICAL NOTES
- Pine Script v6.
- Non-repainting after the close: the forecast follows the live candle while it is open and is fixed once it closes. A frozen forecast and every track-record forecast use only the data available at that candle.
- Works on any symbol and timeframe with enough history and adapts to each chart: the same settings give different clouds on a calm stock and a volatile altcoin.
═══════════════════════════════════════════════════════════════════════════
PART OF THE RIDER ALGO ECOSYSTEM
- Use with Strategy #1 - Sudden Moves towards Optimizer Lines [Rider Algo] to check how likely a limit order at the Optimizer Line is to be reached within the next few candles.
- Use with Strategy #2 [Rider Algo] to see whether its targets sit inside the range price usually covers after similar setups.
- Use with Rider Algo - Volatility Regime Detector: in Compression the clouds narrow, in Expansion and Chaos they widen, which helps size stops and targets for the current regime.
═══════════════════════════════════════════════════════════════════════════
DISCLAIMER
This indicator is a technical analysis tool designed to estimate the range of likely price outcomes and the odds of a planned trade from a chart's own history. It does NOT provide buy or sell signals, and it does NOT constitute financial, investment, or trading advice of any kind. Past patterns do not guarantee future market behavior. Always conduct your own analysis and consult with a qualified financial advisor before making any trading decisions. Use this tool at your own risk. The author is not responsible for any financial losses incurred from the use of this indicator.
Probability Clouds draws a weather-style forecast to the right of the last candle: clouds that show where price is likely to close over the next few candles, levels that show how likely price is to touch each price, and an entry planner that shows how often a limit order fills and whether the target or the stop usually comes first. Like a weather map, it does not promise rain or sun; it shows how much it usually rains on days like today.
═══════════════════════════════════════════════════════════════════════════
HOW IT WORKS
Everything is learned from the chart you are looking at, using only its own history.
1. Every past candle is described by four features: trend (distance to the EMA 50), short-term momentum (last 5 candles), position inside the 20-candle range, and volatility regime (ATR 14 vs ATR 100).
2. For the current candle, the script finds the past moments that looked most similar on those features (200 by default).
3. It blends what price did after those moments with what it did after every past candle, so the forecast stays specific without trusting a small sample.
4. Moves are measured in ATR, so calm and wild periods compare, and are converted back to prices at today's volatility.
Only past candles whose full outcome has already closed are used. The forecast never looks at future data.
═══════════════════════════════════════════════════════════════════════════
WHAT YOU SEE ON THE CHART
The clouds (where price may CLOSE)
- Inner cloud: the range where the close landed 50% of the time in similar past situations.
- Middle cloud: 80% of the time. Outer cloud: 90% of the time.
- Dotted line: the most likely path.
A wide cloud means large moves are normal right now; a narrow one means the market usually stays quiet in this kind of situation. A lean up or down reflects how similar moments resolved: treat it as context, not as a signal.
The touch levels (where price may REACH)
Dashed lines labelled 75%, 50% and 25%: the share of similar past situations in which price touched that level (a wick is enough) before the cloud ended. Use them to judge whether a limit order is likely to fill, whether a take-profit is realistic in the time you plan to hold, and where normal noise ends for a stop.
The entry planner (Trade odds)
Choose Long or Short, an entry (now, or a limit at the 75%, 50% or 25% level), a stop and a target in ATR. The script replays that exact trade on the same similar past moments and shows:
- Entry fills: how often price reached the entry within the cloud's candles.
- Target first / Stop first: once filled, which one came first. A candle that touches both counts as the stop.
- Neither: still open when the cloud ends.
- Result per $ risked: the average outcome in units of risk, with open trades valued at the last close. Fees are not included.
The plan is drawn as green and red boxes, like TradingView's position tool. A result near zero means a fair bet: the odds help you place and size orders, they do not create an edge.
Freeze at a candle
The forecast normally starts from the last close, so it moves with every new candle. Turn on Freeze at a candle and pick the day you placed your order: the clouds, levels and plan stay fixed from that close, new candles appear inside the frozen cloud, and the table tracks the order: waiting, filled, target, stop or expired.
The table
The 80% zone, the most likely close, the 50% touch levels, the entry planner and the Track record: the latest candles are forecast again with only the data available at each moment and checked, so you can verify the calibration on the exact symbol and timeframe you trade. The Full table adds the 50% and 90% zones and every touch level.
═══════════════════════════════════════════════════════════════════════════
HOW TO USE IT
1. Check the Track record. If the 80% zone held close to 80% of the time, the clouds are well calibrated on that chart; if much lower, give the levels extra room.
2. Read the width of the cloud before the lean. It tells you how far price usually travels from here.
3. Set your entry, stop and target in the entry planner and check how often it fills and which side usually comes first. Match Candles ahead to how long you plan to hold.
4. Once the order is placed, freeze the forecast on that day and follow its status in the table.
The clouds forecast ranges, not direction. Combine them with your own trend or signal tool.
═══════════════════════════════════════════════════════════════════════════
INPUTS
1 · Forecast
- Candles ahead (default 5): how many candles the cloud projects.
- History to learn from (default 2000 candles; about 310 are needed).
- Similar moments (default 200): fewer = more specific but noisier.
- Freeze at a candle (off by default) and its date.
- Weight of similar moments (default 50%): 0% gives a pure volatility cloud; 100% uses only the similar moments.
2 · Clouds and 3 · Touch levels
- Show or hide each element, pick colors, and choose the three Chances (%) (default 75, 50 and 25).
4 · Trade odds
- Plan (Long, Short or Off), Entry, Stop and Target in ATR (defaults: Long, limit at the 50% level, 1.5 and 1.5 ATR) and Draw the plan.
5 · Table
- Content (Compact or Full), Position, Size and Track record (default 250 candles; 0 loads faster).
═══════════════════════════════════════════════════════════════════════════
TECHNICAL NOTES
- Pine Script v6.
- Non-repainting after the close: the forecast follows the live candle while it is open and is fixed once it closes. A frozen forecast and every track-record forecast use only the data available at that candle.
- Works on any symbol and timeframe with enough history and adapts to each chart: the same settings give different clouds on a calm stock and a volatile altcoin.
═══════════════════════════════════════════════════════════════════════════
PART OF THE RIDER ALGO ECOSYSTEM
- Use with Strategy #1 - Sudden Moves towards Optimizer Lines [Rider Algo] to check how likely a limit order at the Optimizer Line is to be reached within the next few candles.
- Use with Strategy #2 [Rider Algo] to see whether its targets sit inside the range price usually covers after similar setups.
- Use with Rider Algo - Volatility Regime Detector: in Compression the clouds narrow, in Expansion and Chaos they widen, which helps size stops and targets for the current regime.
═══════════════════════════════════════════════════════════════════════════
DISCLAIMER
This indicator is a technical analysis tool designed to estimate the range of likely price outcomes and the odds of a planned trade from a chart's own history. It does NOT provide buy or sell signals, and it does NOT constitute financial, investment, or trading advice of any kind. Past patterns do not guarantee future market behavior. Always conduct your own analysis and consult with a qualified financial advisor before making any trading decisions. Use this tool at your own risk. The author is not responsible for any financial losses incurred from the use of this indicator.

Trend first. No fear, no FOMO: just a plan and execution.
— Rider Algo (Scripts tab on my profile)
Not financial advice.
— Rider Algo (Scripts tab on my profile)
Not financial advice.
면책사항
해당 정보와 게시물은 금융, 투자, 트레이딩 또는 기타 유형의 조언이나 권장 사항으로 간주되지 않으며, 트레이딩뷰에서 제공하거나 보증하는 것이 아닙니다. 자세한 내용은 이용 약관을 참조하세요.
Trend first. No fear, no FOMO: just a plan and execution.
— Rider Algo (Scripts tab on my profile)
Not financial advice.
— Rider Algo (Scripts tab on my profile)
Not financial advice.
면책사항
해당 정보와 게시물은 금융, 투자, 트레이딩 또는 기타 유형의 조언이나 권장 사항으로 간주되지 않으며, 트레이딩뷰에서 제공하거나 보증하는 것이 아닙니다. 자세한 내용은 이용 약관을 참조하세요.