OPEN-SOURCE SCRIPT
업데이트됨 Ultimate Matrix HUD v8
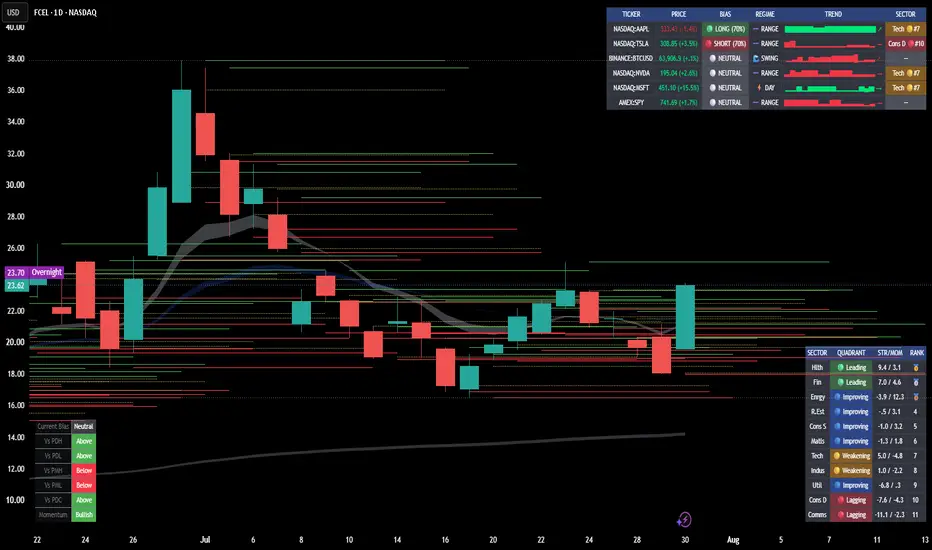
🎯 Ultimate Matrix HUD — Multi-Symbol Direction + Sector Rotation Dashboard
What it is: An all-in-one heads-up display that answers three questions at a glance — Which way is my stock going? How much conviction is behind it? And is the money flowing into its sector? It scans up to 6 tickers of your choice plus ranks all 11 market sectors, right on your chart. Built for desktop and phone.
📊 What You're Looking At
The HUD has two panels:
1️⃣ Watchlist Panel — your 6 chosen tickers, one row each:
Column Meaning
TICKER The symbol being scanned
BIAS Direction + conviction: 🟢 LONG / 🔴 SHORT (strong, ≥70%), 🟡 WEAK L/S (building, 40–69%), ⚪ NEUTRAL
REGIME Market character: ⚡ DAY (volatile/intraday), 🌊 SWING (calm/trending), ➖ RANGE (chop)
TREND A mini score-history sparkline (▁▂▃▄▅▆▇█) with an arrow — ↗ = conviction strengthening, → = flat/fading
SECTOR The ticker's sector, its live rotation quadrant color, and rank (e.g. Tech 🟢#2)
2️⃣ Sector Rotation Panel — all 11 sectors ranked by relative strength:
Column Meaning
SECTOR Short label (Tech, Fin, Enrgy, Hlth, etc.)
QUADRANT 🟢 Leading, 🟡 Weakening, 🔴 Lagging, 🔵 Improving
STR/MOM The two RRG axes — Strength / Momentum
RANK Position 1–11, with 🥇🥈🥉 for the top three
🧠 How the Bias Score Works
Each ticker is graded 0–100% on four pillars:
Macro Trend (40 pts) — Higher-timeframe EMA structure (fast vs slow) confirms the big-picture direction.
Momentum (30 pts) — RSI in the healthy trend zone (not overextended).
Volume Confirmation (30 pts) — A volume spike in the direction of the move = real participation.
A score of ≥70% lights up 🟢 LONG or 🔴 SHORT. Between 40–69% it's a building 🟡 WEAK signal. Below that, ⚪ NEUTRAL.
🔄 How Sector Rotation Works (RRG Model)
Every sector is measured against a benchmark (default SPY, fully customizable) on two axes:
Strength — is it outperforming the benchmark over the long window?
Momentum — is that outperformance accelerating or fading?
Those two combine into the classic Relative Rotation Graph quadrants:
Quadrant Meaning Play
🟢 Leading Strong and accelerating Prime hunting ground for longs
🟡 Weakening Strong but losing steam Take profits / tighten stops
🔴 Lagging Weak and still falling Avoid longs / short candidates
🔵 Improving Weak but turning up Early rotation — watchlist for entries
Money typically rotates clockwise: Improving → Leading → Weakening → Lagging.
The STR/MOM column shows the two raw axes (e.g. 3.2 / 1.1 = outperforming and accelerating). Classic rotation flow is clockwise: Improving → Leading → Weakening → Lagging.
✅ The A+ Setup — Reading a Row in One Glance
The whole point is confluence. Your strongest trade lines up all three:
text
Copy
🟢 LONG (100%) + ▇█ ↗ + Tech 🟢#1
direction conviction money flow
That's a strong signal, still strengthening, in the #1 leading sector. Conversely, a 🟢 LONG whose sector reads 🔴#10 is a red flag — you'd be fighting the rotation.
⚙️ Setup (One-Time, ~2 Minutes)
Watchlist: Enter your 6 tickers and pick each one's sector from the dropdown. Set crypto/forex to None (their sector tag will show —).
Benchmark: Default SPY. Swap to QQQ (tech-relative), IWM (small-cap), or any symbol.
Mode: Choose Watchlist, Sector Rotation, or Both.
Display: Position, text size, transparency, colors, borders, and toggle any column on/off.
⚠️ Sector assignment is manual — Pine Script can't reliably auto-detect a stock's sector for scanned symbols. It's a 30-second, one-time setup and gives you 100% accurate, self-controlled tagging.
🔔 Discord Alerts (Optional)
The HUD can push formatted alerts to Discord on two events:
Bias Flip — a ticker crosses into 🟢 LONG or 🔴 SHORT
Momentum Strengthening — conviction starts accelerating (↗)
Each alert includes the ticker, bias, regime, trend, and its sector context:
text
Copy
NASDAQ:AAPL
Bias: 🟢 LONG (100%)
Regime: ⚡ DAY
Trend: ▇█ ↗
Sector: Tech 🟢#2
To wire it up:
In Discord: Server Settings → Integrations → Webhooks → New Webhook, copy the URL.
In TradingView: click the alarm clock ⏰ → Create Alert on this indicator.
Set Condition = Ultimate Matrix HUD, and under Notifications → Webhook URL, paste your Discord webhook.
Set the alert message to {{plot}} or leave default — the indicator sends its own JSON payload.
Alerts fire on bar close for reliability (no repaint-driven false pings).
📱 Mobile Tips
Set Text Size = Tiny/Small and bump Panel Transparency so price stays visible.
Hide columns you don't need (Regime, Trend, or Sector) to slim the panel.
Use Watchlist-only mode on phone for the cleanest view; switch to Both on desktop.
⚠️ Important Notes & Limitations
Live-bar values are provisional. All scores, ranks, and quadrants settle on bar close — treat the forming bar as an estimate.
Not financial advice. This is a decision-support dashboard, not a signal-to-blindly-trade. Always confirm with your own analysis and risk management.
Sector features are equity-focused. Set non-equity symbols (crypto/forex) to None.
Best on liquid symbols with real volume data — thinly traded names may give noisy volume/regime reads.
Timeframe: Works on any, but shines on 15m–4H for swing/intraday. Benchmark & windows are fully tunable in settings.
What it is: An all-in-one heads-up display that answers three questions at a glance — Which way is my stock going? How much conviction is behind it? And is the money flowing into its sector? It scans up to 6 tickers of your choice plus ranks all 11 market sectors, right on your chart. Built for desktop and phone.
📊 What You're Looking At
The HUD has two panels:
1️⃣ Watchlist Panel — your 6 chosen tickers, one row each:
Column Meaning
TICKER The symbol being scanned
BIAS Direction + conviction: 🟢 LONG / 🔴 SHORT (strong, ≥70%), 🟡 WEAK L/S (building, 40–69%), ⚪ NEUTRAL
REGIME Market character: ⚡ DAY (volatile/intraday), 🌊 SWING (calm/trending), ➖ RANGE (chop)
TREND A mini score-history sparkline (▁▂▃▄▅▆▇█) with an arrow — ↗ = conviction strengthening, → = flat/fading
SECTOR The ticker's sector, its live rotation quadrant color, and rank (e.g. Tech 🟢#2)
2️⃣ Sector Rotation Panel — all 11 sectors ranked by relative strength:
Column Meaning
SECTOR Short label (Tech, Fin, Enrgy, Hlth, etc.)
QUADRANT 🟢 Leading, 🟡 Weakening, 🔴 Lagging, 🔵 Improving
STR/MOM The two RRG axes — Strength / Momentum
RANK Position 1–11, with 🥇🥈🥉 for the top three
🧠 How the Bias Score Works
Each ticker is graded 0–100% on four pillars:
Macro Trend (40 pts) — Higher-timeframe EMA structure (fast vs slow) confirms the big-picture direction.
Momentum (30 pts) — RSI in the healthy trend zone (not overextended).
Volume Confirmation (30 pts) — A volume spike in the direction of the move = real participation.
A score of ≥70% lights up 🟢 LONG or 🔴 SHORT. Between 40–69% it's a building 🟡 WEAK signal. Below that, ⚪ NEUTRAL.
🔄 How Sector Rotation Works (RRG Model)
Every sector is measured against a benchmark (default SPY, fully customizable) on two axes:
Strength — is it outperforming the benchmark over the long window?
Momentum — is that outperformance accelerating or fading?
Those two combine into the classic Relative Rotation Graph quadrants:
Quadrant Meaning Play
🟢 Leading Strong and accelerating Prime hunting ground for longs
🟡 Weakening Strong but losing steam Take profits / tighten stops
🔴 Lagging Weak and still falling Avoid longs / short candidates
🔵 Improving Weak but turning up Early rotation — watchlist for entries
Money typically rotates clockwise: Improving → Leading → Weakening → Lagging.
The STR/MOM column shows the two raw axes (e.g. 3.2 / 1.1 = outperforming and accelerating). Classic rotation flow is clockwise: Improving → Leading → Weakening → Lagging.
✅ The A+ Setup — Reading a Row in One Glance
The whole point is confluence. Your strongest trade lines up all three:
text
Copy
🟢 LONG (100%) + ▇█ ↗ + Tech 🟢#1
direction conviction money flow
That's a strong signal, still strengthening, in the #1 leading sector. Conversely, a 🟢 LONG whose sector reads 🔴#10 is a red flag — you'd be fighting the rotation.
⚙️ Setup (One-Time, ~2 Minutes)
Watchlist: Enter your 6 tickers and pick each one's sector from the dropdown. Set crypto/forex to None (their sector tag will show —).
Benchmark: Default SPY. Swap to QQQ (tech-relative), IWM (small-cap), or any symbol.
Mode: Choose Watchlist, Sector Rotation, or Both.
Display: Position, text size, transparency, colors, borders, and toggle any column on/off.
⚠️ Sector assignment is manual — Pine Script can't reliably auto-detect a stock's sector for scanned symbols. It's a 30-second, one-time setup and gives you 100% accurate, self-controlled tagging.
🔔 Discord Alerts (Optional)
The HUD can push formatted alerts to Discord on two events:
Bias Flip — a ticker crosses into 🟢 LONG or 🔴 SHORT
Momentum Strengthening — conviction starts accelerating (↗)
Each alert includes the ticker, bias, regime, trend, and its sector context:
text
Copy
NASDAQ:AAPL
Bias: 🟢 LONG (100%)
Regime: ⚡ DAY
Trend: ▇█ ↗
Sector: Tech 🟢#2
To wire it up:
In Discord: Server Settings → Integrations → Webhooks → New Webhook, copy the URL.
In TradingView: click the alarm clock ⏰ → Create Alert on this indicator.
Set Condition = Ultimate Matrix HUD, and under Notifications → Webhook URL, paste your Discord webhook.
Set the alert message to {{plot}} or leave default — the indicator sends its own JSON payload.
Alerts fire on bar close for reliability (no repaint-driven false pings).
📱 Mobile Tips
Set Text Size = Tiny/Small and bump Panel Transparency so price stays visible.
Hide columns you don't need (Regime, Trend, or Sector) to slim the panel.
Use Watchlist-only mode on phone for the cleanest view; switch to Both on desktop.
⚠️ Important Notes & Limitations
Live-bar values are provisional. All scores, ranks, and quadrants settle on bar close — treat the forming bar as an estimate.
Not financial advice. This is a decision-support dashboard, not a signal-to-blindly-trade. Always confirm with your own analysis and risk management.
Sector features are equity-focused. Set non-equity symbols (crypto/forex) to None.
Best on liquid symbols with real volume data — thinly traded names may give noisy volume/regime reads.
Timeframe: Works on any, but shines on 15m–4H for swing/intraday. Benchmark & windows are fully tunable in settings.
릴리즈 노트
Release Notes / Changelogv8 — Foundation (initial public release)
• 6-slot Watchlist HUD with the 4-pillar bias engine and tiered LONG/SHORT/WEAK/NEUTRAL scoring.
• REGIME, TREND (sparkline + strengthening arrow), and SECTOR context columns.
• Sector Rotation panel — 11 SPDR ETFs ranked by full RRG quadrant model vs. a customizable benchmark.
• Mode toggle (Watchlist / Sector Rotation / Both) and Discord alerts on bias flip + momentum strengthening.
• Full display customization; disciplined no-nested-request.security architecture.
v9 — Price, Compact & Cooldown
• 💲 Live Price column — magnitude-aware precision; colored green/red by change; zero new data requests.
• 📱 Compact Mode — one toggle collapses the HUD to Ticker · Price · Bias in tiny text.
• 🔕 Alert Cooldown — minimum bars between alerts per ticker (0 = off).
• 📨 Richer Discord alerts — payload now includes live price alongside bias, regime, trend, and sector.
v9.1 — Daily % + Guided Setup
• 📊 Bar / Day % change toggle — price change reads intrabar (vs. previous bar close, no extra data) or true session change (vs. prior daily close, guarded).
• 💬 Quick-start tooltips added throughout settings — Mode, sector tags, HTF, sparkline, and both rotation windows.
• 🗺️ In-script sector cheat-sheet mapping default tickers + common swaps to their correct sector inputs.
• Discord payload and price coloring stay in sync with the selected % basis.
v9.2 — Independent Sector Timeframe
• 🔒 Rotation Timeframe input — the sector rotation scan can now be locked to a fixed timeframe (default Daily) independent of your chart. Leave blank to follow the chart like before.
• 🧱 History integrity — RS-Ratio/RS-Mom windows now advance once per rotation bar (via timeframe.change), so a "60-bar" window means 60 true days, not 60 chart bars.
• 🛡️ Non-repainting rotation — daily RS values commit on the daily close, so intraday sector reads stay stable through the session.
• Watchlist bias engine still follows the chart timeframe for entry timing.
오픈 소스 스크립트
트레이딩뷰의 진정한 정신에 따라, 이 스크립트의 작성자는 이를 오픈소스로 공개하여 트레이더들이 기능을 검토하고 검증할 수 있도록 했습니다. 작성자에게 찬사를 보냅니다! 이 코드는 무료로 사용할 수 있지만, 코드를 재게시하는 경우 하우스 룰이 적용된다는 점을 기억하세요.

You can always take more, you can never take less.
면책사항
해당 정보와 게시물은 금융, 투자, 트레이딩 또는 기타 유형의 조언이나 권장 사항으로 간주되지 않으며, 트레이딩뷰에서 제공하거나 보증하는 것이 아닙니다. 자세한 내용은 이용 약관을 참조하세요.
오픈 소스 스크립트
트레이딩뷰의 진정한 정신에 따라, 이 스크립트의 작성자는 이를 오픈소스로 공개하여 트레이더들이 기능을 검토하고 검증할 수 있도록 했습니다. 작성자에게 찬사를 보냅니다! 이 코드는 무료로 사용할 수 있지만, 코드를 재게시하는 경우 하우스 룰이 적용된다는 점을 기억하세요.
You can always take more, you can never take less.
면책사항
해당 정보와 게시물은 금융, 투자, 트레이딩 또는 기타 유형의 조언이나 권장 사항으로 간주되지 않으며, 트레이딩뷰에서 제공하거나 보증하는 것이 아닙니다. 자세한 내용은 이용 약관을 참조하세요.