OPEN-SOURCE SCRIPT
Maket Strat Absorption Bubbles
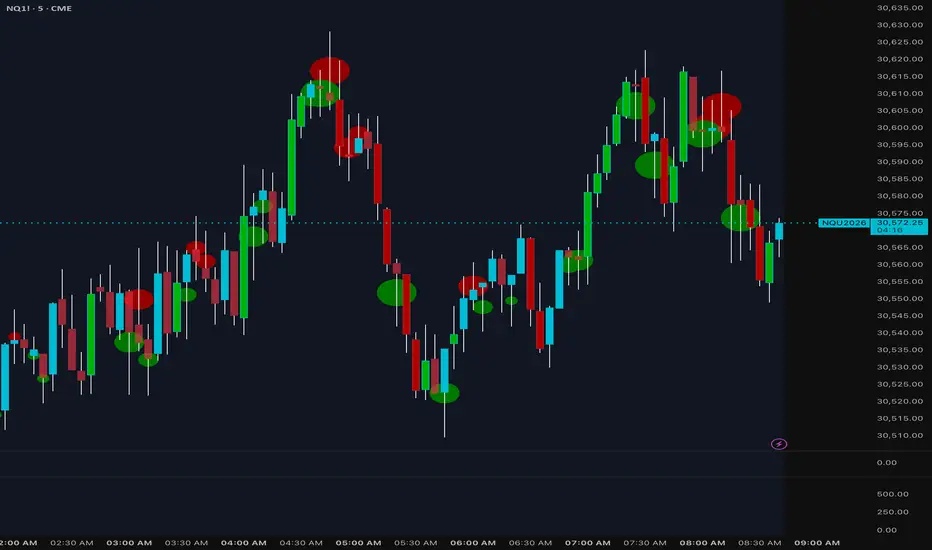
# Market Strategies Absorption Bubbles
Market Strategies Absorption Bubbles is designed to help traders identify potential absorption events where aggressive buying or selling is being absorbed by larger participants. These areas can often signal hidden liquidity, exhaustion, reversals, or important decision points within the market.
The indicator analyzes relative volume compared to historical volume activity and highlights candles where significant volume is occurring within key wick regions of the bar.
## How It Works
The script measures current volume against a normalized volume standard deviation model to identify unusually high participation.
When elevated volume is detected:
🟢 **Green Bubbles (Buying Absorption)**
* Appear in the lower wick region.
* Suggest sellers pushed price lower, but buyers absorbed the selling pressure.
* Can indicate potential support, accumulation, or reversal zones.
🔴 **Red Bubbles (Selling Absorption)**
* Appear in the upper wick region.
* Suggest buyers pushed price higher, but sellers absorbed the buying pressure.
* Can indicate potential resistance, distribution, or reversal zones.
## Bubble Strength
Bubble size increases with relative volume strength:
• Small = Elevated Volume
• Medium = Strong Volume
• Large = High Volume
• Strong = Very High Volume
• Extreme = Exceptional Volume
Larger bubbles represent greater participation and potentially more significant absorption activity.
## Heavy Volume Body Detection
The indicator also highlights candles experiencing exceptionally high volume within the candle body itself.
Bullish heavy-volume candles are colored dark green.
Bearish heavy-volume candles are colored dark red.
These candles can help traders quickly identify areas where institutional activity may be present.
## Alerts Included
✔ Buying Absorption Bubble
✔ Selling Absorption Bubble
✔ Any Absorption Bubble
Alerts trigger only on confirmed bars to reduce false signals from intrabar fluctuations.
## Best Uses
* Market Structure Analysis
* Reversal Identification
* Liquidity Sweeps
* Support & Resistance Confirmation
* Order Flow Confluence
* Auction Market Theory
* Volume-Based Trading Systems
## Market Strategies Tip
Absorption signals are most effective when combined with market structure, liquidity sweeps, VWAP, value areas, supply and demand zones, and higher timeframe directional bias. The strongest setups occur when absorption aligns with key technical levels and confirms a shift in order flow.
Built for traders who want to see where significant volume meets price rejection and where smart money may be actively defending important levels.
Market Strategies Absorption Bubbles is designed to help traders identify potential absorption events where aggressive buying or selling is being absorbed by larger participants. These areas can often signal hidden liquidity, exhaustion, reversals, or important decision points within the market.
The indicator analyzes relative volume compared to historical volume activity and highlights candles where significant volume is occurring within key wick regions of the bar.
## How It Works
The script measures current volume against a normalized volume standard deviation model to identify unusually high participation.
When elevated volume is detected:
🟢 **Green Bubbles (Buying Absorption)**
* Appear in the lower wick region.
* Suggest sellers pushed price lower, but buyers absorbed the selling pressure.
* Can indicate potential support, accumulation, or reversal zones.
🔴 **Red Bubbles (Selling Absorption)**
* Appear in the upper wick region.
* Suggest buyers pushed price higher, but sellers absorbed the buying pressure.
* Can indicate potential resistance, distribution, or reversal zones.
## Bubble Strength
Bubble size increases with relative volume strength:
• Small = Elevated Volume
• Medium = Strong Volume
• Large = High Volume
• Strong = Very High Volume
• Extreme = Exceptional Volume
Larger bubbles represent greater participation and potentially more significant absorption activity.
## Heavy Volume Body Detection
The indicator also highlights candles experiencing exceptionally high volume within the candle body itself.
Bullish heavy-volume candles are colored dark green.
Bearish heavy-volume candles are colored dark red.
These candles can help traders quickly identify areas where institutional activity may be present.
## Alerts Included
✔ Buying Absorption Bubble
✔ Selling Absorption Bubble
✔ Any Absorption Bubble
Alerts trigger only on confirmed bars to reduce false signals from intrabar fluctuations.
## Best Uses
* Market Structure Analysis
* Reversal Identification
* Liquidity Sweeps
* Support & Resistance Confirmation
* Order Flow Confluence
* Auction Market Theory
* Volume-Based Trading Systems
## Market Strategies Tip
Absorption signals are most effective when combined with market structure, liquidity sweeps, VWAP, value areas, supply and demand zones, and higher timeframe directional bias. The strongest setups occur when absorption aligns with key technical levels and confirms a shift in order flow.
Built for traders who want to see where significant volume meets price rejection and where smart money may be actively defending important levels.
오픈 소스 스크립트
트레이딩뷰의 진정한 정신에 따라, 이 스크립트의 작성자는 이를 오픈소스로 공개하여 트레이더들이 기능을 검토하고 검증할 수 있도록 했습니다. 작성자에게 찬사를 보냅니다! 이 코드는 무료로 사용할 수 있지만, 코드를 재게시하는 경우 하우스 룰이 적용된다는 점을 기억하세요.

면책사항
해당 정보와 게시물은 금융, 투자, 트레이딩 또는 기타 유형의 조언이나 권장 사항으로 간주되지 않으며, 트레이딩뷰에서 제공하거나 보증하는 것이 아닙니다. 자세한 내용은 이용 약관을 참조하세요.
오픈 소스 스크립트
트레이딩뷰의 진정한 정신에 따라, 이 스크립트의 작성자는 이를 오픈소스로 공개하여 트레이더들이 기능을 검토하고 검증할 수 있도록 했습니다. 작성자에게 찬사를 보냅니다! 이 코드는 무료로 사용할 수 있지만, 코드를 재게시하는 경우 하우스 룰이 적용된다는 점을 기억하세요.
면책사항
해당 정보와 게시물은 금융, 투자, 트레이딩 또는 기타 유형의 조언이나 권장 사항으로 간주되지 않으며, 트레이딩뷰에서 제공하거나 보증하는 것이 아닙니다. 자세한 내용은 이용 약관을 참조하세요.