OPEN-SOURCE SCRIPT
업데이트됨 Smooths 50 Point Levels
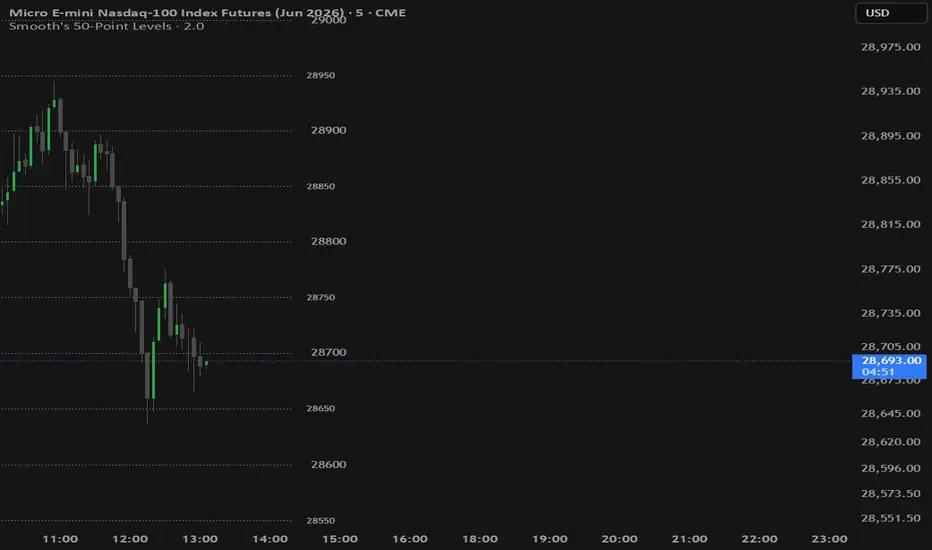
Smooth's 50-Point Levels
Overview
This indicator automatically plots horizontal price levels at every 50-point interval across the chart, centered around the current price. It is designed specifically for futures traders (NQ, ES, MNQ, MES) who use round-number price levels as key reference points for support, resistance, entries, and targets.
How It Works
The indicator calculates the nearest 50-point boundary to the current price using math.round(price / 50) * 50 as its base, then draws a configurable number of levels above and below that base. Levels are split into two distinct categories:
Round Hundreds (X00) — levels ending in 00 (e.g. 19800, 19900, 20000). These represent major psychological price levels where institutional activity and order flow tend to concentrate.
Half-Hundreds (X50) — levels ending in 50 (e.g. 19850, 19950). These act as midpoint references between the major levels, useful for identifying equilibrium zones and scalp targets.
Session Reset
Lines reset visually at a user-defined time each day (default 16:00 ET), meaning the left edge of every line anchors to that bar. This keeps the chart clean and session-specific — only showing levels relevant to the current trading session. A toggle allows lines to be extended further left for historical context.
How To Use
Use Round Hundred levels as primary support/resistance and trade targets
Use Half-Hundred levels as midpoint references and short-term scalp zones
Levels reset at 16:00 ET daily to reflect the new session's relevant price range
Adjust the number of levels displayed to match your trading range
Enable left extension when reviewing previous session price action
Customization
Each level group has independent controls for color, line style (solid/dashed/dotted), line width, label visibility, and label size. Right extension allows lines to project into future bars for forward reference.
Overview
This indicator automatically plots horizontal price levels at every 50-point interval across the chart, centered around the current price. It is designed specifically for futures traders (NQ, ES, MNQ, MES) who use round-number price levels as key reference points for support, resistance, entries, and targets.
How It Works
The indicator calculates the nearest 50-point boundary to the current price using math.round(price / 50) * 50 as its base, then draws a configurable number of levels above and below that base. Levels are split into two distinct categories:
Round Hundreds (X00) — levels ending in 00 (e.g. 19800, 19900, 20000). These represent major psychological price levels where institutional activity and order flow tend to concentrate.
Half-Hundreds (X50) — levels ending in 50 (e.g. 19850, 19950). These act as midpoint references between the major levels, useful for identifying equilibrium zones and scalp targets.
Session Reset
Lines reset visually at a user-defined time each day (default 16:00 ET), meaning the left edge of every line anchors to that bar. This keeps the chart clean and session-specific — only showing levels relevant to the current trading session. A toggle allows lines to be extended further left for historical context.
How To Use
Use Round Hundred levels as primary support/resistance and trade targets
Use Half-Hundred levels as midpoint references and short-term scalp zones
Levels reset at 16:00 ET daily to reflect the new session's relevant price range
Adjust the number of levels displayed to match your trading range
Enable left extension when reviewing previous session price action
Customization
Each level group has independent controls for color, line style (solid/dashed/dotted), line width, label visibility, and label size. Right extension allows lines to project into future bars for forward reference.
릴리즈 노트
New group added — Display ModeAdded a "Right Side Only Mode" toggle (right_mode) that switches the entire drawing behavior. When off, the indicator works exactly as originally published. When on, it switches to the floating right-side layout.
Four new inputs under this group: gap_bars (space between current bar and line start), line_length (how long the lines extend in bars), and text_gap (how many bars of space to leave on each side of the inline label).
Original Mode group
The existing Bars Right, Extend Lines Left, and Bars Left When Extended inputs were moved into their own group called "Original Mode" to keep the settings panel organized now that there are two modes.
Session Reset group
Unchanged — just clarified in the group name that it only applies to Original Mode.
Drawing logic — right mode
When right_mode is on, instead of drawing one full line per level, the script draws two half-lines with a gap between them. The left half runs from bar_index + gap_bars to the midpoint minus text_gap. The right half runs from the midpoint plus text_gap to the end. The label sits at the midpoint using label.style_label_center with a fully transparent background, making it appear inline inside the gap rather than floating above or to the side.
Drawing logic — original mode
No changes. The session reset, extend left, bars right, and label behavior are all identical to the originally published version.
오픈 소스 스크립트
트레이딩뷰의 진정한 정신에 따라, 이 스크립트의 작성자는 이를 오픈소스로 공개하여 트레이더들이 기능을 검토하고 검증할 수 있도록 했습니다. 작성자에게 찬사를 보냅니다! 이 코드는 무료로 사용할 수 있지만, 코드를 재게시하는 경우 하우스 룰이 적용된다는 점을 기억하세요.

면책사항
해당 정보와 게시물은 금융, 투자, 트레이딩 또는 기타 유형의 조언이나 권장 사항으로 간주되지 않으며, 트레이딩뷰에서 제공하거나 보증하는 것이 아닙니다. 자세한 내용은 이용 약관을 참조하세요.
오픈 소스 스크립트
트레이딩뷰의 진정한 정신에 따라, 이 스크립트의 작성자는 이를 오픈소스로 공개하여 트레이더들이 기능을 검토하고 검증할 수 있도록 했습니다. 작성자에게 찬사를 보냅니다! 이 코드는 무료로 사용할 수 있지만, 코드를 재게시하는 경우 하우스 룰이 적용된다는 점을 기억하세요.
면책사항
해당 정보와 게시물은 금융, 투자, 트레이딩 또는 기타 유형의 조언이나 권장 사항으로 간주되지 않으며, 트레이딩뷰에서 제공하거나 보증하는 것이 아닙니다. 자세한 내용은 이용 약관을 참조하세요.