Median Deviation Anchor | TR
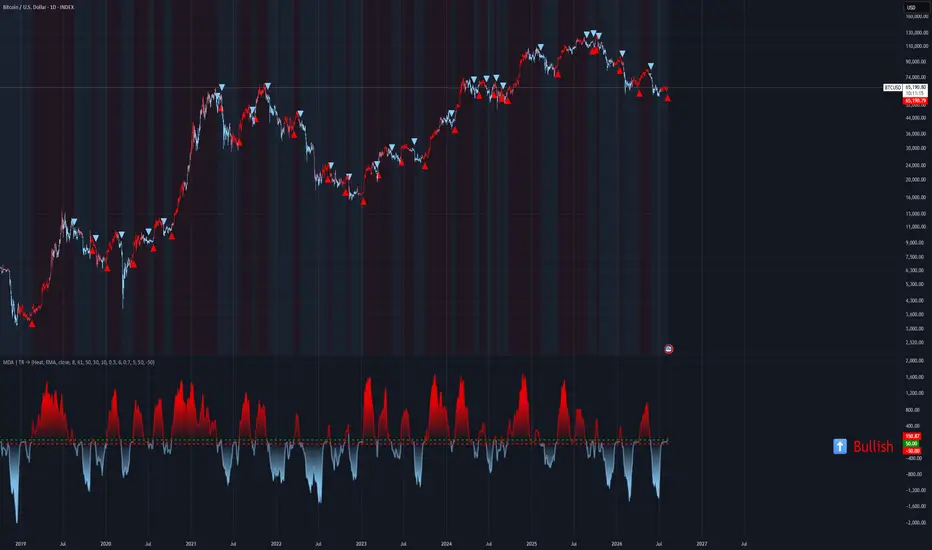
🎯 Overview
Median Deviation Anchor | TR is a trend‑detection oscillator that uses a percentile‑based median of a chosen moving average as its central anchor. It measures price deviation relative to this median, scaled by ATR bands and standard deviation zones, to generate bullish/bearish signals. The oscillator is smoothed, normalized, and presented with rich visual feedback including gradient candles, dynamic fills, reversal markers, and a persistent trend table. It’s designed to capture trend strength and reversals with a robust statistical foundation.
⚙️ Core Calculations
1. Moving Average Baseline
The indicator first computes a moving average of the Source (default close) using one of 13 moving average types (EMA, SMA, RMA, WMA, VWMA, HMA, DEMA, TEMA, TRIMA, FRAMA, SWMA, ALMA, T3).
User‑adjustable: Length (default 8), Factor/Sigma for ALMA/T3.
2. Median Anchor
Median_Val = ta.percentile_nearest_rank(MA, Median_Length, Median_per)
– This returns the value at the given percentile (default 50ᵗʰ percentile, i.e., the median) of the MA over Median_Length (default 61) bars.
→ This median acts as the dynamic “center” of the trend.
3. Deviation Bands (Upper/Lower Anchors)
ATR Band (based on ta.atr(ATR_Length)):
Upper_ATR = Median_Val + ATR_Mult * ATR
Lower_ATR = Median_Val - ATR_Mult * ATR
Standard Deviation Band (based on ta.stdev(Median_Val, Length_SD)):
SD_L = Median_Val + ST_Dev (upper +1σ)
SD_S = Median_Val - ST_Dev (lower -1σ)
4. Raw Oscillator (rawOsc)
Two conditions decide the raw value:
Bullish condition (L_Bull_MDA): (Source > Lower_ATR) and (Source >= SD_L)
Then bullForce = (Source - Median_Val) / (Median_Val - Lower_ATR) * 100
→ positive values (0 to +∞)
Bearish condition (S_Bear_MDA): (Source < Upper_ATR) and (Source <= SD_S)
Then bearForce = (Source - Median_Val) / (Upper_ATR - Median_Val) * 100
→ negative values (0 to –∞)
Otherwise rawOsc = 0.
5. Smoothing & Clamping
oscValue = ta.ema(rawOsc, smoothOsc) (user‑defined smoothOsc length, default 5).
osc = math.min(math.max(oscValue, -2000), 2000) – clamps extreme values.
📊 Normalisation & Dynamic Styling
Momentum for Fill Transparency:
absOsc = math.abs(osc) → maxAbsOsc = ta.highest(absOsc, 50) → normalised normAbsOsc → Fill_Transp_OSC = int(math.max(0, math.min(100, 35 - (normAbsOsc * 25))))
→ higher oscillator magnitude ⇒ less transparency (more vivid fills).
Gradient Coloring for Candles:
oscNorm is re‑scaled over the last 50 bars to [0,1] → candle color interpolates between DnC (bearish) and UpC (bullish) using color.from_gradient.
Color Themes: 9 predefined schemes (Classic, Modern, Heat, Robust, Accented, Monochrome, Moderate, Aqua, Cosmic) with custom bullish/bearish colours.
📈 Signal System
1. Trend Determination (Trend_MDA)
Bullish when osc > Upper_Band (user‑defined Long Threshold, default 50). Sets Trend_MDA = 1.
Bearish when osc < Lower_Band (user‑defined Short Threshold, default -50). Sets Trend_MDA = -1.
Otherwise holds previous value.
2. Reversal Signals (plot as triangles)
Bullish Reversal (reversalBull): Trend_MDA == 1 and Trend_MDA[1] == -1 → green triangle below bar.
Bearish Reversal (reversalBear): Trend_MDA == -1 and Trend_MDA[1] == 1 → red triangle above bar.
3. Alerts (4 conditions)
Bullish MDA – triggered when isBull_MDA (osc > Upper_Band)
Bearish MDA – triggered when isBear_MDA (osc < Lower_Band)
Bullish Cross – ta.crossover(osc, 0)
Bearish Cross – ta.crossunder(osc, 0)
🎨 Visual Features
Trend Table Displays “⬆️ Bullish” or “⬇️ Bearish” (or “➖ Neutral”)
📖 Interpretation Guide
Positive values (osc > 0) indicate price is above the median anchor (bullish bias).
Negative values (osc < 0) indicate price below the median (bearish bias).
Crossing ±50 (default thresholds) signals a confirmed trend change (bullish >50, bearish < -50).
Crossing zero may be used as an early warning of trend shift (alerts available).
Reversal triangles appear when the oscillator crosses a threshold in the opposite direction after being in the other regime – these are potential entry/exit signals.
The dynamic fill transparency highlights momentum: intense colour = strong price deviation.
🚨 Alert Summary
Four alert conditions are ready for automation:
Bullish MDA – enters long zone (osc > Upper_Band)
Bearish MDA – enters short zone (osc < Lower_Band)
Bullish Cross – oscillator crosses above zero
Bearish Cross – oscillator crosses below zero
All alerts can be enabled via the TradingView alerts panel.
Median Deviation Anchor | TR is a trend‑detection oscillator that uses a percentile‑based median of a chosen moving average as its central anchor. It measures price deviation relative to this median, scaled by ATR bands and standard deviation zones, to generate bullish/bearish signals. The oscillator is smoothed, normalized, and presented with rich visual feedback including gradient candles, dynamic fills, reversal markers, and a persistent trend table. It’s designed to capture trend strength and reversals with a robust statistical foundation.
⚙️ Core Calculations
1. Moving Average Baseline
The indicator first computes a moving average of the Source (default close) using one of 13 moving average types (EMA, SMA, RMA, WMA, VWMA, HMA, DEMA, TEMA, TRIMA, FRAMA, SWMA, ALMA, T3).
User‑adjustable: Length (default 8), Factor/Sigma for ALMA/T3.
2. Median Anchor
Median_Val = ta.percentile_nearest_rank(MA, Median_Length, Median_per)
– This returns the value at the given percentile (default 50ᵗʰ percentile, i.e., the median) of the MA over Median_Length (default 61) bars.
→ This median acts as the dynamic “center” of the trend.
3. Deviation Bands (Upper/Lower Anchors)
ATR Band (based on ta.atr(ATR_Length)):
Upper_ATR = Median_Val + ATR_Mult * ATR
Lower_ATR = Median_Val - ATR_Mult * ATR
Standard Deviation Band (based on ta.stdev(Median_Val, Length_SD)):
SD_L = Median_Val + ST_Dev (upper +1σ)
SD_S = Median_Val - ST_Dev (lower -1σ)
4. Raw Oscillator (rawOsc)
Two conditions decide the raw value:
Bullish condition (L_Bull_MDA): (Source > Lower_ATR) and (Source >= SD_L)
Then bullForce = (Source - Median_Val) / (Median_Val - Lower_ATR) * 100
→ positive values (0 to +∞)
Bearish condition (S_Bear_MDA): (Source < Upper_ATR) and (Source <= SD_S)
Then bearForce = (Source - Median_Val) / (Upper_ATR - Median_Val) * 100
→ negative values (0 to –∞)
Otherwise rawOsc = 0.
5. Smoothing & Clamping
oscValue = ta.ema(rawOsc, smoothOsc) (user‑defined smoothOsc length, default 5).
osc = math.min(math.max(oscValue, -2000), 2000) – clamps extreme values.
📊 Normalisation & Dynamic Styling
Momentum for Fill Transparency:
absOsc = math.abs(osc) → maxAbsOsc = ta.highest(absOsc, 50) → normalised normAbsOsc → Fill_Transp_OSC = int(math.max(0, math.min(100, 35 - (normAbsOsc * 25))))
→ higher oscillator magnitude ⇒ less transparency (more vivid fills).
Gradient Coloring for Candles:
oscNorm is re‑scaled over the last 50 bars to [0,1] → candle color interpolates between DnC (bearish) and UpC (bullish) using color.from_gradient.
Color Themes: 9 predefined schemes (Classic, Modern, Heat, Robust, Accented, Monochrome, Moderate, Aqua, Cosmic) with custom bullish/bearish colours.
📈 Signal System
1. Trend Determination (Trend_MDA)
Bullish when osc > Upper_Band (user‑defined Long Threshold, default 50). Sets Trend_MDA = 1.
Bearish when osc < Lower_Band (user‑defined Short Threshold, default -50). Sets Trend_MDA = -1.
Otherwise holds previous value.
2. Reversal Signals (plot as triangles)
Bullish Reversal (reversalBull): Trend_MDA == 1 and Trend_MDA[1] == -1 → green triangle below bar.
Bearish Reversal (reversalBear): Trend_MDA == -1 and Trend_MDA[1] == 1 → red triangle above bar.
3. Alerts (4 conditions)
Bullish MDA – triggered when isBull_MDA (osc > Upper_Band)
Bearish MDA – triggered when isBear_MDA (osc < Lower_Band)
Bullish Cross – ta.crossover(osc, 0)
Bearish Cross – ta.crossunder(osc, 0)
🎨 Visual Features
Trend Table Displays “⬆️ Bullish” or “⬇️ Bearish” (or “➖ Neutral”)
📖 Interpretation Guide
Positive values (osc > 0) indicate price is above the median anchor (bullish bias).
Negative values (osc < 0) indicate price below the median (bearish bias).
Crossing ±50 (default thresholds) signals a confirmed trend change (bullish >50, bearish < -50).
Crossing zero may be used as an early warning of trend shift (alerts available).
Reversal triangles appear when the oscillator crosses a threshold in the opposite direction after being in the other regime – these are potential entry/exit signals.
The dynamic fill transparency highlights momentum: intense colour = strong price deviation.
🚨 Alert Summary
Four alert conditions are ready for automation:
Bullish MDA – enters long zone (osc > Upper_Band)
Bearish MDA – enters short zone (osc < Lower_Band)
Bullish Cross – oscillator crosses above zero
Bearish Cross – oscillator crosses below zero
All alerts can be enabled via the TradingView alerts panel.

면책사항
해당 정보와 게시물은 금융, 투자, 트레이딩 또는 기타 유형의 조언이나 권장 사항으로 간주되지 않으며, 트레이딩뷰에서 제공하거나 보증하는 것이 아닙니다. 자세한 내용은 이용 약관을 참조하세요.
면책사항
해당 정보와 게시물은 금융, 투자, 트레이딩 또는 기타 유형의 조언이나 권장 사항으로 간주되지 않으며, 트레이딩뷰에서 제공하거나 보증하는 것이 아닙니다. 자세한 내용은 이용 약관을 참조하세요.