Momentum Range Flip @MaxMaserati
Momentum Range Flip
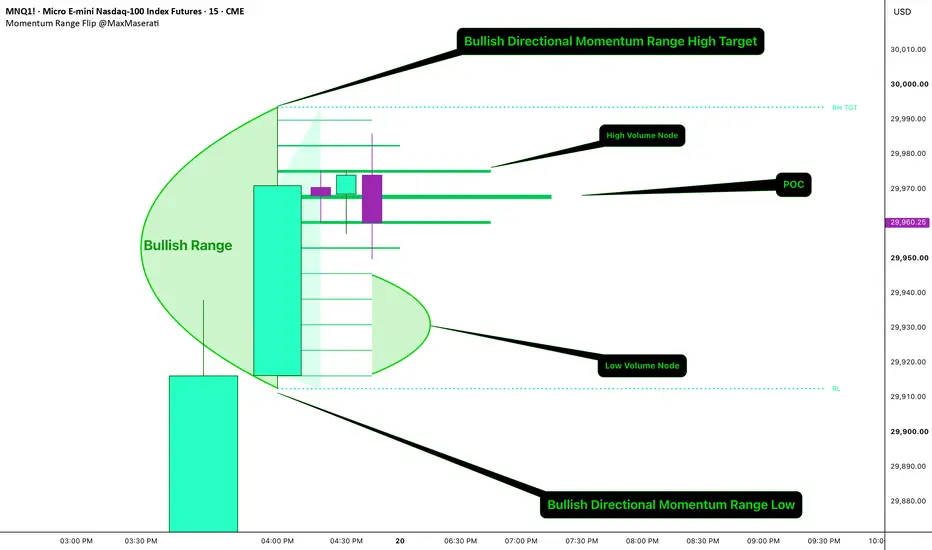
Momentum Range Flip flags a body-close breakout candle, then tracks how far price runs from it before reversing back through the origin. While the range is open, it splits the volume traded inside it into estimated buy and sell volume per price level, then sorts those levels into a Point of Control, High Volume Nodes, and Low Volume Nodes.
─── RANGE ANCHOR AND EXPANSION ───
A momentum candle closes above the prior high or below the prior low, checked only on confirmed bars. Immediate Body Close anchors on that candle; Wait for NBC waits for one inside/balance candle to close first, then anchors back to the breakout candle. Once anchored, the range top and bottom track the highest high and lowest low seen so far. Expansion Method sets whether those bounds update live, tick by tick, or only on candle close. A close back outside the range in the opposite direction ends it.

─── DELTA VOLUME PROFILE, POC, HVN, AND LVN ───
Each bar inside the range splits its volume into buy and sell using:
buy % = clamp(0.5 + body-to-range ratio × 0.3 − wick ratio × 0.1, 0.1, 0.9)
That split is spread across price bins sized by Ticks per Bin. The single bin with the highest total volume becomes the Point of Control (POC). Any other bin at or above the HVN Threshold percent of that top bin is a High Volume Node — a price level heavy trading defended. Any bin at or below the LVN Threshold percent is a Low Volume Node — a price level trading passed through fast, with little resistance. POC, HVN, and LVN each have their own show/hide toggle and line width, so you can isolate any one layer.
─── HOW TO USE ───
1. Wait for the wedge box to appear — this marks a new momentum range, colored by its bullish or bearish bias.
2. Read the RH / RH TGT and RL / RL TGT labels for the current top and bottom of the range.
3. Find the thickest line — that is the POC, the price level with the most volume traded inside the range.
4. Check the High Volume Node lines for other price levels where volume built up; these tend to act as support or resistance if price returns.
5. Check the Low Volume Node lines for gaps in volume; price tends to move through these fast rather than stall.
6. A candle closing beyond the top or bottom line ends the range; treat that as invalidation of the current bias.
─── SETTINGS ───
Calculation Logic — choose the anchor trigger (Immediate vs Wait for NBC) and the expansion method (Live vs Wait for Candle Close).
Colors and Style — wedge fill transparency, bullish/bearish colors, extension line width.
Structure Targets — how far the target lines and labels extend, and their label size.
Delta Volume Profile and POC — toggle the profile, set bin size (Ticks per Bin) and max profile width, then independently toggle and set the line width for POC, HVN (with its own volume threshold), and LVN (with its own volume threshold). Buy/sell colors apply across all three.
─── NOTES ───
In Live (Tick-by-Tick) mode, the range bounds and volume profile update using unclosed, live wick prices and can shift before the bar closes. Switch to Wait for Candle Close for calculations that only use confirmed values. The buy/sell volume split is an estimate based on candle structure, not real order flow data. HVN and LVN thresholds are relative to the biggest bin in the current range, not a fixed volume number. Built for intraday futures charts (ES, NQ) but works on any liquid symbol with volume data.
Momentum Range Flip flags a body-close breakout candle, then tracks how far price runs from it before reversing back through the origin. While the range is open, it splits the volume traded inside it into estimated buy and sell volume per price level, then sorts those levels into a Point of Control, High Volume Nodes, and Low Volume Nodes.
─── RANGE ANCHOR AND EXPANSION ───
A momentum candle closes above the prior high or below the prior low, checked only on confirmed bars. Immediate Body Close anchors on that candle; Wait for NBC waits for one inside/balance candle to close first, then anchors back to the breakout candle. Once anchored, the range top and bottom track the highest high and lowest low seen so far. Expansion Method sets whether those bounds update live, tick by tick, or only on candle close. A close back outside the range in the opposite direction ends it.
─── DELTA VOLUME PROFILE, POC, HVN, AND LVN ───
Each bar inside the range splits its volume into buy and sell using:
buy % = clamp(0.5 + body-to-range ratio × 0.3 − wick ratio × 0.1, 0.1, 0.9)
That split is spread across price bins sized by Ticks per Bin. The single bin with the highest total volume becomes the Point of Control (POC). Any other bin at or above the HVN Threshold percent of that top bin is a High Volume Node — a price level heavy trading defended. Any bin at or below the LVN Threshold percent is a Low Volume Node — a price level trading passed through fast, with little resistance. POC, HVN, and LVN each have their own show/hide toggle and line width, so you can isolate any one layer.
─── HOW TO USE ───
1. Wait for the wedge box to appear — this marks a new momentum range, colored by its bullish or bearish bias.
2. Read the RH / RH TGT and RL / RL TGT labels for the current top and bottom of the range.
3. Find the thickest line — that is the POC, the price level with the most volume traded inside the range.
4. Check the High Volume Node lines for other price levels where volume built up; these tend to act as support or resistance if price returns.
5. Check the Low Volume Node lines for gaps in volume; price tends to move through these fast rather than stall.
6. A candle closing beyond the top or bottom line ends the range; treat that as invalidation of the current bias.
─── SETTINGS ───
Calculation Logic — choose the anchor trigger (Immediate vs Wait for NBC) and the expansion method (Live vs Wait for Candle Close).
Colors and Style — wedge fill transparency, bullish/bearish colors, extension line width.
Structure Targets — how far the target lines and labels extend, and their label size.
Delta Volume Profile and POC — toggle the profile, set bin size (Ticks per Bin) and max profile width, then independently toggle and set the line width for POC, HVN (with its own volume threshold), and LVN (with its own volume threshold). Buy/sell colors apply across all three.
─── NOTES ───
In Live (Tick-by-Tick) mode, the range bounds and volume profile update using unclosed, live wick prices and can shift before the bar closes. Switch to Wait for Candle Close for calculations that only use confirmed values. The buy/sell volume split is an estimate based on candle structure, not real order flow data. HVN and LVN thresholds are relative to the biggest bin in the current range, not a fixed volume number. Built for intraday futures charts (ES, NQ) but works on any liquid symbol with volume data.

MMM : No body close (PO4), No Trade.
maxmaserati.com/
maxmaserati.com/
면책사항
해당 정보와 게시물은 금융, 투자, 트레이딩 또는 기타 유형의 조언이나 권장 사항으로 간주되지 않으며, 트레이딩뷰에서 제공하거나 보증하는 것이 아닙니다. 자세한 내용은 이용 약관을 참조하세요.
MMM : No body close (PO4), No Trade.
maxmaserati.com/
maxmaserati.com/
면책사항
해당 정보와 게시물은 금융, 투자, 트레이딩 또는 기타 유형의 조언이나 권장 사항으로 간주되지 않으며, 트레이딩뷰에서 제공하거나 보증하는 것이 아닙니다. 자세한 내용은 이용 약관을 참조하세요.