Dynamic RSI Trend [NJ]
✧ OVERVIEW ✧
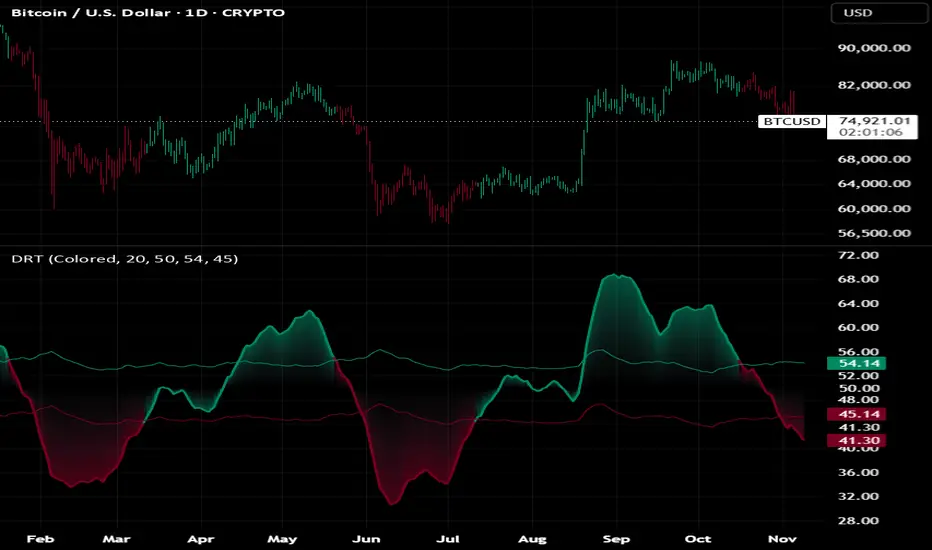
Dynamic RSI Trend is a momentum-based, trend-following oscillator that compares a smoothed RSI with two thresholds that move based on the volatility of the RSI itself.
Instead of using fixed levels, both thresholds shift up or down depending on whether the smoothed RSI is currently moving faster or slower than usual.
Smoothed RSI crossing the dynamic thresholds is used to identify bullish and bearish conditions, which are displayed using colored candles, a colored oscillator and a gradient glow.
✧ SETTINGS ✧
Color Mode
Switches between colored and neutral visualization.
Color Candles
Shows or hides candle coloring based on the current signal.
RSI Smoothing
Controls how many bars are used for the EMA applied to the RSI.
ATR Smoothing
Controls how many bars are used to calculate the average volatility of the smoothed RSI.
Threshold 1
Controls the base level of the first dynamic threshold.
Threshold 2
Controls the base level of the second dynamic threshold.
✧ HOW IT WORKS ✧
Smoothed RSI
A 14-period RSI of closing price is smoothed with an EMA over RSI Smoothing.
RSI Volatility
Indicator measures how much the smoothed RSI moves from bar to bar, similar to how ATR measures price movement.
RSI ATR = 14-period RMA of |Smoothed RSI − Previous Smoothed RSI|
Average volatility is calculated as a simple moving average of RSI ATR over ATR Smoothing.
Volatility Deviation = RSI ATR − Average Volatility
Dynamic Thresholds
Both thresholds are shifted by the same amount based on volatility deviation.
Dynamic Threshold = Base Threshold + Volatility Deviation × 4
When the smoothed RSI is moving faster than usual, both thresholds move higher. When it is moving more slowly than usual, both thresholds move lower.
Thresholds are limited to the range between 0 and 100.
Signal Logic
A bullish condition is activated when smoothed RSI crosses above either threshold.
A bearish condition is activated when smoothed RSI crosses below either threshold.
Because thresholds move, a cross can also occur when a threshold moves through the smoothed RSI.
Active condition remains unchanged until the opposite condition occurs.
✧ VISUALIZATION ✧
Oscillator changes color based on the active condition:
Green represents a bullish condition.
Red represents a bearish condition.
Neutral mode displays the same conditions using light and dark shades.
Threshold 1 is plotted in the bullish color and Threshold 2 in the bearish color.
A gradient glow fills the area between the smoothed RSI and the 50 level. It is strongest at the RSI line and fades toward 50.
Same signal colors can optionally be applied directly to the chart candles.
✧ USAGE ✧
Dynamic RSI Trend can be used to identify:
Bullish and bearish momentum conditions
Shifts in directional strength
Changes in momentum volatility
Potential trend changes
Trend confirmation
Additional confirmation for other technical analysis
Volatility-based thresholds are designed to adjust signal levels to current momentum conditions instead of relying on fixed RSI levels.
As with any technical indicator, it is best used alongside other forms of analysis rather than as a standalone entry or exit signal.
Dynamic RSI Trend is a momentum-based, trend-following oscillator that compares a smoothed RSI with two thresholds that move based on the volatility of the RSI itself.
Instead of using fixed levels, both thresholds shift up or down depending on whether the smoothed RSI is currently moving faster or slower than usual.
Smoothed RSI crossing the dynamic thresholds is used to identify bullish and bearish conditions, which are displayed using colored candles, a colored oscillator and a gradient glow.
✧ SETTINGS ✧
Color Mode
Switches between colored and neutral visualization.
Color Candles
Shows or hides candle coloring based on the current signal.
RSI Smoothing
Controls how many bars are used for the EMA applied to the RSI.
ATR Smoothing
Controls how many bars are used to calculate the average volatility of the smoothed RSI.
Threshold 1
Controls the base level of the first dynamic threshold.
Threshold 2
Controls the base level of the second dynamic threshold.
✧ HOW IT WORKS ✧
Smoothed RSI
A 14-period RSI of closing price is smoothed with an EMA over RSI Smoothing.
RSI Volatility
Indicator measures how much the smoothed RSI moves from bar to bar, similar to how ATR measures price movement.
RSI ATR = 14-period RMA of |Smoothed RSI − Previous Smoothed RSI|
Average volatility is calculated as a simple moving average of RSI ATR over ATR Smoothing.
Volatility Deviation = RSI ATR − Average Volatility
Dynamic Thresholds
Both thresholds are shifted by the same amount based on volatility deviation.
Dynamic Threshold = Base Threshold + Volatility Deviation × 4
When the smoothed RSI is moving faster than usual, both thresholds move higher. When it is moving more slowly than usual, both thresholds move lower.
Thresholds are limited to the range between 0 and 100.
Signal Logic
A bullish condition is activated when smoothed RSI crosses above either threshold.
A bearish condition is activated when smoothed RSI crosses below either threshold.
Because thresholds move, a cross can also occur when a threshold moves through the smoothed RSI.
Active condition remains unchanged until the opposite condition occurs.
✧ VISUALIZATION ✧
Oscillator changes color based on the active condition:
Green represents a bullish condition.
Red represents a bearish condition.
Neutral mode displays the same conditions using light and dark shades.
Threshold 1 is plotted in the bullish color and Threshold 2 in the bearish color.
A gradient glow fills the area between the smoothed RSI and the 50 level. It is strongest at the RSI line and fades toward 50.
Same signal colors can optionally be applied directly to the chart candles.
✧ USAGE ✧
Dynamic RSI Trend can be used to identify:
Bullish and bearish momentum conditions
Shifts in directional strength
Changes in momentum volatility
Potential trend changes
Trend confirmation
Additional confirmation for other technical analysis
Volatility-based thresholds are designed to adjust signal levels to current momentum conditions instead of relying on fixed RSI levels.
As with any technical indicator, it is best used alongside other forms of analysis rather than as a standalone entry or exit signal.

면책사항
해당 정보와 게시물은 금융, 투자, 트레이딩 또는 기타 유형의 조언이나 권장 사항으로 간주되지 않으며, 트레이딩뷰에서 제공하거나 보증하는 것이 아닙니다. 자세한 내용은 이용 약관을 참조하세요.
면책사항
해당 정보와 게시물은 금융, 투자, 트레이딩 또는 기타 유형의 조언이나 권장 사항으로 간주되지 않으며, 트레이딩뷰에서 제공하거나 보증하는 것이 아닙니다. 자세한 내용은 이용 약관을 참조하세요.