OPEN-SOURCE SCRIPT
업데이트됨 ICT ADR & London Killzone
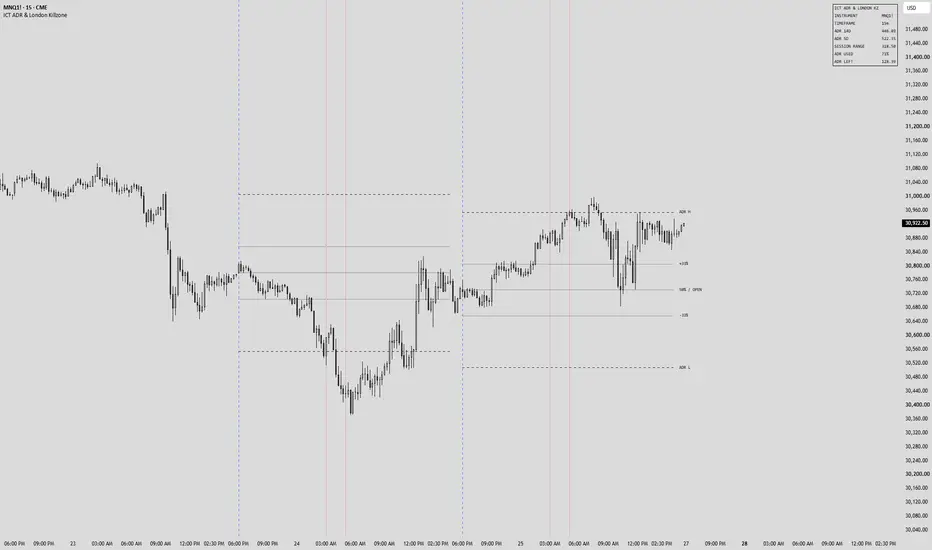
A session-anchored ADR projection tool built around the London Kill Zone.
This indicator plots vertical lines marking the 3–4 AM EST London Kill Zone window, while simultaneously drawing a dynamic Fibonacci-style projection anchored to the Asia session open (6 PM EST) each day. The projection extends forward to the 4 PM EST close and tracks with live price action, always rendering 10 bars ahead of the current candle to give you a clean read on where price is heading relative to the day's expected range.
The key levels plotted are the ADR High and ADR Low projections — framing the statistical ceiling and floor for the session — with the Asia open price marked as the anchor. Between those extremes, a 50% equilibrium line splits the range, and dotted 25% and 75% quarter-lines fill in the middle to help identify discount and premium zones within the projected range at a glance.
Everything is kept intentionally minimal. Labels are text-only with no background fill — just the level name, no price. All levels share a single uniform color (black) so the indicator stays clean on any chart without competing with your PD array markups or candle structure. The goal is a quiet, always-present framework that contextualizes where price is sitting within the day's expected range, without adding visual noise.
Enjoy. :)
This indicator plots vertical lines marking the 3–4 AM EST London Kill Zone window, while simultaneously drawing a dynamic Fibonacci-style projection anchored to the Asia session open (6 PM EST) each day. The projection extends forward to the 4 PM EST close and tracks with live price action, always rendering 10 bars ahead of the current candle to give you a clean read on where price is heading relative to the day's expected range.
The key levels plotted are the ADR High and ADR Low projections — framing the statistical ceiling and floor for the session — with the Asia open price marked as the anchor. Between those extremes, a 50% equilibrium line splits the range, and dotted 25% and 75% quarter-lines fill in the middle to help identify discount and premium zones within the projected range at a glance.
Everything is kept intentionally minimal. Labels are text-only with no background fill — just the level name, no price. All levels share a single uniform color (black) so the indicator stays clean on any chart without competing with your PD array markups or candle structure. The goal is a quiet, always-present framework that contextualizes where price is sitting within the day's expected range, without adding visual noise.
Enjoy. :)
릴리즈 노트
Changed 1/4 Levels to be 33% and -33 which represent ADR more accurately.릴리즈 노트
Visual Update릴리즈 노트
Labels stay inside their sessionA finished session's levels now stop on its last candle, so its names no longer run into the next session. The latest session keeps its names and older sessions keep their levels only. Past session labels, under Label Aesthetics, puts the names back at the end of every session.
Levels read apart at a glance
The ADR high and low draw solid, the equilibrium and open dashed, and the thirds dotted. The Asia open is dashed and the London Killzone dotted. Every style is still a setting.
The ADR in a table
The table shows the ADR the levels are drawn from, a second shorter ADR (5 days by default), the session range, how much of the ADR is used and how much is left. Hover a value for the arithmetic. It can be moved or switched off under Table.
A second way to project the ADR
ADR projection, under ADR Logic, can measure the ADR up from the session low and down from the session high instead of splitting it across the Asia open. The levels then follow the session as it extends. Split across the Asia open stays the default.
Pine Script v6
The script now runs on Pine Script v6.
오픈 소스 스크립트
트레이딩뷰의 진정한 정신에 따라, 이 스크립트의 작성자는 이를 오픈소스로 공개하여 트레이더들이 기능을 검토하고 검증할 수 있도록 했습니다. 작성자에게 찬사를 보냅니다! 이 코드는 무료로 사용할 수 있지만, 코드를 재게시하는 경우 하우스 룰이 적용된다는 점을 기억하세요.

면책사항
해당 정보와 게시물은 금융, 투자, 트레이딩 또는 기타 유형의 조언이나 권장 사항으로 간주되지 않으며, 트레이딩뷰에서 제공하거나 보증하는 것이 아닙니다. 자세한 내용은 이용 약관을 참조하세요.
오픈 소스 스크립트
트레이딩뷰의 진정한 정신에 따라, 이 스크립트의 작성자는 이를 오픈소스로 공개하여 트레이더들이 기능을 검토하고 검증할 수 있도록 했습니다. 작성자에게 찬사를 보냅니다! 이 코드는 무료로 사용할 수 있지만, 코드를 재게시하는 경우 하우스 룰이 적용된다는 점을 기억하세요.
면책사항
해당 정보와 게시물은 금융, 투자, 트레이딩 또는 기타 유형의 조언이나 권장 사항으로 간주되지 않으며, 트레이딩뷰에서 제공하거나 보증하는 것이 아닙니다. 자세한 내용은 이용 약관을 참조하세요.