OPEN-SOURCE SCRIPT
[DAOL] Volume Effort Map
⏺️ What is it?
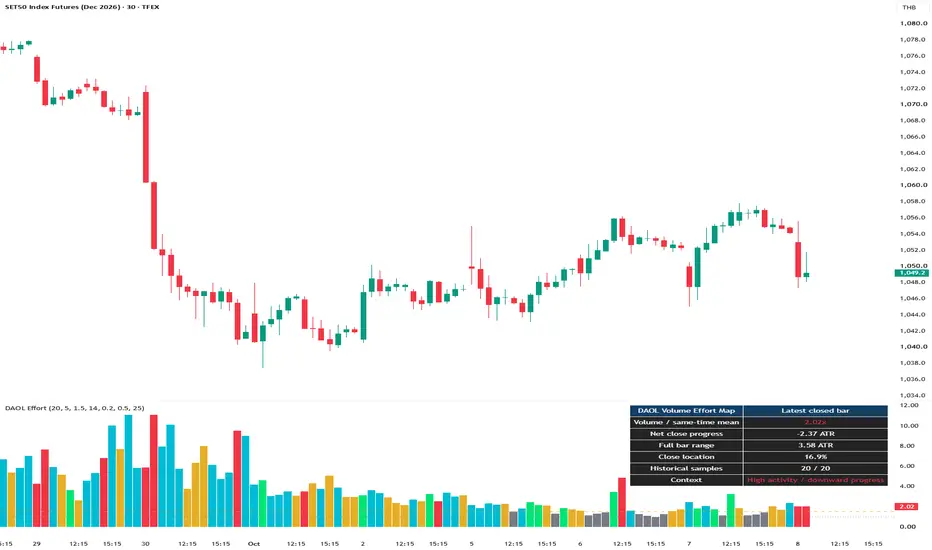
[DAOL] Volume Effort Map compares trading activity with the price movement achieved during each completed bar.
It combines three measurements:
🔹 Same-Time Relative Volume — current bar volume compared with the average volume of bars opening at the same clock time on prior observed dates
🔹 Net Price Progress — close-to-close price change divided by the previous bar’s ATR
🔹 Close Location — where the close sits within the current bar’s high–low range
The purpose is to distinguish high activity accompanied by directional progress from high activity accompanied by little net closing-price movement.
For example, volume may reach 2.1 times its historical same-time average while the close changes by only 0.15 ATR. That indicates high activity with low net progress—not proof of accumulation or absorption.
⏺️ How is it calculated?
Relative Volume = Current Bar Volume ÷ Mean Historical Same-Time Bar Volume
Net Progress = (Current Close − Previous Close) ÷ Previous Bar ATR
Close Location = (Close − Low) ÷ (High − Low)
A close at the low has a location of 0%; a close at the high has a location of 100%. A zero-range bar is assigned 50%.
The volume baseline excludes the current date. Missing historical observations are skipped, while genuine zero-volume observations are included. Classification requires enough matching historical bars and a positive volume baseline.
Using the previous bar’s ATR prevents the evaluated bar from enlarging its own volatility denominator.
⏺️ How to read the colors
🟢 Green — high relative volume, sufficient upward net progress, and a close near the bar’s high
🔴 Red — high relative volume, sufficient downward net progress, and a close near the bar’s low
🟡 Gold — high relative volume, but small absolute close-to-close progress
🔵 Blue — high relative volume, without meeting the directional or low-progress criteria
Gray — normal or low relative volume; also used while valid measurements are unavailable
Low net progress can coexist with a large intrabar range. Inspect the separate Full Bar Range measurement before interpreting a gold bar.
⏺️ Default settings
🔹 Historical comparison — 20 prior observed exchange-calendar dates
🔹 Minimum matching observations — 5
🔹 High relative volume — at least 1.5x
🔹 ATR length — 14
🔹 Low net progress — no more than 0.20 prior ATR in absolute terms
🔹 Directional progress — at least 0.50 prior ATR
🔹 Closing edge zone — upper or lower 25% of the bar
These are starting parameters, not optimized settings or validated performance claims.
⏺️ How to use
Use a standard time-based chart from 1 to 60 minutes. A 5- or 15-minute chart is a practical starting point for evaluation.
The histogram displays same-time relative volume. Its color describes the latest completed bar’s activity and price result.
⏺️ The dashboard displays:
🔹 Relative volume
🔹 Signed net price progress
🔹 Full bar range in prior ATR units
🔹 Close location
🔹 Matching historical sample count
🔹 Current classification or data-status message
Optional price-bar coloring is available.
For TFEX evaluation, S50 and GO contract-month charts are proposed starting points, provided the feed has sufficiently continuous volume data. This is an application proposal, not validated instrument-specific performance.
⏺️ Alerts
Available conditions:
🔹 High activity / upward progress
🔹 High activity / downward progress
🔹 High activity / low net progress
🔹 High activity / mixed result
🔹 Any activity-state change
Each classification describes one completed bar. This version does not require two-bar persistence.
The first valid classification initializes silently. Subsequent alerts occur when the classification changes, rather than on every bar that meets the same condition.
Create an alert in TradingView and select “Once Per Bar Close.” Recreate alerts after changing the code or inputs.
Development and attribution
This implementation was written for DAOL without copying Community script code.
⏺️ The foundation combines:
🔹 Same-time relative-volume comparison, as described in TradingView’s Relative Volume at Time documentation
🔹 Average True Range, developed by J. Welles Wilder
🔹 Close location within a bar, a standard price-position calculation
The extension is the classification workflow connecting time-adjusted activity, volatility-adjusted net progress, and closing position, with separate measurements explaining each result.
No claim is made that relative volume, ATR, close-location analysis, or the general idea of comparing effort with result is new.
This implementation compares individual bar volume at exact clock-time matches. It does not reproduce TradingView’s complete Relative Volume at Time implementation or calculate cumulative session volume.
⏺️ References:
TradingView — Relative Volume at Time
TradingView — Average True Range
Limitations and disclaimer
🔹 Volume is the reported feed volume. It is not bid/ask delta or direct evidence of buyer/seller intent.
🔹 High activity with low net progress does not establish absorption, institutional accumulation, or a future reversal.
🔹 Clock-time matching uses the exchange timezone and calendar date, not the exchange’s official trading-date definition. Overnight sessions crossing midnight are split across dates.
🔹 Session settings, irregular bar openings, shortened sessions, daylight-saving changes, contract rollover, and missing data can affect comparisons.
🔹 Price gaps are included in close-to-close progress.
🔹 At least the selected minimum number of historical time matches must be available. Until then, the indicator displays a waiting state.
🔹 Numerical checks have been completed outside Pine. TradingView compilation, runtime performance, and market-feed validation remain pending.
🔹 For educational and informational purposes only. It is not a standalone trading system and does not guarantee returns.
คำอธิบายภาษาไทย
⏺️ Indicator นี้คืออะไร?
[DAOL] Volume Effort Map เปรียบเทียบว่า กิจกรรมซื้อขายที่เพิ่มขึ้น ทำให้ราคาปิดเดินหน้าได้มากแค่ไหน
ผสมหลักการ 3 ส่วน:
🔹 Same-Time Relative Volume — Volume ของแท่งปัจจุบันเทียบกับค่าเฉลี่ยแท่งที่เปิดเวลาเดียวกันในวันก่อน ๆ
🔹 Net Price Progress — ระยะเปลี่ยนราคาปิดเทียบกับราคาปิดก่อนหน้า หารด้วย ATR ของแท่งก่อน
🔹 Close Location — ตำแหน่งราคาปิดภายในช่วง High–Low ของแท่ง
ตัวอย่าง: Volume สูงถึง 2.1 เท่าของค่าเฉลี่ยเวลาเดียวกัน แต่ราคาปิดเปลี่ยนเพียง 0.15 ATR หมายถึงกิจกรรมสูงแต่ความคืบหน้าสุทธิต่ำ ไม่ได้ยืนยันว่ามีการสะสมหรือ Absorption
⏺️ อ่านสีอย่างไร?
🟢 เขียว — Volume สูง ราคาเดินหน้าขึ้นถึงเกณฑ์ และปิดใกล้ High
🔴 แดง — Volume สูง ราคาเดินหน้าลงถึงเกณฑ์ และปิดใกล้ Low
🟡 ทอง — Volume สูง แต่ราคาปิดเปลี่ยนจากแท่งก่อนน้อย
🔵 ฟ้า — Volume สูง แต่ยังไม่เข้าเกณฑ์ทิศทางหรือความคืบหน้าต่ำ
สีเทา — กิจกรรมปกติหรือต่ำ หรือข้อมูลยังไม่พร้อม
สีทองไม่ได้แปลว่าราคาไม่แกว่งระหว่างแท่ง เพราะแท่งอาจมี High–Low กว้าง แต่กลับมาปิดใกล้ราคาปิดเดิม จึงควรอ่าน Full Bar Range ประกอบ
⏺️ วิธีคำนวณ
Relative Volume = Volume ปัจจุบัน ÷ ค่าเฉลี่ย Volume เวลาเดียวกันย้อนหลัง
Net Progress = (ราคาปิดปัจจุบัน − ราคาปิดก่อนหน้า) ÷ ATR ของแท่งก่อน
Close Location = (ราคาปิด − Low) ÷ (High − Low)
Close Location 0% หมายถึงปิดที่ Low และ 100% หมายถึงปิดที่ High หากแท่งไม่มีช่วงราคา จะกำหนดเป็น 50%
ค่าเฉลี่ย Volume ไม่รวมวันปัจจุบัน ข้อมูลที่หายจะไม่นำมาคำนวณ แต่แท่งที่มี Volume เป็นศูนย์จริงจะนำมารวมด้วย
⏺️ ค่าเริ่มต้น
🔹 เปรียบเทียบย้อนหลัง 20 วันที่มีแท่งปรากฏในกราฟ
🔹 ต้องมีตัวอย่างเวลาเดียวกันอย่างน้อย 5 ค่า
🔹 Volume สูงเมื่อถึง 1.5 เท่า
🔹 ATR 14 แท่ง
🔹 ความคืบหน้าต่ำเมื่อเปลี่ยนไม่เกิน 0.20 ATR
🔹 ความคืบหน้าเชิงทิศทางอย่างน้อย 0.50 ATR
🔹 โซนปิดใกล้ขอบเท่ากับ 25% ของช่วงแท่ง
เป็นค่าตั้งต้นสำหรับทดลอง ไม่ใช่ค่าที่ผ่านการปรับให้เหมาะที่สุดหรือรับรองผลการซื้อขาย
⏺️ วิธีใช้งาน
ใช้กราฟแท่งเทียนตามเวลา 1–60 นาที โดยเริ่มทดลองที่ 5 หรือ 15 นาทีได้ และโหลดประวัติให้มีตัวอย่างเวลาเดียวกันเพียงพอ
Histogram แสดง Relative Volume ส่วนสีอธิบายผลด้านราคาของแท่งปิดล่าสุด
Dashboard แสดง Volume เทียบค่าเฉลี่ย ระยะเปลี่ยนราคาปิด ช่วง High–Low ในหน่วย ATR ตำแหน่งปิด จำนวนตัวอย่าง และสถานะ สามารถเปิดให้เปลี่ยนสีแท่งราคาตามสถานะได้ด้วย
สำหรับ TFEX สามารถเริ่มประเมินกับ S50 หรือ GO แบบสัญญารายเดือนที่มีข้อมูล Volume ต่อเนื่อง โดยยังต้องทดสอบผลกับฟีดจริง
⏺️ การแจ้งเตือน
เลือกแจ้งเตือนสถานะขึ้น ลง ความคืบหน้าต่ำ ผลไม่ชัด หรือการเปลี่ยนสถานะทุกประเภทได้
เวอร์ชันนี้ประเมินทีละหนึ่งแท่งปิด ไม่ได้รอยืนยันต่อเนื่องสองแท่ง สถานะแรกใช้เริ่มต้นระบบโดยไม่แจ้งเตือน หลังจากนั้นจะแจ้งเมื่อสถานะเปลี่ยน
ตั้ง Alert เป็น “Once Per Bar Close” และสร้างใหม่หลังเปลี่ยน Input หรือโค้ด
ที่มาและส่วนที่ต่อยอด
โค้ดเขียนขึ้นสำหรับ DAOL โดยไม่คัดลอกสคริปต์ Community ใช้แนวคิด Relative Volume at Time ร่วมกับ ATR ของ J. Welles Wilder และตำแหน่งราคาปิดภายในแท่ง
ส่วนต่อยอดคือการเชื่อมกิจกรรมที่เทียบตามเวลาเข้ากับความคืบหน้าที่ปรับด้วยความผันผวน แล้วอธิบายผลด้วยสถานะและตัวเลขแยกกัน ไม่อ้างว่าแนวคิดพื้นฐานทั้งหมดเป็นสิ่งใหม่
แหล่งอ้างอิงอยู่ในส่วนภาษาอังกฤษด้านบน
⏺️ ข้อจำกัดและคำชี้แจง
🔹 Volume ไม่ใช่ข้อมูลฝั่งซื้อ/ขายจริง และไม่ยืนยันพฤติกรรมรายใหญ่
🔹 Volume สูงแต่ราคาปิดคืบหน้าน้อยไม่ได้รับประกันการกลับตัว
🔹 แบ่งวันตามวันที่ปฏิทินในเขตเวลาตลาด ไม่ใช่ Trade Date ของ TFEX ช่วงข้ามเที่ยงคืนจึงถูกแบ่งเป็นคนละวัน
🔹 Session เวลาเปิดแท่ง การเปลี่ยนสัญญา และข้อมูลที่ขาดหายมีผลต่อค่าเปรียบเทียบ
🔹 Gap ถูกนับรวมในระยะเปลี่ยนราคาปิด
🔹 ตรวจสูตรเชิงตัวเลขแล้ว แต่ยังต้อง Compile และตรวจการทำงานกับข้อมูลตลาดจริงใน TradingView
🔹 ใช้เพื่อการศึกษาและประกอบการวิเคราะห์ ไม่ใช่ระบบซื้อขายโดยลำพังหรือการรับประกันผลตอบแทน
[DAOL] Volume Effort Map compares trading activity with the price movement achieved during each completed bar.
It combines three measurements:
🔹 Same-Time Relative Volume — current bar volume compared with the average volume of bars opening at the same clock time on prior observed dates
🔹 Net Price Progress — close-to-close price change divided by the previous bar’s ATR
🔹 Close Location — where the close sits within the current bar’s high–low range
The purpose is to distinguish high activity accompanied by directional progress from high activity accompanied by little net closing-price movement.
For example, volume may reach 2.1 times its historical same-time average while the close changes by only 0.15 ATR. That indicates high activity with low net progress—not proof of accumulation or absorption.
⏺️ How is it calculated?
Relative Volume = Current Bar Volume ÷ Mean Historical Same-Time Bar Volume
Net Progress = (Current Close − Previous Close) ÷ Previous Bar ATR
Close Location = (Close − Low) ÷ (High − Low)
A close at the low has a location of 0%; a close at the high has a location of 100%. A zero-range bar is assigned 50%.
The volume baseline excludes the current date. Missing historical observations are skipped, while genuine zero-volume observations are included. Classification requires enough matching historical bars and a positive volume baseline.
Using the previous bar’s ATR prevents the evaluated bar from enlarging its own volatility denominator.
⏺️ How to read the colors
🟢 Green — high relative volume, sufficient upward net progress, and a close near the bar’s high
🔴 Red — high relative volume, sufficient downward net progress, and a close near the bar’s low
🟡 Gold — high relative volume, but small absolute close-to-close progress
🔵 Blue — high relative volume, without meeting the directional or low-progress criteria
Gray — normal or low relative volume; also used while valid measurements are unavailable
Low net progress can coexist with a large intrabar range. Inspect the separate Full Bar Range measurement before interpreting a gold bar.
⏺️ Default settings
🔹 Historical comparison — 20 prior observed exchange-calendar dates
🔹 Minimum matching observations — 5
🔹 High relative volume — at least 1.5x
🔹 ATR length — 14
🔹 Low net progress — no more than 0.20 prior ATR in absolute terms
🔹 Directional progress — at least 0.50 prior ATR
🔹 Closing edge zone — upper or lower 25% of the bar
These are starting parameters, not optimized settings or validated performance claims.
⏺️ How to use
Use a standard time-based chart from 1 to 60 minutes. A 5- or 15-minute chart is a practical starting point for evaluation.
The histogram displays same-time relative volume. Its color describes the latest completed bar’s activity and price result.
⏺️ The dashboard displays:
🔹 Relative volume
🔹 Signed net price progress
🔹 Full bar range in prior ATR units
🔹 Close location
🔹 Matching historical sample count
🔹 Current classification or data-status message
Optional price-bar coloring is available.
For TFEX evaluation, S50 and GO contract-month charts are proposed starting points, provided the feed has sufficiently continuous volume data. This is an application proposal, not validated instrument-specific performance.
⏺️ Alerts
Available conditions:
🔹 High activity / upward progress
🔹 High activity / downward progress
🔹 High activity / low net progress
🔹 High activity / mixed result
🔹 Any activity-state change
Each classification describes one completed bar. This version does not require two-bar persistence.
The first valid classification initializes silently. Subsequent alerts occur when the classification changes, rather than on every bar that meets the same condition.
Create an alert in TradingView and select “Once Per Bar Close.” Recreate alerts after changing the code or inputs.
Development and attribution
This implementation was written for DAOL without copying Community script code.
⏺️ The foundation combines:
🔹 Same-time relative-volume comparison, as described in TradingView’s Relative Volume at Time documentation
🔹 Average True Range, developed by J. Welles Wilder
🔹 Close location within a bar, a standard price-position calculation
The extension is the classification workflow connecting time-adjusted activity, volatility-adjusted net progress, and closing position, with separate measurements explaining each result.
No claim is made that relative volume, ATR, close-location analysis, or the general idea of comparing effort with result is new.
This implementation compares individual bar volume at exact clock-time matches. It does not reproduce TradingView’s complete Relative Volume at Time implementation or calculate cumulative session volume.
⏺️ References:
TradingView — Relative Volume at Time
TradingView — Average True Range
Limitations and disclaimer
🔹 Volume is the reported feed volume. It is not bid/ask delta or direct evidence of buyer/seller intent.
🔹 High activity with low net progress does not establish absorption, institutional accumulation, or a future reversal.
🔹 Clock-time matching uses the exchange timezone and calendar date, not the exchange’s official trading-date definition. Overnight sessions crossing midnight are split across dates.
🔹 Session settings, irregular bar openings, shortened sessions, daylight-saving changes, contract rollover, and missing data can affect comparisons.
🔹 Price gaps are included in close-to-close progress.
🔹 At least the selected minimum number of historical time matches must be available. Until then, the indicator displays a waiting state.
🔹 Numerical checks have been completed outside Pine. TradingView compilation, runtime performance, and market-feed validation remain pending.
🔹 For educational and informational purposes only. It is not a standalone trading system and does not guarantee returns.
คำอธิบายภาษาไทย
⏺️ Indicator นี้คืออะไร?
[DAOL] Volume Effort Map เปรียบเทียบว่า กิจกรรมซื้อขายที่เพิ่มขึ้น ทำให้ราคาปิดเดินหน้าได้มากแค่ไหน
ผสมหลักการ 3 ส่วน:
🔹 Same-Time Relative Volume — Volume ของแท่งปัจจุบันเทียบกับค่าเฉลี่ยแท่งที่เปิดเวลาเดียวกันในวันก่อน ๆ
🔹 Net Price Progress — ระยะเปลี่ยนราคาปิดเทียบกับราคาปิดก่อนหน้า หารด้วย ATR ของแท่งก่อน
🔹 Close Location — ตำแหน่งราคาปิดภายในช่วง High–Low ของแท่ง
ตัวอย่าง: Volume สูงถึง 2.1 เท่าของค่าเฉลี่ยเวลาเดียวกัน แต่ราคาปิดเปลี่ยนเพียง 0.15 ATR หมายถึงกิจกรรมสูงแต่ความคืบหน้าสุทธิต่ำ ไม่ได้ยืนยันว่ามีการสะสมหรือ Absorption
⏺️ อ่านสีอย่างไร?
🟢 เขียว — Volume สูง ราคาเดินหน้าขึ้นถึงเกณฑ์ และปิดใกล้ High
🔴 แดง — Volume สูง ราคาเดินหน้าลงถึงเกณฑ์ และปิดใกล้ Low
🟡 ทอง — Volume สูง แต่ราคาปิดเปลี่ยนจากแท่งก่อนน้อย
🔵 ฟ้า — Volume สูง แต่ยังไม่เข้าเกณฑ์ทิศทางหรือความคืบหน้าต่ำ
สีเทา — กิจกรรมปกติหรือต่ำ หรือข้อมูลยังไม่พร้อม
สีทองไม่ได้แปลว่าราคาไม่แกว่งระหว่างแท่ง เพราะแท่งอาจมี High–Low กว้าง แต่กลับมาปิดใกล้ราคาปิดเดิม จึงควรอ่าน Full Bar Range ประกอบ
⏺️ วิธีคำนวณ
Relative Volume = Volume ปัจจุบัน ÷ ค่าเฉลี่ย Volume เวลาเดียวกันย้อนหลัง
Net Progress = (ราคาปิดปัจจุบัน − ราคาปิดก่อนหน้า) ÷ ATR ของแท่งก่อน
Close Location = (ราคาปิด − Low) ÷ (High − Low)
Close Location 0% หมายถึงปิดที่ Low และ 100% หมายถึงปิดที่ High หากแท่งไม่มีช่วงราคา จะกำหนดเป็น 50%
ค่าเฉลี่ย Volume ไม่รวมวันปัจจุบัน ข้อมูลที่หายจะไม่นำมาคำนวณ แต่แท่งที่มี Volume เป็นศูนย์จริงจะนำมารวมด้วย
⏺️ ค่าเริ่มต้น
🔹 เปรียบเทียบย้อนหลัง 20 วันที่มีแท่งปรากฏในกราฟ
🔹 ต้องมีตัวอย่างเวลาเดียวกันอย่างน้อย 5 ค่า
🔹 Volume สูงเมื่อถึง 1.5 เท่า
🔹 ATR 14 แท่ง
🔹 ความคืบหน้าต่ำเมื่อเปลี่ยนไม่เกิน 0.20 ATR
🔹 ความคืบหน้าเชิงทิศทางอย่างน้อย 0.50 ATR
🔹 โซนปิดใกล้ขอบเท่ากับ 25% ของช่วงแท่ง
เป็นค่าตั้งต้นสำหรับทดลอง ไม่ใช่ค่าที่ผ่านการปรับให้เหมาะที่สุดหรือรับรองผลการซื้อขาย
⏺️ วิธีใช้งาน
ใช้กราฟแท่งเทียนตามเวลา 1–60 นาที โดยเริ่มทดลองที่ 5 หรือ 15 นาทีได้ และโหลดประวัติให้มีตัวอย่างเวลาเดียวกันเพียงพอ
Histogram แสดง Relative Volume ส่วนสีอธิบายผลด้านราคาของแท่งปิดล่าสุด
Dashboard แสดง Volume เทียบค่าเฉลี่ย ระยะเปลี่ยนราคาปิด ช่วง High–Low ในหน่วย ATR ตำแหน่งปิด จำนวนตัวอย่าง และสถานะ สามารถเปิดให้เปลี่ยนสีแท่งราคาตามสถานะได้ด้วย
สำหรับ TFEX สามารถเริ่มประเมินกับ S50 หรือ GO แบบสัญญารายเดือนที่มีข้อมูล Volume ต่อเนื่อง โดยยังต้องทดสอบผลกับฟีดจริง
⏺️ การแจ้งเตือน
เลือกแจ้งเตือนสถานะขึ้น ลง ความคืบหน้าต่ำ ผลไม่ชัด หรือการเปลี่ยนสถานะทุกประเภทได้
เวอร์ชันนี้ประเมินทีละหนึ่งแท่งปิด ไม่ได้รอยืนยันต่อเนื่องสองแท่ง สถานะแรกใช้เริ่มต้นระบบโดยไม่แจ้งเตือน หลังจากนั้นจะแจ้งเมื่อสถานะเปลี่ยน
ตั้ง Alert เป็น “Once Per Bar Close” และสร้างใหม่หลังเปลี่ยน Input หรือโค้ด
ที่มาและส่วนที่ต่อยอด
โค้ดเขียนขึ้นสำหรับ DAOL โดยไม่คัดลอกสคริปต์ Community ใช้แนวคิด Relative Volume at Time ร่วมกับ ATR ของ J. Welles Wilder และตำแหน่งราคาปิดภายในแท่ง
ส่วนต่อยอดคือการเชื่อมกิจกรรมที่เทียบตามเวลาเข้ากับความคืบหน้าที่ปรับด้วยความผันผวน แล้วอธิบายผลด้วยสถานะและตัวเลขแยกกัน ไม่อ้างว่าแนวคิดพื้นฐานทั้งหมดเป็นสิ่งใหม่
แหล่งอ้างอิงอยู่ในส่วนภาษาอังกฤษด้านบน
⏺️ ข้อจำกัดและคำชี้แจง
🔹 Volume ไม่ใช่ข้อมูลฝั่งซื้อ/ขายจริง และไม่ยืนยันพฤติกรรมรายใหญ่
🔹 Volume สูงแต่ราคาปิดคืบหน้าน้อยไม่ได้รับประกันการกลับตัว
🔹 แบ่งวันตามวันที่ปฏิทินในเขตเวลาตลาด ไม่ใช่ Trade Date ของ TFEX ช่วงข้ามเที่ยงคืนจึงถูกแบ่งเป็นคนละวัน
🔹 Session เวลาเปิดแท่ง การเปลี่ยนสัญญา และข้อมูลที่ขาดหายมีผลต่อค่าเปรียบเทียบ
🔹 Gap ถูกนับรวมในระยะเปลี่ยนราคาปิด
🔹 ตรวจสูตรเชิงตัวเลขแล้ว แต่ยังต้อง Compile และตรวจการทำงานกับข้อมูลตลาดจริงใน TradingView
🔹 ใช้เพื่อการศึกษาและประกอบการวิเคราะห์ ไม่ใช่ระบบซื้อขายโดยลำพังหรือการรับประกันผลตอบแทน
오픈 소스 스크립트
트레이딩뷰의 진정한 정신에 따라, 이 스크립트의 작성자는 이를 오픈소스로 공개하여 트레이더들이 기능을 검토하고 검증할 수 있도록 했습니다. 작성자에게 찬사를 보냅니다! 이 코드는 무료로 사용할 수 있지만, 코드를 재게시하는 경우 하우스 룰이 적용된다는 점을 기억하세요.

면책사항
해당 정보와 게시물은 금융, 투자, 트레이딩 또는 기타 유형의 조언이나 권장 사항으로 간주되지 않으며, 트레이딩뷰에서 제공하거나 보증하는 것이 아닙니다. 자세한 내용은 이용 약관을 참조하세요.
오픈 소스 스크립트
트레이딩뷰의 진정한 정신에 따라, 이 스크립트의 작성자는 이를 오픈소스로 공개하여 트레이더들이 기능을 검토하고 검증할 수 있도록 했습니다. 작성자에게 찬사를 보냅니다! 이 코드는 무료로 사용할 수 있지만, 코드를 재게시하는 경우 하우스 룰이 적용된다는 점을 기억하세요.
면책사항
해당 정보와 게시물은 금융, 투자, 트레이딩 또는 기타 유형의 조언이나 권장 사항으로 간주되지 않으며, 트레이딩뷰에서 제공하거나 보증하는 것이 아닙니다. 자세한 내용은 이용 약관을 참조하세요.