OPEN-SOURCE SCRIPT
Balance Point
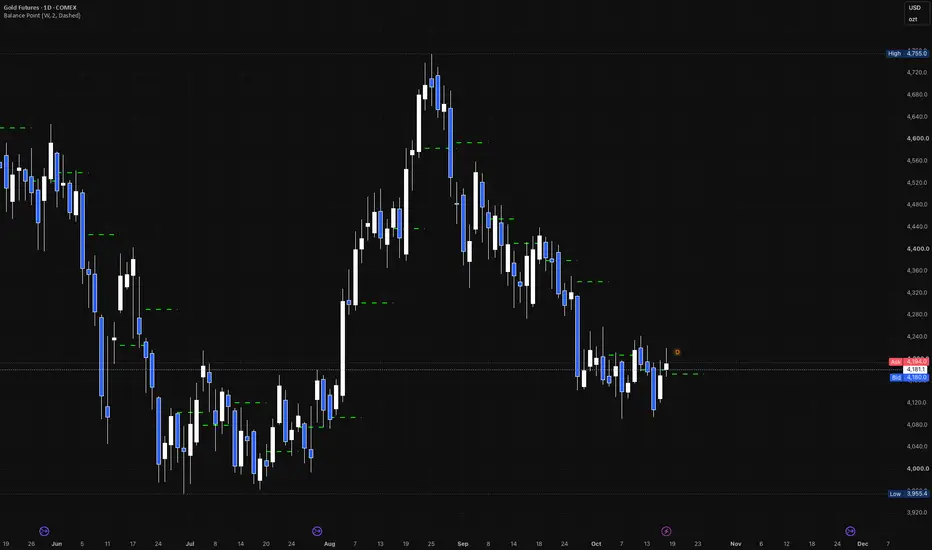
Balance Point draws the average of a higher-timeframe period's high, low and close, (H + L + C) / 3, across the following period, and projects the current period's value one period ahead.
HOW IT WORKS
Each period shows the previous period's Balance Point as a flat line. It is fixed once that period closes and never changes.
The current period's Balance Point (its high, low and close so far) is drawn one period wide to the right of the last bar, where it will apply next period. It updates live until the period closes.
HOW TO USE IT
Price above the line leans bullish for the period; below it, bearish.
A test of the line from above or below is a place to watch for support or resistance.
The projected line shows where next period's Balance Point stands right now.
INPUTS
Timeframe: the period the Balance Point is calculated on (W). The chart's own timeframe works too: each bar then shows the previous bar's value.
Line Color, Line Width, Line Style: the look of the lines (green, 2, Dashed).
DRAWING AND LIMITATIONS
Drawn only on charts at or below the chosen timeframe; on a higher chart nothing is drawn.
Past lines use closed periods only. The projected line is the current period so far and changes until the period closes.
About the last 500 periods keep their lines.
CREDITS
Balance Point as described by Robert Krausz.
오픈 소스 스크립트
트레이딩뷰의 진정한 정신에 따라, 이 스크립트의 작성자는 이를 오픈소스로 공개하여 트레이더들이 기능을 검토하고 검증할 수 있도록 했습니다. 작성자에게 찬사를 보냅니다! 이 코드는 무료로 사용할 수 있지만, 코드를 재게시하는 경우 하우스 룰이 적용된다는 점을 기억하세요.

면책사항
해당 정보와 게시물은 금융, 투자, 트레이딩 또는 기타 유형의 조언이나 권장 사항으로 간주되지 않으며, 트레이딩뷰에서 제공하거나 보증하는 것이 아닙니다. 자세한 내용은 이용 약관을 참조하세요.
오픈 소스 스크립트
트레이딩뷰의 진정한 정신에 따라, 이 스크립트의 작성자는 이를 오픈소스로 공개하여 트레이더들이 기능을 검토하고 검증할 수 있도록 했습니다. 작성자에게 찬사를 보냅니다! 이 코드는 무료로 사용할 수 있지만, 코드를 재게시하는 경우 하우스 룰이 적용된다는 점을 기억하세요.
면책사항
해당 정보와 게시물은 금융, 투자, 트레이딩 또는 기타 유형의 조언이나 권장 사항으로 간주되지 않으며, 트레이딩뷰에서 제공하거나 보증하는 것이 아닙니다. 자세한 내용은 이용 약관을 참조하세요.