EMA 50/100 + Candle Trend | Albert Setups
# EMA 50/100 + Candle Trend | Albert Setups 📊
**Trade with the Trend. Identify Momentum. Spot Buy & Sell Signals.**
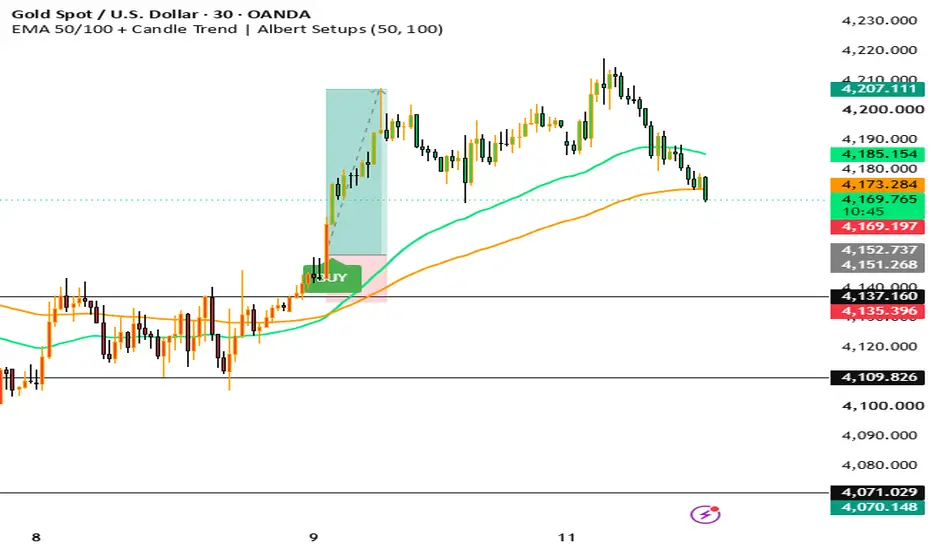
The EMA 50/100 + Candle Trend indicator is designed to help traders identify market direction and potential trading opportunities through two exponential moving averages (EMAs).
### 🔹 Key Features
* **EMA 50 (Green Line):** Tracks shorter-term price momentum.
* **EMA 100 (Orange Line):** Helps identify the broader trend direction.
* **BUY Signal 🟢:** Appears when EMA 50 crosses above EMA 100 on a confirmed candle close.
* **SELL Signal 🔴:** Appears when EMA 50 crosses below EMA 100 on a confirmed candle close.
* **Trend-Based Candlestick Colors:** Green candles indicate a bullish EMA trend bias, while red candles indicate a bearish EMA trend bias.
* **Clean Chart Design:** Simple visuals make trend direction and crossover signals easier to understand.
### 🔹 How to Use
**Bullish Setup:** When EMA 50 crosses above EMA 100, the indicator generates a BUY signal, suggesting potential bullish momentum.
**Bearish Setup:** When EMA 50 crosses below EMA 100, the indicator generates a SELL signal, suggesting potential bearish momentum.
**Trend Confirmation:** Traders can use price action, support and resistance, and higher-timeframe analysis to confirm signals before entering a trade.
### 🔹 Suitable Markets
* Forex
* Gold (XAUUSD)
* Cryptocurrency
* Indices
**Trade with the Trend. Identify Momentum. Spot Buy & Sell Signals.**
The EMA 50/100 + Candle Trend indicator is designed to help traders identify market direction and potential trading opportunities through two exponential moving averages (EMAs).
### 🔹 Key Features
* **EMA 50 (Green Line):** Tracks shorter-term price momentum.
* **EMA 100 (Orange Line):** Helps identify the broader trend direction.
* **BUY Signal 🟢:** Appears when EMA 50 crosses above EMA 100 on a confirmed candle close.
* **SELL Signal 🔴:** Appears when EMA 50 crosses below EMA 100 on a confirmed candle close.
* **Trend-Based Candlestick Colors:** Green candles indicate a bullish EMA trend bias, while red candles indicate a bearish EMA trend bias.
* **Clean Chart Design:** Simple visuals make trend direction and crossover signals easier to understand.
### 🔹 How to Use
**Bullish Setup:** When EMA 50 crosses above EMA 100, the indicator generates a BUY signal, suggesting potential bullish momentum.
**Bearish Setup:** When EMA 50 crosses below EMA 100, the indicator generates a SELL signal, suggesting potential bearish momentum.
**Trend Confirmation:** Traders can use price action, support and resistance, and higher-timeframe analysis to confirm signals before entering a trade.
### 🔹 Suitable Markets
* Forex
* Gold (XAUUSD)
* Cryptocurrency
* Indices

면책사항
해당 정보와 게시물은 금융, 투자, 트레이딩 또는 기타 유형의 조언이나 권장 사항으로 간주되지 않으며, 트레이딩뷰에서 제공하거나 보증하는 것이 아닙니다. 자세한 내용은 이용 약관을 참조하세요.
면책사항
해당 정보와 게시물은 금융, 투자, 트레이딩 또는 기타 유형의 조언이나 권장 사항으로 간주되지 않으며, 트레이딩뷰에서 제공하거나 보증하는 것이 아닙니다. 자세한 내용은 이용 약관을 참조하세요.