OPEN-SOURCE SCRIPT
RS Rating (1-99)
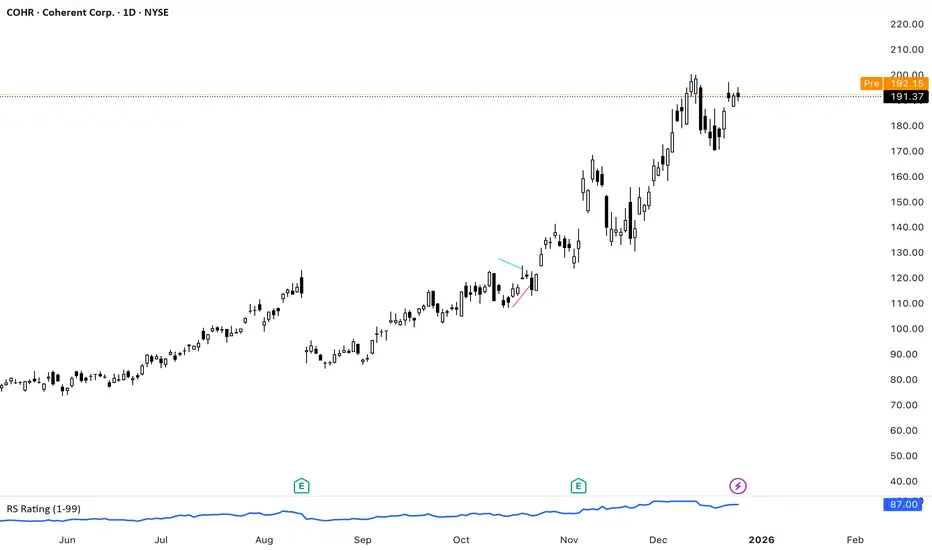
RS Rating
This indicator implements a Relative Strength (RS) rating for TradingView and is designed specifically to be used with the Pine Screener.
Concept
Relative Strength is calculated using weighted price performance over multiple time windows (approximately 3, 6, 9, and 12 months).
More recent performance is weighted more heavily, following well-established relative strength methodologies.
The resulting raw RS score is then compressed into a 1–99 scale, creating an intuitive and stable ranking metric.
Because TradingView scripts cannot rank a stock against the entire market universe, this indicator uses a behavioral proxy: the current RS score is mapped against its own historical distribution.
This produces RS values that behave similarly to widely used RS ratings, but it is not a true cross-sectional percentile rank.
IPO handling
RS Rating is not displayed until sufficient price history exists (default: ~9 months / 189 bars).
This avoids distorted RS values for newly listed stocks. IPOs are better evaluated using separate momentum, volume, or structure-based tools until they mature.
Interpretation (rule of thumb)
- RS ≥ 80 → strong relative performance
- RS ≥ 90 → leader
- RS ≥ 95 → very selective / top-tier
- RS Rating is best used as a ranking and confirmation tool, not as an entry signal.
Using RS Rating with TradingView Pine Screener
This indicator is designed to work directly with the TradingView Pine Screener (beta).
Setup
- Add the indicator to a chart
- Open Pine Screener
- Select this script as a filter source
- Use the plotted RS Rating (1–99) value for sorting or filtering
The screener reads the single plotted RS value and treats it as a sortable numeric column.
Typical screening workflows
Leader scan
Filter: RS Rating ≥ 90
Sort: Descending by RS Rating
Identifies stocks with sustained relative outperformance.
Broad strength scan
Filter: RS Rating ≥ 80
Useful for identifying emerging leaders or strong secondary names.
Top-of-universe view
No filter
Sort: Descending by RS Rating
Shows the strongest names within the selected universe.
Important notes on Pine Screener (beta)
The Pine Screener currently displays a limited number of results (approximately 100).
Symbols may be pre-sampled before filtering.
For larger universes, consider:
- splitting symbols to be scanned into multiple watchlists
Best practices
Use RS Rating to rank and prioritize candidates, not to time entries.
Combine RS with:
- price structure,
- volume behavior,
- overall market regime.
RS is most effective when used as part of a multi-factor screening process.
This indicator implements a Relative Strength (RS) rating for TradingView and is designed specifically to be used with the Pine Screener.
Concept
Relative Strength is calculated using weighted price performance over multiple time windows (approximately 3, 6, 9, and 12 months).
More recent performance is weighted more heavily, following well-established relative strength methodologies.
The resulting raw RS score is then compressed into a 1–99 scale, creating an intuitive and stable ranking metric.
Because TradingView scripts cannot rank a stock against the entire market universe, this indicator uses a behavioral proxy: the current RS score is mapped against its own historical distribution.
This produces RS values that behave similarly to widely used RS ratings, but it is not a true cross-sectional percentile rank.
IPO handling
RS Rating is not displayed until sufficient price history exists (default: ~9 months / 189 bars).
This avoids distorted RS values for newly listed stocks. IPOs are better evaluated using separate momentum, volume, or structure-based tools until they mature.
Interpretation (rule of thumb)
- RS ≥ 80 → strong relative performance
- RS ≥ 90 → leader
- RS ≥ 95 → very selective / top-tier
- RS Rating is best used as a ranking and confirmation tool, not as an entry signal.
Using RS Rating with TradingView Pine Screener
This indicator is designed to work directly with the TradingView Pine Screener (beta).
Setup
- Add the indicator to a chart
- Open Pine Screener
- Select this script as a filter source
- Use the plotted RS Rating (1–99) value for sorting or filtering
The screener reads the single plotted RS value and treats it as a sortable numeric column.
Typical screening workflows
Leader scan
Filter: RS Rating ≥ 90
Sort: Descending by RS Rating
Identifies stocks with sustained relative outperformance.
Broad strength scan
Filter: RS Rating ≥ 80
Useful for identifying emerging leaders or strong secondary names.
Top-of-universe view
No filter
Sort: Descending by RS Rating
Shows the strongest names within the selected universe.
Important notes on Pine Screener (beta)
The Pine Screener currently displays a limited number of results (approximately 100).
Symbols may be pre-sampled before filtering.
For larger universes, consider:
- splitting symbols to be scanned into multiple watchlists
Best practices
Use RS Rating to rank and prioritize candidates, not to time entries.
Combine RS with:
- price structure,
- volume behavior,
- overall market regime.
RS is most effective when used as part of a multi-factor screening process.
오픈 소스 스크립트
트레이딩뷰의 진정한 정신에 따라, 이 스크립트의 작성자는 이를 오픈소스로 공개하여 트레이더들이 기능을 검토하고 검증할 수 있도록 했습니다. 작성자에게 찬사를 보냅니다! 이 코드는 무료로 사용할 수 있지만, 코드를 재게시하는 경우 하우스 룰이 적용된다는 점을 기억하세요.

면책사항
해당 정보와 게시물은 금융, 투자, 트레이딩 또는 기타 유형의 조언이나 권장 사항으로 간주되지 않으며, 트레이딩뷰에서 제공하거나 보증하는 것이 아닙니다. 자세한 내용은 이용 약관을 참조하세요.
오픈 소스 스크립트
트레이딩뷰의 진정한 정신에 따라, 이 스크립트의 작성자는 이를 오픈소스로 공개하여 트레이더들이 기능을 검토하고 검증할 수 있도록 했습니다. 작성자에게 찬사를 보냅니다! 이 코드는 무료로 사용할 수 있지만, 코드를 재게시하는 경우 하우스 룰이 적용된다는 점을 기억하세요.
면책사항
해당 정보와 게시물은 금융, 투자, 트레이딩 또는 기타 유형의 조언이나 권장 사항으로 간주되지 않으며, 트레이딩뷰에서 제공하거나 보증하는 것이 아닙니다. 자세한 내용은 이용 약관을 참조하세요.