OPEN-SOURCE SCRIPT
업데이트됨 Syawal Vertical Lines
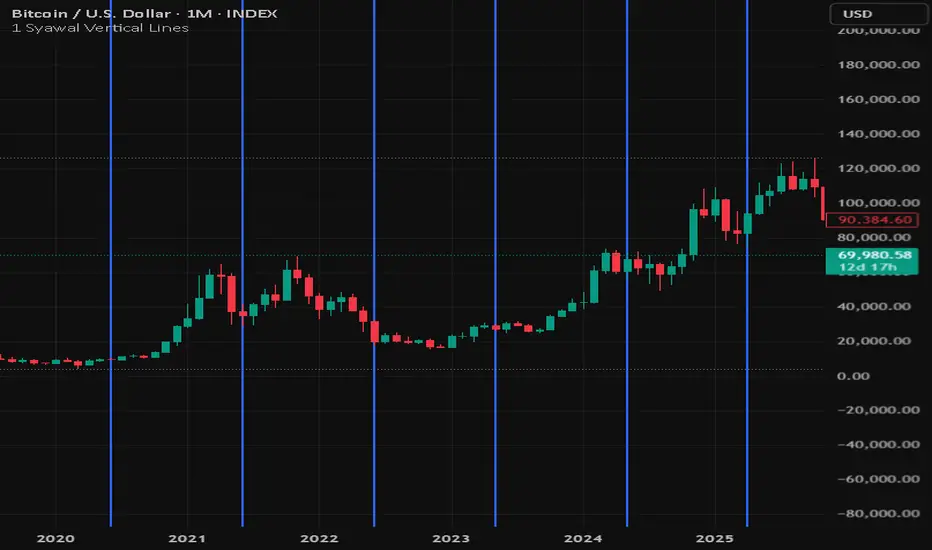
Indicator Description
1 Shawwal Vertical Lines – Eid Mubarak Edition marks the date of 1 Shawwal (Eid al-Fitr) on the chart with vertical blue lines. Each line represents the day when Muslims around the world celebrate Eid Mubarak, the festival marking the end of Ramadan.
The dates are based on the conversion of the Islamic Hijri calendar to the Gregorian calendar for the period 2006–2025.
This indicator is designed to help traders and analysts explore potential seasonality and event-driven patterns in the market around major cultural and economic moments. Eid al-Fitr is often associated with shifts in economic activity, including:
- increased consumer spending
- changes in liquidity and market participation
- regional variations in trading behavior
By marking these dates directly on the chart, users can easily:
- identify where Eid al-Fitr occurs within market cycles
- compare market reactions across different years
- study potential holiday-related market behavior
The indicator works on all timeframes because it uses timestamp-based detection, ensuring the vertical lines appear correctly on daily, weekly, and monthly charts.
Features
- Vertical markers for 1 Shawwal (2006–2025)
- Works on all timeframes
- Useful for seasonality and event-based analysis
- Lightweight and does not rely on technical calculations
Note
The exact date of Eid al-Fitr may vary slightly between countries due to different lunar observation methods. The dates used in this indicator follow commonly accepted Hijri-to-Gregorian calendar conversions.
Eid Mubarak to everyone celebrating.
1 Shawwal Vertical Lines – Eid Mubarak Edition marks the date of 1 Shawwal (Eid al-Fitr) on the chart with vertical blue lines. Each line represents the day when Muslims around the world celebrate Eid Mubarak, the festival marking the end of Ramadan.
The dates are based on the conversion of the Islamic Hijri calendar to the Gregorian calendar for the period 2006–2025.
This indicator is designed to help traders and analysts explore potential seasonality and event-driven patterns in the market around major cultural and economic moments. Eid al-Fitr is often associated with shifts in economic activity, including:
- increased consumer spending
- changes in liquidity and market participation
- regional variations in trading behavior
By marking these dates directly on the chart, users can easily:
- identify where Eid al-Fitr occurs within market cycles
- compare market reactions across different years
- study potential holiday-related market behavior
The indicator works on all timeframes because it uses timestamp-based detection, ensuring the vertical lines appear correctly on daily, weekly, and monthly charts.
Features
- Vertical markers for 1 Shawwal (2006–2025)
- Works on all timeframes
- Useful for seasonality and event-based analysis
- Lightweight and does not rely on technical calculations
Note
The exact date of Eid al-Fitr may vary slightly between countries due to different lunar observation methods. The dates used in this indicator follow commonly accepted Hijri-to-Gregorian calendar conversions.
Eid Mubarak to everyone celebrating.
릴리즈 노트
add/edit data for year 2026오픈 소스 스크립트
트레이딩뷰의 진정한 정신에 따라, 이 스크립트의 작성자는 이를 오픈소스로 공개하여 트레이더들이 기능을 검토하고 검증할 수 있도록 했습니다. 작성자에게 찬사를 보냅니다! 이 코드는 무료로 사용할 수 있지만, 코드를 재게시하는 경우 하우스 룰이 적용된다는 점을 기억하세요.

면책사항
해당 정보와 게시물은 금융, 투자, 트레이딩 또는 기타 유형의 조언이나 권장 사항으로 간주되지 않으며, 트레이딩뷰에서 제공하거나 보증하는 것이 아닙니다. 자세한 내용은 이용 약관을 참조하세요.
오픈 소스 스크립트
트레이딩뷰의 진정한 정신에 따라, 이 스크립트의 작성자는 이를 오픈소스로 공개하여 트레이더들이 기능을 검토하고 검증할 수 있도록 했습니다. 작성자에게 찬사를 보냅니다! 이 코드는 무료로 사용할 수 있지만, 코드를 재게시하는 경우 하우스 룰이 적용된다는 점을 기억하세요.
면책사항
해당 정보와 게시물은 금융, 투자, 트레이딩 또는 기타 유형의 조언이나 권장 사항으로 간주되지 않으며, 트레이딩뷰에서 제공하거나 보증하는 것이 아닙니다. 자세한 내용은 이용 약관을 참조하세요.