OPEN-SOURCE SCRIPT
Volume vs MA20 Multiple
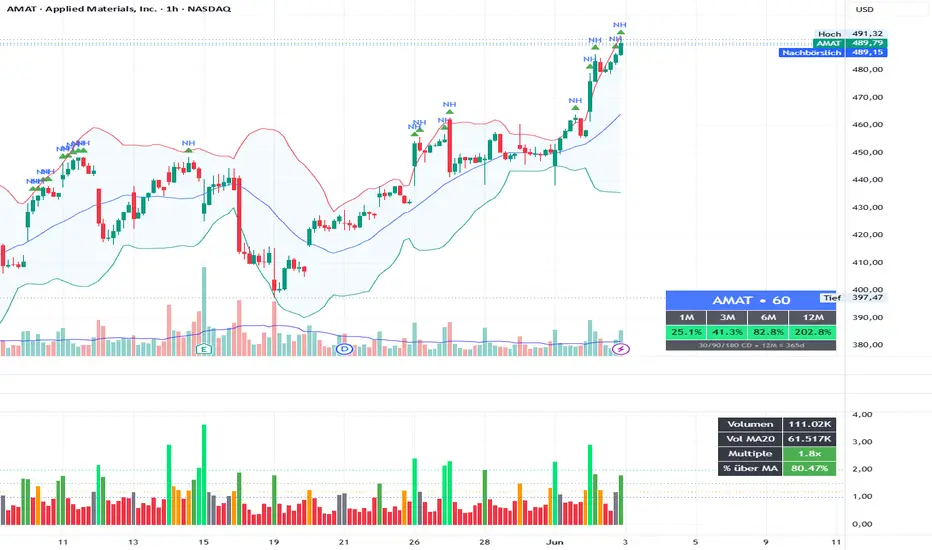
Volume vs MA20 Multiple
This indicator shows how the current candle’s volume compares to its moving average volume.
Instead of only displaying raw volume, it calculates a volume multiple relative to the selected volume moving average, for example:
The default setting uses a 20-period volume moving average, which means:
This makes it easier to judge whether a breakout, reversal, or pullback move is supported by meaningful volume.
How I use it
For breakout trades, I usually want to see price breaking above a key level while volume is clearly above average.
Typical interpretation:
The indicator can display both the multiple and the percentage above the moving average, making it useful for quickly validating whether a price move has real participation behind it.
This indicator is not a standalone buy or sell signal. It is intended to be used together with price action, support/resistance, trend structure, and risk management.
This indicator shows how the current candle’s volume compares to its moving average volume.
Instead of only displaying raw volume, it calculates a volume multiple relative to the selected volume moving average, for example:
- 1.0x = current volume equals the volume moving average
- 1.2x = current volume is 20% above average
- 1.5x = current volume is 50% above average
- 2.0x = current volume is twice the average volume
The default setting uses a 20-period volume moving average, which means:
- on the 1H chart, it compares the current hourly volume to the average of the last 20 hourly candles
- on the daily chart, it compares the current daily volume to the average of the last 20 daily candles
- on any timeframe, it automatically adapts to the selected chart timeframe
This makes it easier to judge whether a breakout, reversal, or pullback move is supported by meaningful volume.
How I use it
For breakout trades, I usually want to see price breaking above a key level while volume is clearly above average.
Typical interpretation:
- Below 1.0x: weak / below-average volume
- Around 1.0x: normal volume
- 1.2x – 1.5x: increased volume, potential confirmation
- 1.5x – 2.0x: strong volume confirmation
- Above 2.0x: very strong participation
The indicator can display both the multiple and the percentage above the moving average, making it useful for quickly validating whether a price move has real participation behind it.
- Best used for
- Breakout confirmation
- Pullback entries
- Reversal setups
- Intraday momentum analysis
- Comparing volume strength across different timeframes
This indicator is not a standalone buy or sell signal. It is intended to be used together with price action, support/resistance, trend structure, and risk management.
오픈 소스 스크립트
트레이딩뷰의 진정한 정신에 따라, 이 스크립트의 작성자는 이를 오픈소스로 공개하여 트레이더들이 기능을 검토하고 검증할 수 있도록 했습니다. 작성자에게 찬사를 보냅니다! 이 코드는 무료로 사용할 수 있지만, 코드를 재게시하는 경우 하우스 룰이 적용된다는 점을 기억하세요.

면책사항
해당 정보와 게시물은 금융, 투자, 트레이딩 또는 기타 유형의 조언이나 권장 사항으로 간주되지 않으며, 트레이딩뷰에서 제공하거나 보증하는 것이 아닙니다. 자세한 내용은 이용 약관을 참조하세요.
오픈 소스 스크립트
트레이딩뷰의 진정한 정신에 따라, 이 스크립트의 작성자는 이를 오픈소스로 공개하여 트레이더들이 기능을 검토하고 검증할 수 있도록 했습니다. 작성자에게 찬사를 보냅니다! 이 코드는 무료로 사용할 수 있지만, 코드를 재게시하는 경우 하우스 룰이 적용된다는 점을 기억하세요.
면책사항
해당 정보와 게시물은 금융, 투자, 트레이딩 또는 기타 유형의 조언이나 권장 사항으로 간주되지 않으며, 트레이딩뷰에서 제공하거나 보증하는 것이 아닙니다. 자세한 내용은 이용 약관을 참조하세요.