Quantum RSI - Multi-Timeframe Confluence
OVERVIEW
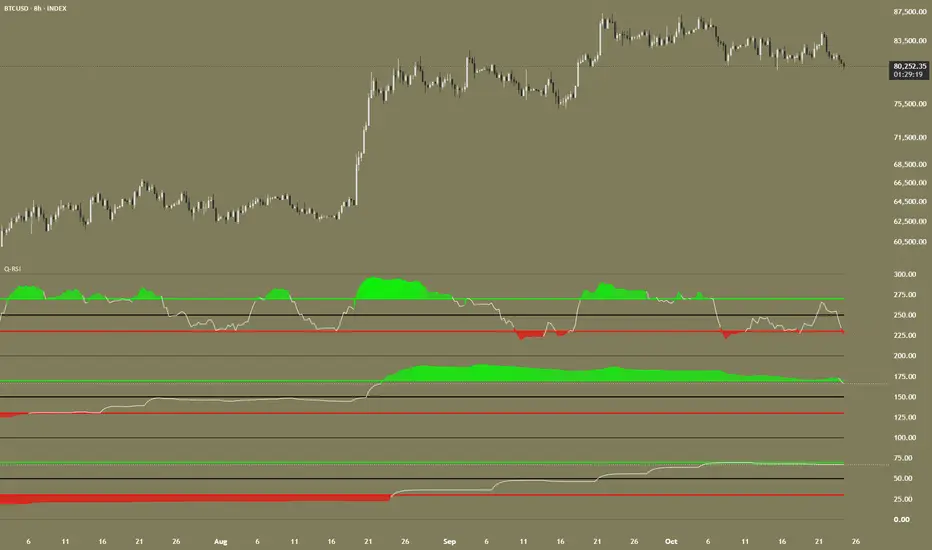
Quantum RSI - Multi-Timeframe Confluence displays three RSI-style oscillators in one pane. Each oscillator uses a separately selected timeframe: Zone 3 follows the chart timeframe by default, Zone 2 defaults to two days, and Zone 1 defaults to one week. The zones are stacked vertically so their readings can be compared without switching charts.
The indicator also calculates weighted bullish and bearish alignment scores from the three zones. Individual alerts are available for alignment threshold crosses, aligned recoveries and rejections, and 50-level crosses. A dashboard summarizes the timeframes, values, and alignment scores. Optional value labels show each oscillator's current reading beside its line, which is useful because the pane's combined scale runs from 0 to 300 rather than displaying three separate 0-to-100 scales.
The indicator describes momentum and timeframe agreement. It does not predict price, provide a probability of success, or recommend trades.
HOW THE QUANTUM RSI CALCULATION WORKS
The oscillator uses an original RSI-style calculation. For each bar, it examines the selected source's rolling highest and lowest values over the chosen length. When the rolling high extends to a new high, the calculation uses the current rolling range as a positive directional input. When the rolling low extends to a new low, it uses the negative of that range. If neither rolling extreme extends, it uses the source's bar-to-bar change.
The resulting directional values and their absolute values are smoothed with Wilder's running moving average. Their ratio is then rescaled to a 0-to-100 range. A zero denominator is handled by returning 50, and the final result is clamped to the oscillator's valid range. This preserves familiar RSI reference levels while using the script's own range-extension logic.
Volume weighting is optional. When enabled, the directional input is multiplied by the current bar's volume before smoothing, giving higher-volume bars more influence. If volume is missing or zero, the calculation uses an equal weight instead. Volume weighting is therefore unavailable as a meaningful distinction on symbols whose feeds do not provide usable volume.
THE THREE ZONES
Each zone represents a complete oscillator reading from 0 to 100. The zones are vertically offset for display:
Zone 1 occupies the bottom band and uses the Macro 2 timeframe, set to weekly by default.
Zone 2 occupies the middle band and uses the Macro 1 timeframe, set to two days by default.
Zone 3 occupies the top band and uses the Chart Timeframe input. When that input is blank, Zone 3 follows the chart's active timeframe.
Each band has its own overbought reference, oversold reference, and 50 midline. The default levels are 70, 30, and 50. A reading above the overbought level is an elevated oscillator reading; a reading below the oversold level is a depressed oscillator reading. The 50 midline separates readings above and below the oscillator's neutral reference. These levels are observations, not automatic reversal instructions: an oscillator can remain elevated or depressed during a persistent trend.
The default timeframe structure is intended to give a faster local reading, an intermediate reading, and a slower context reading. Users can change the timeframe inputs to suit their market and trading horizon. For a useful multi-timeframe comparison, the selected timeframes should generally be ordered from the shortest to the longest: Zone 3, then Zone 2, then Zone 1.
READING THE STACKED SCALE AND VALUE LABELS
The pane combines the three oscillator bands on one scale. The right axis therefore reflects their stacked positions, not the raw RSI value for a particular zone. For example, Zone 2's plotted value is offset by 100 and Zone 3's by 200. The value labels address this by showing each zone's unshifted 0-to-100 value beside its plot.
The labels are enabled by default and are placed eight chart bars to the right of the latest bar. Their text color follows the oscillator's position relative to the configured levels: the overbought-level color is used above the overbought level, the oversold-level color below the oversold level, and the zone's own RSI color in between. The label text size and horizontal offset can be changed in settings. These labels are readouts only; they do not affect calculations or alerts.
TIMEFRAME CONFIRMATION AND BAR-CLOSE BEHAVIOR
Confirmed Higher-Timeframe Values is enabled by default. When a requested macro timeframe is higher than the Zone 3 timeframe, the script uses the previous completed bar from that higher timeframe. The value therefore remains stable while the next higher-timeframe bar develops. For example, with Zone 1 set to weekly, the last completed weekly reading is used during the following weekly period.
Disabling this setting allows higher-timeframe readings to use a developing bar. Those values can change before the higher-timeframe bar closes. The dashboard identifies the selected higher-timeframe mode, but users should remember that a developing reading is not final.
Zone 3 follows its selected timeframe and can update while its current bar is forming. The Wait for Bar Close setting, enabled by default, gates alerts until the chart bar is confirmed. It controls alert timing; it does not freeze the displayed oscillator values during a live bar. For stable higher-timeframe context and close-confirmed alerts, keep Confirmed Higher-Timeframe Values and Wait for Bar Close enabled.
WEIGHTED ALIGNMENT SCORES
The script calculates bullish and bearish alignment percentages from the three oscillator readings. Each zone contributes a directional vote: a value above 50 contributes to the bullish score, and a value below 50 contributes to the bearish score. A value exactly at 50 contributes to neither. Each vote is multiplied by its configured zone weight, and the weighted total is divided by the sum of all three weights.
The default weights are 1.0 for Zone 3, 1.5 for Zone 2, and 2.0 for Zone 1. This gives the slower macro zones more influence than the local chart zone. Users can change the weights to emphasize the timeframe most relevant to their approach.
The scores measure weighted directional agreement; they are not win probabilities or forecasts. Because a zone exactly at 50 contributes to neither side, bullish and bearish percentages do not necessarily add up to 100%. The dashboard displays both scores when all three zone values are available.
ALERTS
The indicator provides the following alert conditions:
Bullish MTF alignment triggers when the bullish alignment score crosses above the configured threshold.
Bearish MTF alignment triggers when the bearish alignment score crosses above the configured threshold.
Aligned oversold recovery triggers when Zone 3 crosses up through the oversold level while the bullish alignment score is at or above the threshold.
Aligned overbought rejection triggers when Zone 3 crosses down through the overbought level while the bearish alignment score is at or above the threshold.
Zone 1, Zone 2, and Zone 3 each have a separate 50 midline cross alert. Each triggers when its zone crosses the 50 level in either direction. These alerts are independent of the weighted alignment threshold and are not subject to the alignment alert cooldown.
The four alignment, recovery, and rejection conditions share a cooldown measured in chart bars. A signal from one of those conditions can temporarily suppress another of those conditions until the cooldown has elapsed. Setting the cooldown to zero removes that delay. The three midline-cross alerts do not use this cooldown.
The Wait for Bar Close setting controls whether alerts must wait for a confirmed chart bar. The optional low-volume filter can also suppress alerts. When creating an alert in TradingView, select the individual condition that matches the event you want to monitor and configure the alert frequency appropriate to your use.
OPTIONAL LIQUIDITY FILTER
Suppress Alerts on Low Volume is disabled by default. When enabled, the script compares the current chart bar's volume with its simple moving average over the selected volume-average length. If current volume is below the configured minimum ratio of that average, alerts are suppressed on that bar.
The filter applies to alignment, recovery, rejection, and midline-cross alerts. It does not change the oscillator calculations, plots, labels, or dashboard. On symbols with missing or zero volume, or while a usable average is unavailable, the filter has no effect. Volume reported by a data provider may not represent the same kind of market-wide activity across all asset classes, so interpret this filter in the context of the symbol and feed.
DASHBOARD
The optional dashboard is displayed in the oscillator pane. It shows the indicator label, the higher-timeframe mode, each zone's timeframe and current value, and the bullish and bearish alignment scores. The displayed zone values use the same overbought, oversold, and neutral color logic as the value labels.
The dashboard has a reserved final row for a timeframe-order warning. That row is blank when Macro 1 is at least as high as the Zone 3 timeframe and Macro 2 is at least as high as Macro 1. If the configured order is not met, the row displays a warning to check the settings. With the default two-day and weekly macro timeframes, the row will normally be blank on a chart timeframe below two days.
SETTINGS GUIDE
Q-RSI Engine & Timeframes
Chart Timeframe - Zone 3 selects the timeframe for the local oscillator. Leaving it blank makes Zone 3 follow the chart's active timeframe.
Macro 1 - Zone 2 selects the intermediate timeframe and defaults to two days.
Macro 2 - Zone 1 selects the slow timeframe and defaults to one week.
RSI Length - Zone 1, Zone 2, and Zone 3 set the calculation length independently. Shorter lengths generally respond more quickly and can produce more fluctuations. Longer lengths generally respond more slowly and can smooth short-term movement.
Volume-weighted RSI enables volume weighting in the oscillator calculation when usable volume is available.
Source selects the price series used by the oscillator. Close is the default; other available chart sources can be selected.
Confirmed Higher-Timeframe Values uses completed higher-timeframe readings when a requested macro timeframe is higher than Zone 3. Disabling it allows developing higher-timeframe readings.
Levels Settings
Overbought Level and Oversold Level set the shared thresholds for all three zones. Their defaults are 70 and 30.
RSI Color - Zone 1, Zone 2, and Zone 3 set each oscillator's base color in the neutral region.
70 Level Color and 30 Level Color set the colors of the overbought and oversold reference lines. They also set the corresponding value-label color when a zone is above or below its threshold.
50 Midline Color sets the neutral reference-line color.
Bullish Gradient Color and Bearish Gradient Color set the shared base colors of the overbought and oversold fills. The gradient changes its transparency according to the oscillator's position within the extreme region.
70 Level Width, 30 Level Width, and 50 Midline Width control the thickness of their respective reference lines.
Oscillator Style & Personalization
Plot Style - Zone 1, Zone 2, and Zone 3 independently select Line, Histogram, Columns, Area, Step line, or Circles. Line is the default for each zone.
Plot Width - Zone 1, Zone 2, and Zone 3 control the width of their respective oscillator plots.
Use Independent OB/OS Fill Colors per Zone is disabled by default. When enabled, the six zone-specific bullish and bearish fill color inputs are used instead of the shared gradient colors. The toggle changes fill colors, not the oscillator calculations or alert conditions.
RSI Value Labels
Show RSI Value Labels toggles the right-side numerical readouts.
Label Horizontal Offset controls the number of chart bars between the latest bar and the labels. Its default is eight.
Label Text Size selects a supported fixed label size. Pine Script does not provide a continuous percentage font-size setting.
Liquidity Filter
Suppress Alerts on Low Volume enables or disables the volume guard.
Volume Average Length controls the number of chart bars used for the average-volume reference.
Minimum Volume Ratio sets the minimum current-volume-to-average-volume ratio required for alerts to pass the filter.
Pro - Confluence & Alerts
Chart Weight, Macro 1 Weight, and Macro 2 Weight determine each zone's contribution to the alignment scores.
Alignment Threshold sets the score level that the alignment alerts must cross.
Alert Cooldown sets the minimum number of chart bars between the four alignment, recovery, and rejection alert events.
Wait for Bar Close gates alerts until the chart bar is confirmed when enabled.
Show Dashboard toggles the dashboard table.
HOW TO USE IT
For intraday trading, a trader might use a 5-minute or 15-minute chart for Zone 3, a 4-hour timeframe for Zone 2, and a daily timeframe for Zone 1. This arrangement uses the local oscillator to observe shorter-term momentum while keeping intermediate and slower context visible. The default weights give the macro zones more influence; increase the Chart Weight if the local reading should contribute more heavily to alignment.
For swing trading, a 4-hour or daily chart can serve as Zone 3, with two-day or weekly context in the macro zones. The supplied defaults are a starting point, not a requirement. Choose settings that match the holding period and make the hierarchy clear.
For position trading or longer-horizon investing, users can set Zone 3 to daily, Zone 2 to weekly, and Zone 1 to monthly, subject to the timeframes available for the selected symbol. The oscillator can be applied to different markets and chart timeframes because the calculation is based on price series and selected intervals rather than a particular asset class.
For short-term scalping, a trader may use a 1-minute, 3-minute, or 5-minute chart for Zone 3 and use higher intraday intervals for context. Fast charts can generate more fluctuations. The macro zones, confirmed higher-timeframe option, and alignment threshold can be used to assess whether the local reading agrees with broader momentum, but they do not eliminate the risks of spread, execution, slippage, or rapid price changes.
WHAT MAKES THIS INDICATOR DISTINCT
The script combines three elements in one tool: its own range-extension RSI-style calculation, a stacked three-timeframe display, and a user-weighted directional alignment score with associated alerts. The range-extension calculation responds differently when the rolling source high or low makes a new extreme than when price moves without extending either extreme. Optional volume weighting modifies the contribution of those inputs when volume data is available.
The three zones let users compare the same calculation across separate timeframes without opening separate panes. The weighted score makes the influence of each zone adjustable rather than treating the three readings as equally important by default. Right-side values address the difficulty of reading individual oscillator values from the combined 0-to-300 scale. These are the design choices of this script; the underlying concepts of momentum oscillators, moving averages, and multi-timeframe analysis are established techniques.
MARKETS, TIMEFRAMES, AND LIMITATIONS
The indicator can be used on instruments with chart data available in TradingView, including stocks, futures, indices, cryptocurrencies, and forex. The calculation itself does not require volume. Volume weighting and the optional low-volume alert filter depend on the quality and availability of volume data; forex, index, and some CFD feeds may provide no volume or a volume measure that differs from exchange-traded volume.
The indicator can be configured for intraday scalping, day trading, swing trading, or longer-horizon position analysis. Its defaults of two-day and weekly macro timeframes are not suitable for every chart interval, so adjust the timeframes when necessary and pay attention to the dashboard warning. A timeframe combination should be chosen for the market and holding period being analyzed.
An overbought reading does not necessarily mean that price is about to fall, and an oversold reading does not necessarily mean that price is about to rise. Strong trends can keep an oscillator near an extreme for an extended period. Alignment describes agreement between the selected oscillator directions; it is not a statistical win rate, a guarantee, or a standalone entry or exit rule.
DISCLAIMER
This indicator is an analytical tool, not financial advice or a recommendation to buy or sell any instrument. It does not predict future prices or guarantee results. Trading involves risk, including the possible loss of capital. Verify settings and data for the symbol and timeframe you use, and make independent decisions using appropriate risk management.

면책사항
해당 정보와 게시물은 금융, 투자, 트레이딩 또는 기타 유형의 조언이나 권장 사항으로 간주되지 않으며, 트레이딩뷰에서 제공하거나 보증하는 것이 아닙니다. 자세한 내용은 이용 약관을 참조하세요.
면책사항
해당 정보와 게시물은 금융, 투자, 트레이딩 또는 기타 유형의 조언이나 권장 사항으로 간주되지 않으며, 트레이딩뷰에서 제공하거나 보증하는 것이 아닙니다. 자세한 내용은 이용 약관을 참조하세요.