업데이트됨
MK_OSFT - Multi-timeframe MA Lines with labels
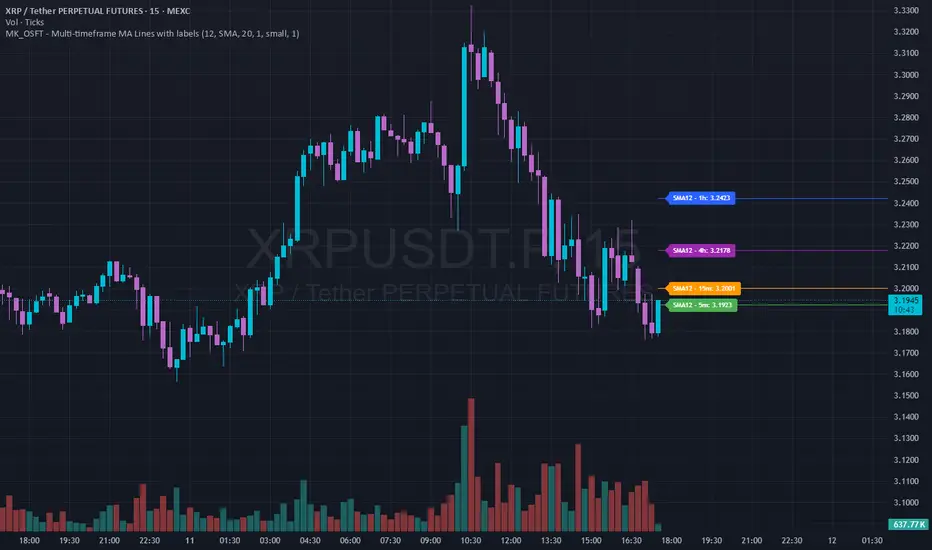
Provides SMA/EMA levels on a chart for the 5m, 15m, 1H and 4H timeframes. It does not draw the full MA's on the chart but provides 'only' the actual MA values at the current candle as a horizontal line with a label.
릴리즈 노트
Provides SMA/EMA levels on a chart for the 5m, 15m, 1H and 4H timeframes. It does not draw the full MA's on the chart but provides 'only' the actual MA values at the current candle as a horizontal line with a label.Provides Settings for: MA-Type EMA/SMA, MA-length, Label offset, Label Text size and colors, Timeframe selection

면책사항
해당 정보와 게시물은 금융, 투자, 트레이딩 또는 기타 유형의 조언이나 권장 사항으로 간주되지 않으며, 트레이딩뷰에서 제공하거나 보증하는 것이 아닙니다. 자세한 내용은 이용 약관을 참조하세요.
면책사항
해당 정보와 게시물은 금융, 투자, 트레이딩 또는 기타 유형의 조언이나 권장 사항으로 간주되지 않으며, 트레이딩뷰에서 제공하거나 보증하는 것이 아닙니다. 자세한 내용은 이용 약관을 참조하세요.