UHV Reversal Boxes v6 - Live Extend + Fade On Break
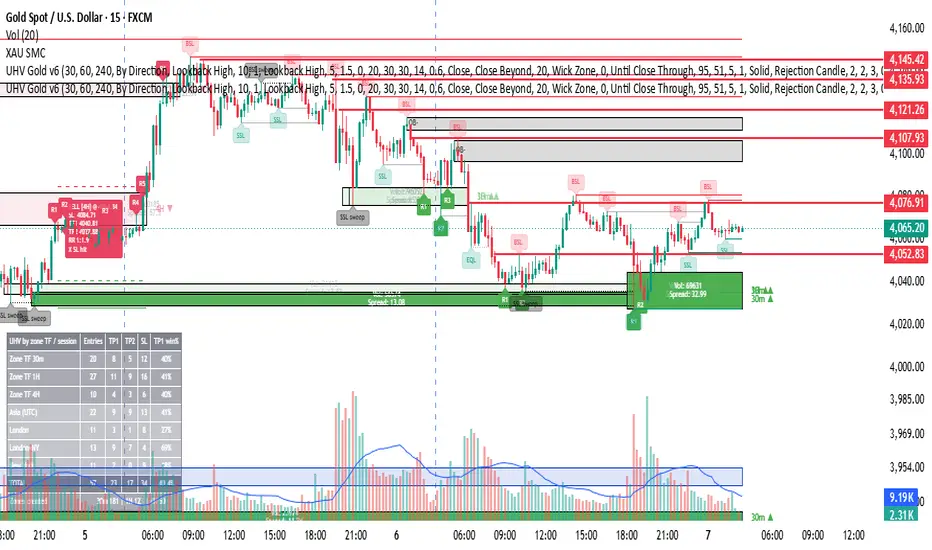
UHV Reversal Boxes v6 – Live Extend & Fade On Break
UHV (Ultra High Volume) Reversal Boxes is an analytical chart overlay indicator designed to identify and visualize key market structure reversal zones based on volume spikes and price action dynamics.
How It Works:
- High-Volume Zone Detection: Automatically identifies potential support and resistance zones where significant institutional volume spikes occur.
- Live Dynamic Extension: Projected reversal boxes dynamically extend live to the right as long as the identified price zone remains active and unmitigated.
- Automated Fading/Mitigation: Once price closes beyond or breaks the key reversal zone, the indicator automatically fades out or disables the box to maintain a clean chart presentation.
Key Features:
- Visual representation of high-volume rejection zones.
- Real-time box tracking to monitor liquidity and structural levels.
- Fully customizable parameters for volume sensitivity and display aesthetics.
How to Use:
1. Apply the indicator to your desired timeframe.
2. Monitor the active reversal boxes for potential liquidity sweeps, rejection candles, or structural confirmations.
3. Always align these visual zones with your independent analysis and risk management rules.
Note: Source code is open-source for community educational purposes.
Disclaimer: This tool is strictly for analytical purposes and does not constitute financial advice.
UHV (Ultra High Volume) Reversal Boxes is an analytical chart overlay indicator designed to identify and visualize key market structure reversal zones based on volume spikes and price action dynamics.
How It Works:
- High-Volume Zone Detection: Automatically identifies potential support and resistance zones where significant institutional volume spikes occur.
- Live Dynamic Extension: Projected reversal boxes dynamically extend live to the right as long as the identified price zone remains active and unmitigated.
- Automated Fading/Mitigation: Once price closes beyond or breaks the key reversal zone, the indicator automatically fades out or disables the box to maintain a clean chart presentation.
Key Features:
- Visual representation of high-volume rejection zones.
- Real-time box tracking to monitor liquidity and structural levels.
- Fully customizable parameters for volume sensitivity and display aesthetics.
How to Use:
1. Apply the indicator to your desired timeframe.
2. Monitor the active reversal boxes for potential liquidity sweeps, rejection candles, or structural confirmations.
3. Always align these visual zones with your independent analysis and risk management rules.
Note: Source code is open-source for community educational purposes.
Disclaimer: This tool is strictly for analytical purposes and does not constitute financial advice.

면책사항
해당 정보와 게시물은 금융, 투자, 트레이딩 또는 기타 유형의 조언이나 권장 사항으로 간주되지 않으며, 트레이딩뷰에서 제공하거나 보증하는 것이 아닙니다. 자세한 내용은 이용 약관을 참조하세요.
면책사항
해당 정보와 게시물은 금융, 투자, 트레이딩 또는 기타 유형의 조언이나 권장 사항으로 간주되지 않으며, 트레이딩뷰에서 제공하거나 보증하는 것이 아닙니다. 자세한 내용은 이용 약관을 참조하세요.