TSF Highest Volume
TSF Highest Volume
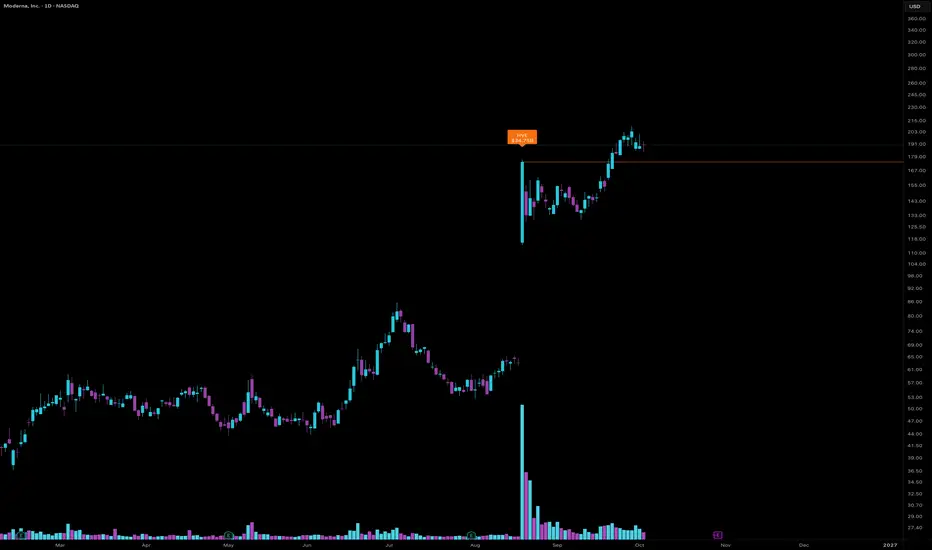
TSF Highest Volume labels the up days on which a stock trades its heaviest volume: the highest ever, the highest since its IPO, or the highest in one year. Each label shows the dollar volume of that day, and a price line marks the close of the most recent one. It works on daily, weekly and monthly charts.
WHAT IT SHOWS
- HVE: an up day with more volume than every earlier bar on the chart, IPO day included.
- HVIPO: an up day with more volume than every earlier bar except the IPO day. This works for stocks that listed less than a year ago.
- HV1: an up day with more volume than every bar of the prior year (250 daily, 52 weekly or 12 monthly bars).
- Dollar volume: the bar's volume multiplied by its close, shown under the tag.
- Price line: a horizontal line at the closing price of the most recent labelled bar. Only the latest one is drawn.
Only one label is shown per bar, in this order: HVE, then HVIPO, then HV1. An up day is a bar that closes above the prior bar's close. Record volume on a down day gets no label, but it still counts as the level a later up day has to beat.
HOW TO USE IT
Use the labels to spot the days when demand for a stock was at its heaviest, and the line to see where price stands against the close of the latest one. The labels and the line describe what happened. They are not buy or sell signals. A label on the current bar is final once the bar closes.
The IPO day is taken to be the first bar on the chart, and no HVE or HVIPO label is drawn during a stock's first 20 bars. This is the implementation used in The Setup Factory's own tools, published as one fixed standard. All rules it applies are stated above.
TSF Highest Volume labels the up days on which a stock trades its heaviest volume: the highest ever, the highest since its IPO, or the highest in one year. Each label shows the dollar volume of that day, and a price line marks the close of the most recent one. It works on daily, weekly and monthly charts.
WHAT IT SHOWS
- HVE: an up day with more volume than every earlier bar on the chart, IPO day included.
- HVIPO: an up day with more volume than every earlier bar except the IPO day. This works for stocks that listed less than a year ago.
- HV1: an up day with more volume than every bar of the prior year (250 daily, 52 weekly or 12 monthly bars).
- Dollar volume: the bar's volume multiplied by its close, shown under the tag.
- Price line: a horizontal line at the closing price of the most recent labelled bar. Only the latest one is drawn.
Only one label is shown per bar, in this order: HVE, then HVIPO, then HV1. An up day is a bar that closes above the prior bar's close. Record volume on a down day gets no label, but it still counts as the level a later up day has to beat.
HOW TO USE IT
Use the labels to spot the days when demand for a stock was at its heaviest, and the line to see where price stands against the close of the latest one. The labels and the line describe what happened. They are not buy or sell signals. A label on the current bar is final once the bar closes.
The IPO day is taken to be the first bar on the chart, and no HVE or HVIPO label is drawn during a stock's first 20 bars. This is the implementation used in The Setup Factory's own tools, published as one fixed standard. All rules it applies are stated above.

면책사항
해당 정보와 게시물은 금융, 투자, 트레이딩 또는 기타 유형의 조언이나 권장 사항으로 간주되지 않으며, 트레이딩뷰에서 제공하거나 보증하는 것이 아닙니다. 자세한 내용은 이용 약관을 참조하세요.
면책사항
해당 정보와 게시물은 금융, 투자, 트레이딩 또는 기타 유형의 조언이나 권장 사항으로 간주되지 않으며, 트레이딩뷰에서 제공하거나 보증하는 것이 아닙니다. 자세한 내용은 이용 약관을 참조하세요.