OPEN-SOURCE SCRIPT
Inzzane Overwatch v260407
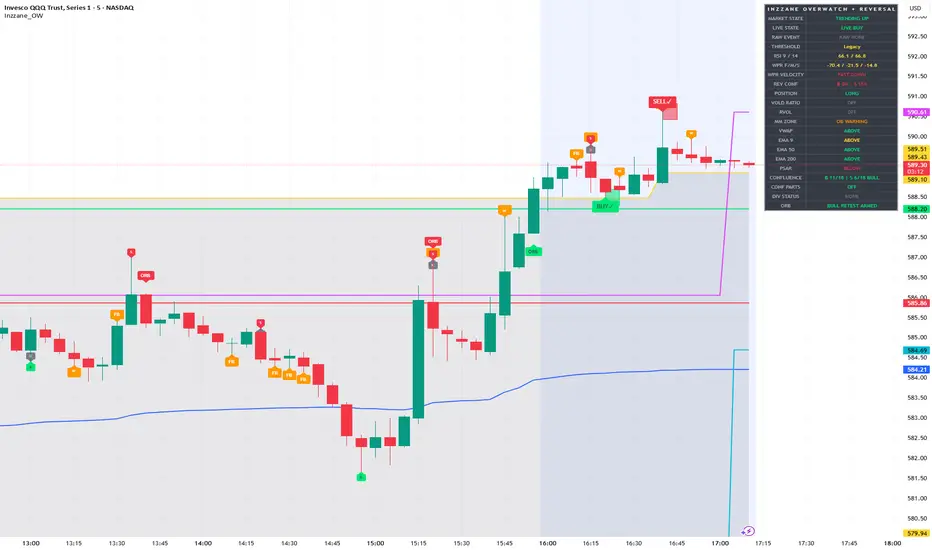
This script is built to give you an “all-in-one” trading view so you do not need several separate indicators on your chart. It combines trend tools, reversal tools, breakout tools, support/resistance zones, and a scoring system into one script.
Key sections:
Heikin-Ashi Offset Candles: Adds a second set of smoother candles above price to make short-term trend direction easier to see.
Golden Zones / Fair Value Gaps: Highlights imbalance areas where price moved quickly and may return later for a retest.
Trend Indicators: Includes EMA 9, EMA 21, EMA 50, EMA 200, VWAP, and PSAR.
EMA 9/21 cloud helps show short-term bullish or bearish trend
EMA 50 and EMA 200 help define the larger trend
VWAP shows average traded price
PSAR dots help identify trend shifts
False Breakouts: Labels “FB” appear when price breaks a recent high or low but quickly reverses back, which can warn of bull traps or bear traps.
AGAIG Signal Engine: This is one of the main features of the script.
It creates BUY and SELL signals using pivots, reversals, and adaptive thresholds.
Signals are not just static arrows—they can change state as price moves.
BUY / SELL = fresh signal
BUY✓ / SELL✓ = confirmed signal
BUY? / SELL? = weakening signal
X = invalidated signal
W = weakening warning
Murray Math Levels: Creates overbought and oversold zones using 0/8, 1/8, 7/8, and 8/8 levels.
0/8 and 1/8 are oversold zones
7/8 and 8/8 are overbought zones
Reversal Engine: Uses RSI divergence, Williams %R, volume, candle strength, and momentum to score reversal setups.
Bullish setups get ▲ labels
Bearish setups get ▼ labels
S tier = strongest setup
A tier = medium setup
B tier = weaker setup
REG = regular divergence
HID = hidden divergence
The number in parentheses is the confidence score
ORB Strategy: Watches the first 5 or 15 minutes of the trading day to build an opening range, then looks for breakouts and retests.
Market Context: Evaluates whether the market is:
Trending Up
Trending Down
Consolidating
Expanding
Accumulation-Like
Distribution-Like
Transitioning
Ichimoku Context: Adds another layer of bullish or bearish confirmation based on cloud position and trend alignment.
Confluence Engine: Combines all the major systems together:
Current AGAIG signals
Higher timeframe AGAIG alignment
Reversal engine
ORB signals
PSAR flips
Heikin-Ashi trend
Ichimoku trend
The more systems that agree in the same direction, the stronger the bullish or bearish confluence score becomes.
Finally, the dashboard summarizes everything into one panel showing:
Live buy/sell state
Market condition
RSI and WPR status
Reversal confidence
RVOL and VOLD
Murray Math zone
Bullish vs bearish confluence
Which side currently has the advantage
It is essentially designed to function like a trading “cockpit,” where multiple tools all work together to help you quickly judge whether a setup is strong, weak, or risky.
Key sections:
Heikin-Ashi Offset Candles: Adds a second set of smoother candles above price to make short-term trend direction easier to see.
Golden Zones / Fair Value Gaps: Highlights imbalance areas where price moved quickly and may return later for a retest.
Trend Indicators: Includes EMA 9, EMA 21, EMA 50, EMA 200, VWAP, and PSAR.
EMA 9/21 cloud helps show short-term bullish or bearish trend
EMA 50 and EMA 200 help define the larger trend
VWAP shows average traded price
PSAR dots help identify trend shifts
False Breakouts: Labels “FB” appear when price breaks a recent high or low but quickly reverses back, which can warn of bull traps or bear traps.
AGAIG Signal Engine: This is one of the main features of the script.
It creates BUY and SELL signals using pivots, reversals, and adaptive thresholds.
Signals are not just static arrows—they can change state as price moves.
BUY / SELL = fresh signal
BUY✓ / SELL✓ = confirmed signal
BUY? / SELL? = weakening signal
X = invalidated signal
W = weakening warning
Murray Math Levels: Creates overbought and oversold zones using 0/8, 1/8, 7/8, and 8/8 levels.
0/8 and 1/8 are oversold zones
7/8 and 8/8 are overbought zones
Reversal Engine: Uses RSI divergence, Williams %R, volume, candle strength, and momentum to score reversal setups.
Bullish setups get ▲ labels
Bearish setups get ▼ labels
S tier = strongest setup
A tier = medium setup
B tier = weaker setup
REG = regular divergence
HID = hidden divergence
The number in parentheses is the confidence score
ORB Strategy: Watches the first 5 or 15 minutes of the trading day to build an opening range, then looks for breakouts and retests.
Market Context: Evaluates whether the market is:
Trending Up
Trending Down
Consolidating
Expanding
Accumulation-Like
Distribution-Like
Transitioning
Ichimoku Context: Adds another layer of bullish or bearish confirmation based on cloud position and trend alignment.
Confluence Engine: Combines all the major systems together:
Current AGAIG signals
Higher timeframe AGAIG alignment
Reversal engine
ORB signals
PSAR flips
Heikin-Ashi trend
Ichimoku trend
The more systems that agree in the same direction, the stronger the bullish or bearish confluence score becomes.
Finally, the dashboard summarizes everything into one panel showing:
Live buy/sell state
Market condition
RSI and WPR status
Reversal confidence
RVOL and VOLD
Murray Math zone
Bullish vs bearish confluence
Which side currently has the advantage
It is essentially designed to function like a trading “cockpit,” where multiple tools all work together to help you quickly judge whether a setup is strong, weak, or risky.
오픈 소스 스크립트
트레이딩뷰의 진정한 정신에 따라, 이 스크립트의 작성자는 이를 오픈소스로 공개하여 트레이더들이 기능을 검토하고 검증할 수 있도록 했습니다. 작성자에게 찬사를 보냅니다! 이 코드는 무료로 사용할 수 있지만, 코드를 재게시하는 경우 하우스 룰이 적용된다는 점을 기억하세요.

면책사항
해당 정보와 게시물은 금융, 투자, 트레이딩 또는 기타 유형의 조언이나 권장 사항으로 간주되지 않으며, 트레이딩뷰에서 제공하거나 보증하는 것이 아닙니다. 자세한 내용은 이용 약관을 참조하세요.
오픈 소스 스크립트
트레이딩뷰의 진정한 정신에 따라, 이 스크립트의 작성자는 이를 오픈소스로 공개하여 트레이더들이 기능을 검토하고 검증할 수 있도록 했습니다. 작성자에게 찬사를 보냅니다! 이 코드는 무료로 사용할 수 있지만, 코드를 재게시하는 경우 하우스 룰이 적용된다는 점을 기억하세요.
면책사항
해당 정보와 게시물은 금융, 투자, 트레이딩 또는 기타 유형의 조언이나 권장 사항으로 간주되지 않으며, 트레이딩뷰에서 제공하거나 보증하는 것이 아닙니다. 자세한 내용은 이용 약관을 참조하세요.