OPEN-SOURCE SCRIPT
Clean Key Levels Map
Clean Key Levels Map
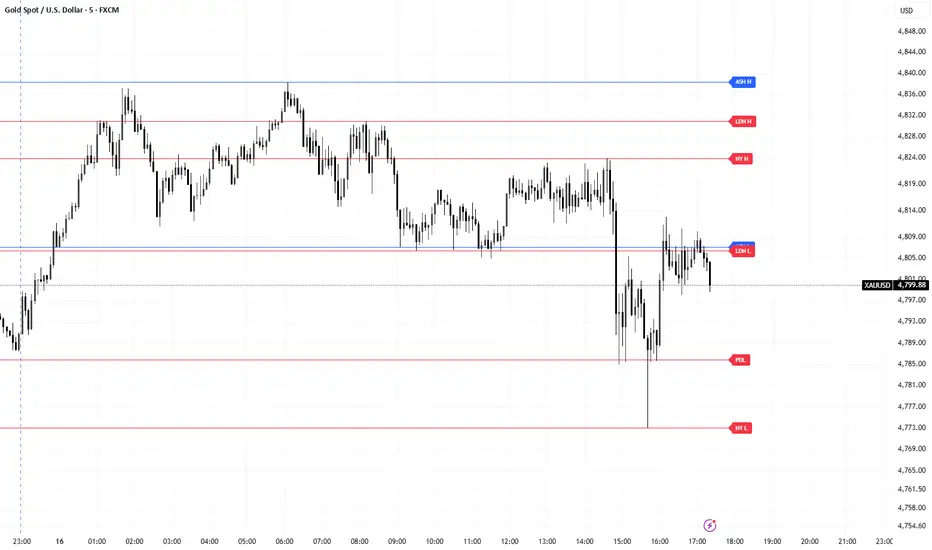
Clean Key Levels Map is a simple level-marking indicator designed for traders who want an uncluttered chart with only the most important reference prices.
This tool plots key levels from higher timeframes and major trading sessions, with short labels printed on the right side for quick identification. All lines begin from the start of the current trading day, which keeps the chart clean and structured for intraday decision-making.
Included levels
Previous Day High and Low
Previous NY Session High and Low
Asia Session High and Low
London Session High and Low
Weekly High and Low
Monthly High and Low
Features
Clean horizontal line layout
Short level names on the right side
Custom on/off toggle for each level group
Custom color selection for each level group
Adjustable line width
Adjustable label offset
Optional auto-delete of old levels on a new day
Built for traders who prefer a simple chart without unnecessary signals
Best use
This indicator is best used as a visual map for:
liquidity levels
session highs and lows
reaction zones
intraday context
breakout and sweep-based trading
It does not generate buy or sell signals. Its purpose is to help traders read price around important levels with clarity.
Notes
Previous NY High and Low are based on the defined NY session input
Asia and London levels are based on their completed session ranges
Weekly and Monthly levels are taken from the previous completed week and month
All lines are designed to start from the beginning of the current trading day for a cleaner intraday view
This indicator is ideal for traders who use price action, sweeps, session liquidity, ORB, or level-to-level trading and want a clean framework on the chart.
Clean Key Levels Map is a simple level-marking indicator designed for traders who want an uncluttered chart with only the most important reference prices.
This tool plots key levels from higher timeframes and major trading sessions, with short labels printed on the right side for quick identification. All lines begin from the start of the current trading day, which keeps the chart clean and structured for intraday decision-making.
Included levels
Previous Day High and Low
Previous NY Session High and Low
Asia Session High and Low
London Session High and Low
Weekly High and Low
Monthly High and Low
Features
Clean horizontal line layout
Short level names on the right side
Custom on/off toggle for each level group
Custom color selection for each level group
Adjustable line width
Adjustable label offset
Optional auto-delete of old levels on a new day
Built for traders who prefer a simple chart without unnecessary signals
Best use
This indicator is best used as a visual map for:
liquidity levels
session highs and lows
reaction zones
intraday context
breakout and sweep-based trading
It does not generate buy or sell signals. Its purpose is to help traders read price around important levels with clarity.
Notes
Previous NY High and Low are based on the defined NY session input
Asia and London levels are based on their completed session ranges
Weekly and Monthly levels are taken from the previous completed week and month
All lines are designed to start from the beginning of the current trading day for a cleaner intraday view
This indicator is ideal for traders who use price action, sweeps, session liquidity, ORB, or level-to-level trading and want a clean framework on the chart.
오픈 소스 스크립트
트레이딩뷰의 진정한 정신에 따라, 이 스크립트의 작성자는 이를 오픈소스로 공개하여 트레이더들이 기능을 검토하고 검증할 수 있도록 했습니다. 작성자에게 찬사를 보냅니다! 이 코드는 무료로 사용할 수 있지만, 코드를 재게시하는 경우 하우스 룰이 적용된다는 점을 기억하세요.

면책사항
해당 정보와 게시물은 금융, 투자, 트레이딩 또는 기타 유형의 조언이나 권장 사항으로 간주되지 않으며, 트레이딩뷰에서 제공하거나 보증하는 것이 아닙니다. 자세한 내용은 이용 약관을 참조하세요.
오픈 소스 스크립트
트레이딩뷰의 진정한 정신에 따라, 이 스크립트의 작성자는 이를 오픈소스로 공개하여 트레이더들이 기능을 검토하고 검증할 수 있도록 했습니다. 작성자에게 찬사를 보냅니다! 이 코드는 무료로 사용할 수 있지만, 코드를 재게시하는 경우 하우스 룰이 적용된다는 점을 기억하세요.
면책사항
해당 정보와 게시물은 금융, 투자, 트레이딩 또는 기타 유형의 조언이나 권장 사항으로 간주되지 않으며, 트레이딩뷰에서 제공하거나 보증하는 것이 아닙니다. 자세한 내용은 이용 약관을 참조하세요.