Order Block Finder, Tested [Quanty]
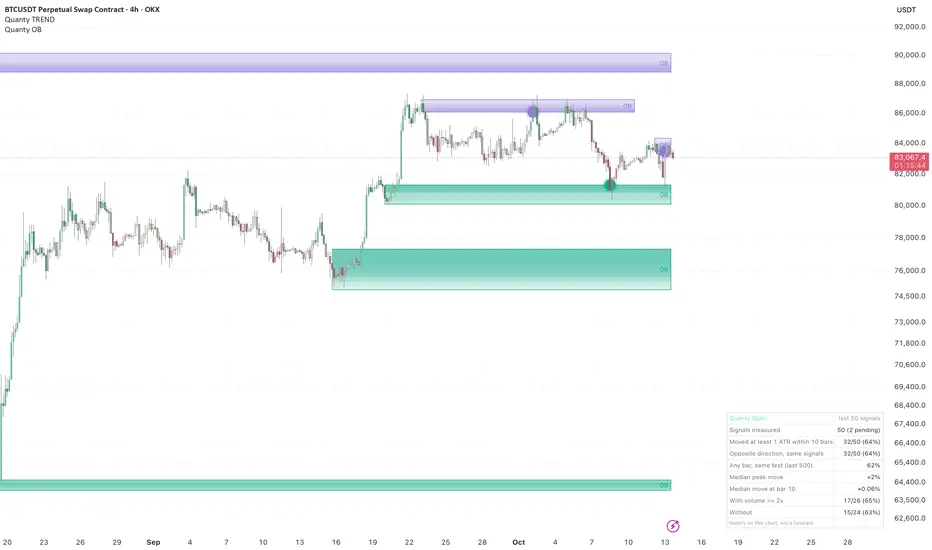
Order blocks drawn as plain boxes, teal support below price and violet resistance above it: watch the first return to a box, and let the table show whether such returns have held on your chart.
Order Block Finder marks the candle where a strong move started, as one simple box. A small dot marks the first time price comes back to a box. In the corner, a table tests those returns against chance.
HOW IT WORKS
The rules for a box below price (support); a box above price (resistance) is the mirror image.
1. Swing high. A high that is the highest of the 7 candles around it (3 on each side; a setting). It is confirmed 3 candles later.
2. Break of structure. A candle closes above the last confirmed swing high, at most 450 candles after it. Each swing high is used once: if the first close above it is not strong, that swing makes no box. The breaking candle must be strong: a body of at least 1 ATR (14), or a fair value gap (its low above the high of two candles earlier). The strength filter can be switched off.
3. Order block. The move started at the lowest low between that swing high and the breaking candle (the first one, if two lows are equal). The box is the full range (high to low, wicks included) of the last down candle among the 6 candles ending at that low.
4. A new box that overlaps a live box on the same side is not drawn.
5. A box ends, and disappears, when a candle closes below its bottom. A resistance box ends when a candle closes above its top.
6. The first time a candle's low reaches the top of a support box (or its high reaches the bottom of a resistance box), a dot marks it. After that touch the box extends for 50 more bars and then stops, so old boxes do not stretch across the chart.
A box appears on the close of the candle that breaks structure. It is drawn back to the candle it comes from, but it never appears before that close. Everything is read on closed candles. The 3 newest live boxes per side are shown (a setting); the Stats table counts every box, up to 100 per side, not only the ones on screen.
VOLUME SHADING
Each box is cut into 10 horizontal bands. A band is darker where more volume traded, from 20 candles before the order block candle to the candle that broke structure, with each candle's volume spread evenly over its high-low range. The darkest band is where most of the trading in that move happened. This is drawing only: it does not change the boxes, the dots or the Stats table, and the shading itself has not been tested against chance. It can be switched off.
WHAT WE FOUND
We tested the first return to a box offline on crypto perpetual futures, on 1-hour and 4-hour charts over the last year and on 4-hour charts from 2021 to 2025, against a random candle on the same coin and against all coins at the same hour. The test was written down before it was run. We ran it twice, for two box shapes: the candle body and the full candle with its wicks (this version draws the full candle). Both gave the same answer. Price did not move away from the box first (up from support, down from resistance) more often than chance. On 1-hour charts over the last year it did so slightly less often; the 2021 to 2025 data did not confirm it. The size of the move after a touch was what the coin's own volatility predicted. Breaks of structure also did not beat a coin toss in our earlier tests. Treat a box as a place to watch, not as a level that holds, and check it on your own symbol and timeframe.
HOW TO READ THE STATS TABLE
The table in the corner takes the last 50 first returns to a box on the chart you are viewing (the number after the slash) and counts in how many of them price moved at least 1 ATR (14 bars) away from the box within the next 10 bars: up from support, down from resistance. A candle that touches boxes on both sides is not counted. It is a measurement of history on this symbol and timeframe, not a prediction and not a promise. Change the symbol or the timeframe and the numbers change with it. Past results do not guarantee future results.
The next row tests the same returns in the opposite direction: if both directions score about the same, the box marked a volatile moment, not a direction. The row after that runs the same test on every one of the last 500 bars in a random direction, so you can see what a coin toss would have scored here. Two more rows split the count by volume: returns whose candle volume was at least 2 times the average of the previous 50 bars, and the rest. When one side has only a handful of returns, read it as a handful, not as a rate. Returns that are too recent to be measured are not counted. The threshold can be set in ATR or in percent, and the number of bars ahead is a setting. The table can be collapsed to one line, and its colours follow your chart theme.
Alerts: "Order block: touch of a box below" and "Order block: touch of a box above", both on the close of the candle.
Written from the concept; no code from other scripts is used.
Not investment advice.
Order Block Finder marks the candle where a strong move started, as one simple box. A small dot marks the first time price comes back to a box. In the corner, a table tests those returns against chance.
HOW IT WORKS
The rules for a box below price (support); a box above price (resistance) is the mirror image.
1. Swing high. A high that is the highest of the 7 candles around it (3 on each side; a setting). It is confirmed 3 candles later.
2. Break of structure. A candle closes above the last confirmed swing high, at most 450 candles after it. Each swing high is used once: if the first close above it is not strong, that swing makes no box. The breaking candle must be strong: a body of at least 1 ATR (14), or a fair value gap (its low above the high of two candles earlier). The strength filter can be switched off.
3. Order block. The move started at the lowest low between that swing high and the breaking candle (the first one, if two lows are equal). The box is the full range (high to low, wicks included) of the last down candle among the 6 candles ending at that low.
4. A new box that overlaps a live box on the same side is not drawn.
5. A box ends, and disappears, when a candle closes below its bottom. A resistance box ends when a candle closes above its top.
6. The first time a candle's low reaches the top of a support box (or its high reaches the bottom of a resistance box), a dot marks it. After that touch the box extends for 50 more bars and then stops, so old boxes do not stretch across the chart.
A box appears on the close of the candle that breaks structure. It is drawn back to the candle it comes from, but it never appears before that close. Everything is read on closed candles. The 3 newest live boxes per side are shown (a setting); the Stats table counts every box, up to 100 per side, not only the ones on screen.
VOLUME SHADING
Each box is cut into 10 horizontal bands. A band is darker where more volume traded, from 20 candles before the order block candle to the candle that broke structure, with each candle's volume spread evenly over its high-low range. The darkest band is where most of the trading in that move happened. This is drawing only: it does not change the boxes, the dots or the Stats table, and the shading itself has not been tested against chance. It can be switched off.
WHAT WE FOUND
We tested the first return to a box offline on crypto perpetual futures, on 1-hour and 4-hour charts over the last year and on 4-hour charts from 2021 to 2025, against a random candle on the same coin and against all coins at the same hour. The test was written down before it was run. We ran it twice, for two box shapes: the candle body and the full candle with its wicks (this version draws the full candle). Both gave the same answer. Price did not move away from the box first (up from support, down from resistance) more often than chance. On 1-hour charts over the last year it did so slightly less often; the 2021 to 2025 data did not confirm it. The size of the move after a touch was what the coin's own volatility predicted. Breaks of structure also did not beat a coin toss in our earlier tests. Treat a box as a place to watch, not as a level that holds, and check it on your own symbol and timeframe.
HOW TO READ THE STATS TABLE
The table in the corner takes the last 50 first returns to a box on the chart you are viewing (the number after the slash) and counts in how many of them price moved at least 1 ATR (14 bars) away from the box within the next 10 bars: up from support, down from resistance. A candle that touches boxes on both sides is not counted. It is a measurement of history on this symbol and timeframe, not a prediction and not a promise. Change the symbol or the timeframe and the numbers change with it. Past results do not guarantee future results.
The next row tests the same returns in the opposite direction: if both directions score about the same, the box marked a volatile moment, not a direction. The row after that runs the same test on every one of the last 500 bars in a random direction, so you can see what a coin toss would have scored here. Two more rows split the count by volume: returns whose candle volume was at least 2 times the average of the previous 50 bars, and the rest. When one side has only a handful of returns, read it as a handful, not as a rate. Returns that are too recent to be measured are not counted. The threshold can be set in ATR or in percent, and the number of bars ahead is a setting. The table can be collapsed to one line, and its colours follow your chart theme.
Alerts: "Order block: touch of a box below" and "Order block: touch of a box above", both on the close of the candle.
Written from the concept; no code from other scripts is used.
Not investment advice.

면책사항
해당 정보와 게시물은 금융, 투자, 트레이딩 또는 기타 유형의 조언이나 권장 사항으로 간주되지 않으며, 트레이딩뷰에서 제공하거나 보증하는 것이 아닙니다. 자세한 내용은 이용 약관을 참조하세요.
면책사항
해당 정보와 게시물은 금융, 투자, 트레이딩 또는 기타 유형의 조언이나 권장 사항으로 간주되지 않으며, 트레이딩뷰에서 제공하거나 보증하는 것이 아닙니다. 자세한 내용은 이용 약관을 참조하세요.