OI Candle by Umut
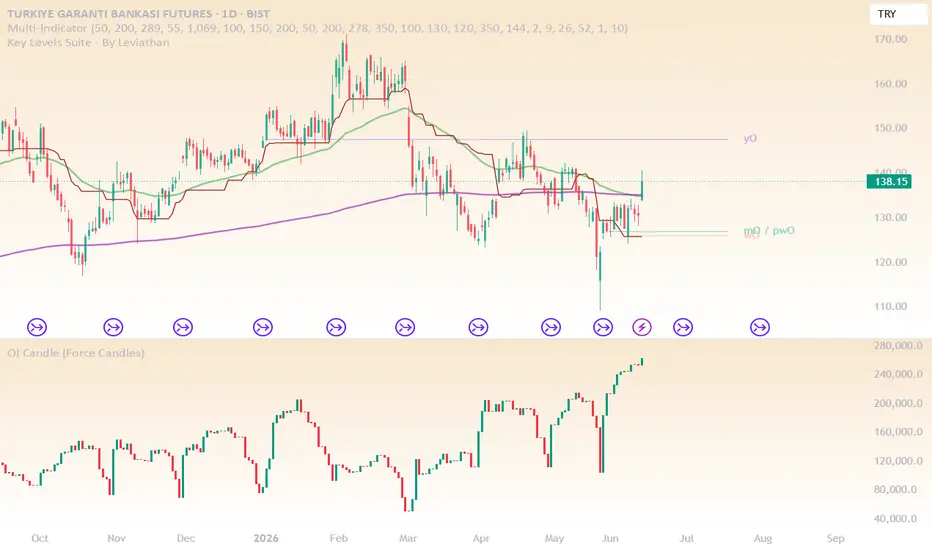
This indicator displays Open Interest (OI) as candlestick data across all timeframes, giving traders a clearer view of market participation and positioning dynamics.
Unlike standard OI indicators that use line charts or are limited to higher timeframes, this version visualizes OI using full OHLC candles. This allows you to analyze volatility, momentum, and structural changes in open interest in the same way as price action.
Unlike standard OI indicators that use line charts or are limited to higher timeframes, this version visualizes OI using full OHLC candles. This allows you to analyze volatility, momentum, and structural changes in open interest in the same way as price action.

면책사항
해당 정보와 게시물은 금융, 투자, 트레이딩 또는 기타 유형의 조언이나 권장 사항으로 간주되지 않으며, 트레이딩뷰에서 제공하거나 보증하는 것이 아닙니다. 자세한 내용은 이용 약관을 참조하세요.
면책사항
해당 정보와 게시물은 금융, 투자, 트레이딩 또는 기타 유형의 조언이나 권장 사항으로 간주되지 않으며, 트레이딩뷰에서 제공하거나 보증하는 것이 아닙니다. 자세한 내용은 이용 약관을 참조하세요.