Halo SOL-ETH 4H Scenario Map
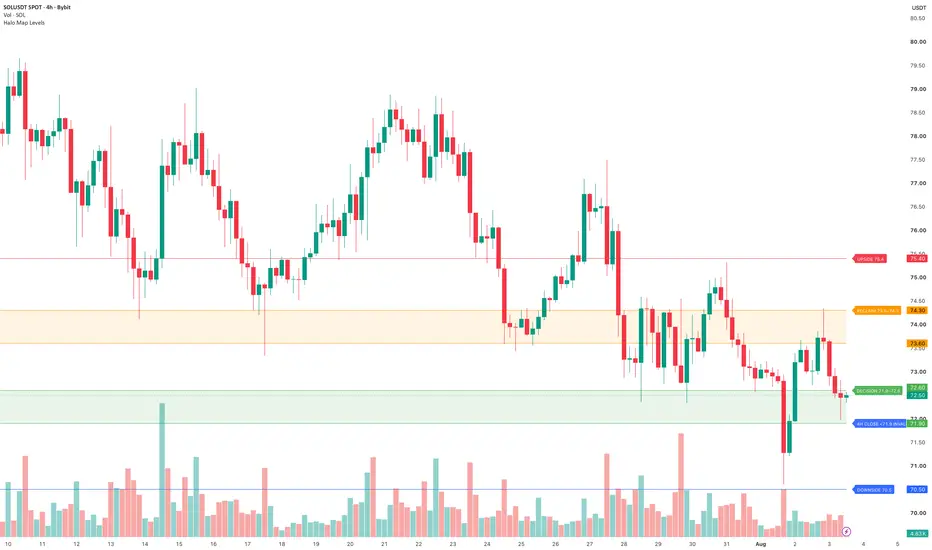
An open-source visual scenario map for the SOLUSDT and ETHUSDT 4-hour charts. It plots two transparent decision zones and the key upside, invalidation and downside levels used in the accompanying Halo market analysis.
SOL map: 71.9–72.6 decision zone, 73.6–74.3 reclaim zone, 75.4 upside and 70.5 downside after a 4H close below 71.9.
ETH map: 1,820–1,840 demand zone, 1,879–1,900 reclaim zone, 1,940 upside and 1,800 downside after a 4H close below 1,820.
The colors are intentionally simple: green for demand/decision, orange for reclaim, red for upside decision and blue for invalidation/downside. The script is a visual analysis aid only. It does not generate entries, execute trades or predict outcomes. Maps, not predictions.
SOL map: 71.9–72.6 decision zone, 73.6–74.3 reclaim zone, 75.4 upside and 70.5 downside after a 4H close below 71.9.
ETH map: 1,820–1,840 demand zone, 1,879–1,900 reclaim zone, 1,940 upside and 1,800 downside after a 4H close below 1,820.
The colors are intentionally simple: green for demand/decision, orange for reclaim, red for upside decision and blue for invalidation/downside. The script is a visual analysis aid only. It does not generate entries, execute trades or predict outcomes. Maps, not predictions.

면책사항
해당 정보와 게시물은 금융, 투자, 트레이딩 또는 기타 유형의 조언이나 권장 사항으로 간주되지 않으며, 트레이딩뷰에서 제공하거나 보증하는 것이 아닙니다. 자세한 내용은 이용 약관을 참조하세요.
면책사항
해당 정보와 게시물은 금융, 투자, 트레이딩 또는 기타 유형의 조언이나 권장 사항으로 간주되지 않으며, 트레이딩뷰에서 제공하거나 보증하는 것이 아닙니다. 자세한 내용은 이용 약관을 참조하세요.