OPEN-SOURCE SCRIPT
업데이트됨 Really Relative Volume (RVol) [BruzX]
█ OVERVIEW
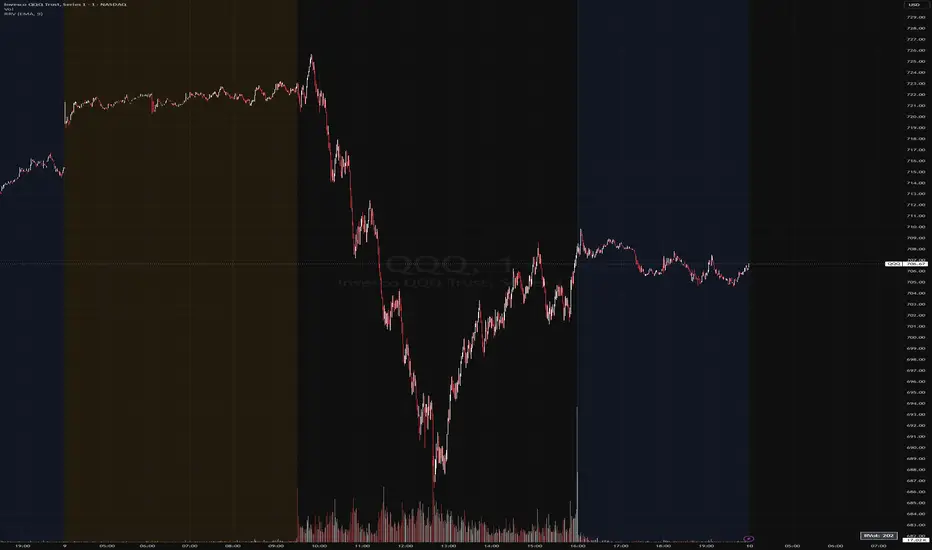
This indicator simply shows an estimate of intraday relative volume (RVol). By default, this is displayed as a small label at a configurable location on the pane. Optionally, the indicator can be moved to its own pane, where a plot of the historic values is shown as RVol develops throughout the session, as shown in the image below.

█ FEATURES
█ CONCEPTS
Relative volume (RVol) is the cumulative volume up to the current bar in the current session compared to the average cumulative volume up to the same bar over previous sessions. It is expressed as a percentage and is useful for assessing how actively a symbol is traded during the current day compared to what has been recently normal for that symbol.
It is intended for intraday use only. The exact value may vary slightly across timeframes due to how RVol is calculated. Generally, the lower the chart timeframe, the more accurate it is.
Between candle opens and closes, RVol is estimated using linear interpolation, based on the exact time of each tick, creating an estimate proportional to the amount of time elapsed within each bar.
RVol will differ during market hours depending on whether premarket data is included or excluded; this is expected and correct behaviour.
This indicator handles the average cumulative volume per bar correctly by storing the average for each bar in an array, making it more accurate than some similar indicators.
█ LIMITATIONS
A simple average is not available as an averaging method due to the complexity involved in storing a large matrix of each session’s volume values for each bar. Speed and efficiency are prioritised, and EMA and RMA can both be calculated recursively and efficiently. The difference is usually not significant.
█ DISCLAIMER
This indicator is provided for informational purposes only and should not be used in isolation without a good understanding of what it does and without considering other factors. You should not take trades using real money based solely on what this indicator indicates. Any trades you take are entirely at your own risk.
This indicator simply shows an estimate of intraday relative volume (RVol). By default, this is displayed as a small label at a configurable location on the pane. Optionally, the indicator can be moved to its own pane, where a plot of the historic values is shown as RVol develops throughout the session, as shown in the image below.
█ FEATURES
- Shows RVol either as a small label in a configurable location or as a plot
- Optionally can exclude pre- and post-market volume from the calculation for stocks
- Allows choosing between exponential moving average (EMA) and relative moving average (RMA) for the averaging method of cumulative volume per session
█ CONCEPTS
Relative volume (RVol) is the cumulative volume up to the current bar in the current session compared to the average cumulative volume up to the same bar over previous sessions. It is expressed as a percentage and is useful for assessing how actively a symbol is traded during the current day compared to what has been recently normal for that symbol.
It is intended for intraday use only. The exact value may vary slightly across timeframes due to how RVol is calculated. Generally, the lower the chart timeframe, the more accurate it is.
Between candle opens and closes, RVol is estimated using linear interpolation, based on the exact time of each tick, creating an estimate proportional to the amount of time elapsed within each bar.
RVol will differ during market hours depending on whether premarket data is included or excluded; this is expected and correct behaviour.
This indicator handles the average cumulative volume per bar correctly by storing the average for each bar in an array, making it more accurate than some similar indicators.
█ LIMITATIONS
A simple average is not available as an averaging method due to the complexity involved in storing a large matrix of each session’s volume values for each bar. Speed and efficiency are prioritised, and EMA and RMA can both be calculated recursively and efficiently. The difference is usually not significant.
█ DISCLAIMER
This indicator is provided for informational purposes only and should not be used in isolation without a good understanding of what it does and without considering other factors. You should not take trades using real money based solely on what this indicator indicates. Any trades you take are entirely at your own risk.
릴리즈 노트
- Added "%" to the RVol label릴리즈 노트
Changed default averaging method from EMA to RMA, and default length from 9 to 14 days오픈 소스 스크립트
트레이딩뷰의 진정한 정신에 따라, 이 스크립트의 작성자는 이를 오픈소스로 공개하여 트레이더들이 기능을 검토하고 검증할 수 있도록 했습니다. 작성자에게 찬사를 보냅니다! 이 코드는 무료로 사용할 수 있지만, 코드를 재게시하는 경우 하우스 룰이 적용된다는 점을 기억하세요.

If you like my free indicators, please consider my paid ones also: marketalchemists.org/indicators
면책사항
해당 정보와 게시물은 금융, 투자, 트레이딩 또는 기타 유형의 조언이나 권장 사항으로 간주되지 않으며, 트레이딩뷰에서 제공하거나 보증하는 것이 아닙니다. 자세한 내용은 이용 약관을 참조하세요.
오픈 소스 스크립트
트레이딩뷰의 진정한 정신에 따라, 이 스크립트의 작성자는 이를 오픈소스로 공개하여 트레이더들이 기능을 검토하고 검증할 수 있도록 했습니다. 작성자에게 찬사를 보냅니다! 이 코드는 무료로 사용할 수 있지만, 코드를 재게시하는 경우 하우스 룰이 적용된다는 점을 기억하세요.
If you like my free indicators, please consider my paid ones also: marketalchemists.org/indicators
면책사항
해당 정보와 게시물은 금융, 투자, 트레이딩 또는 기타 유형의 조언이나 권장 사항으로 간주되지 않으며, 트레이딩뷰에서 제공하거나 보증하는 것이 아닙니다. 자세한 내용은 이용 약관을 참조하세요.