업데이트됨
Dollar Volume (Qullamaggie Style)
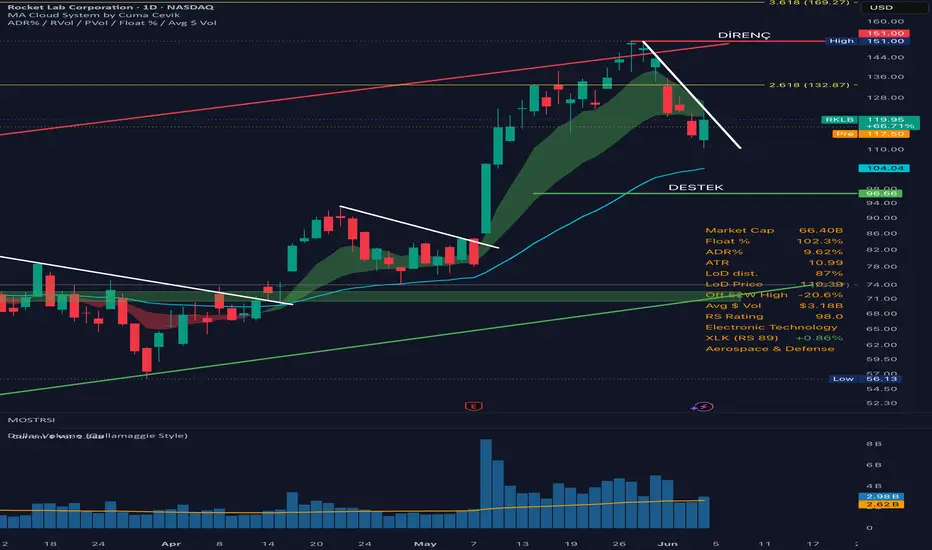
This indicator calculates the Dollar Volume (Close × Volume) instead of the standard lot volume, replicating the exact methodology used by momentum trader Kristjan Qullamaggie in TC2000 (C * V).
Standard volume only shows the number of shares traded, which treats a $2 penny stock and a $400 tech stock the same. Dollar Volume measures the actual liquidity and institutional cash flow flowing into the stock, making it an essential filter for detecting true Episodic Pivots (EP) and high-momentum breakouts.
Features:
Dollar Volume Bars: Shows the exact USD value traded per bar.
50-Period SMA: Replicates Qullamaggie's baseline (AVGCV50) to identify abnormal institutional volume spikes.
Clean Data Window UI: Automatically formats large numbers into easily readable Millions (M) or Billions (B) on your screen.
Fully Customizable: Easily change bar colors, transparency, and MA lines via the settings menu.
Standard volume only shows the number of shares traded, which treats a $2 penny stock and a $400 tech stock the same. Dollar Volume measures the actual liquidity and institutional cash flow flowing into the stock, making it an essential filter for detecting true Episodic Pivots (EP) and high-momentum breakouts.
Features:
Dollar Volume Bars: Shows the exact USD value traded per bar.
50-Period SMA: Replicates Qullamaggie's baseline (AVGCV50) to identify abnormal institutional volume spikes.
Clean Data Window UI: Automatically formats large numbers into easily readable Millions (M) or Billions (B) on your screen.
Fully Customizable: Easily change bar colors, transparency, and MA lines via the settings menu.
릴리즈 노트
Added an optional Up / Down volume color mode.To enable it, open Settings > Inputs > Color Settings and set Volume Color Mode to "Up / Down". Bars use green when close is greater than or equal to open, and red when close is below open. Up Volume Color and Down Volume Color can be customized separately.
Single color remains the default, preserving the original appearance. Dollar Volume (close x volume), the 50-period SMA, and the information table are unchanged.
The colors indicate price direction, not separate buy and sell volume.

Cuma Cevik
면책사항
해당 정보와 게시물은 금융, 투자, 트레이딩 또는 기타 유형의 조언이나 권장 사항으로 간주되지 않으며, 트레이딩뷰에서 제공하거나 보증하는 것이 아닙니다. 자세한 내용은 이용 약관을 참조하세요.
Cuma Cevik
면책사항
해당 정보와 게시물은 금융, 투자, 트레이딩 또는 기타 유형의 조언이나 권장 사항으로 간주되지 않으며, 트레이딩뷰에서 제공하거나 보증하는 것이 아닙니다. 자세한 내용은 이용 약관을 참조하세요.