OPEN-SOURCE SCRIPT
PMH / PML Each Day
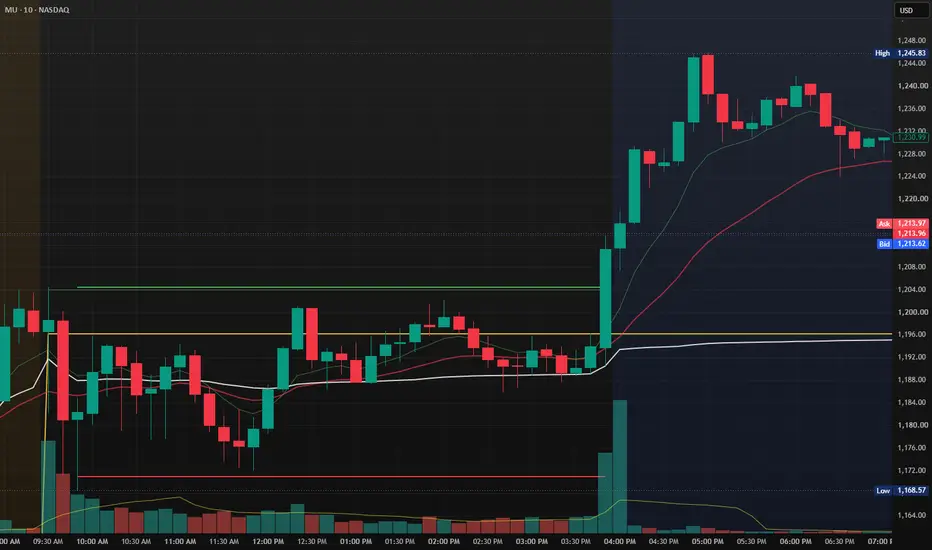
# PMH / PML Each Day Levels
This indicator automatically plots the **Previous Market High (PMH)** and **Previous Market Low (PML)** for every trading day using **Regular Trading Hours (RTH)** only.
### Features
* Plots the Previous Market High (PMH) and Previous Market Low (PML) for every trading session.
* Uses only **9:30 AM – 4:00 PM (Regular Market Hours)**.
* Draws historical PMH/PML levels for every day, making it ideal for backtesting.
* Each day's levels are displayed independently and do not overwrite previous sessions.
* Clean horizontal lines help identify important support and resistance levels.
* Works across all intraday timeframes.
* Perfect for price action, ORB, liquidity sweeps, and breakout/reversal strategies.
### Ideal For
* Intraday traders
* Opening Range Breakout (ORB) traders
* Support & Resistance analysis
* Historical chart review and backtesting
* Liquidity and market structure traders
This indicator provides a simple and reliable way to visualize the previous day's key market levels, allowing traders to quickly identify areas where price may react during the current trading session.
This indicator automatically plots the **Previous Market High (PMH)** and **Previous Market Low (PML)** for every trading day using **Regular Trading Hours (RTH)** only.
### Features
* Plots the Previous Market High (PMH) and Previous Market Low (PML) for every trading session.
* Uses only **9:30 AM – 4:00 PM (Regular Market Hours)**.
* Draws historical PMH/PML levels for every day, making it ideal for backtesting.
* Each day's levels are displayed independently and do not overwrite previous sessions.
* Clean horizontal lines help identify important support and resistance levels.
* Works across all intraday timeframes.
* Perfect for price action, ORB, liquidity sweeps, and breakout/reversal strategies.
### Ideal For
* Intraday traders
* Opening Range Breakout (ORB) traders
* Support & Resistance analysis
* Historical chart review and backtesting
* Liquidity and market structure traders
This indicator provides a simple and reliable way to visualize the previous day's key market levels, allowing traders to quickly identify areas where price may react during the current trading session.
오픈 소스 스크립트
트레이딩뷰의 진정한 정신에 따라, 이 스크립트의 작성자는 이를 오픈소스로 공개하여 트레이더들이 기능을 검토하고 검증할 수 있도록 했습니다. 작성자에게 찬사를 보냅니다! 이 코드는 무료로 사용할 수 있지만, 코드를 재게시하는 경우 하우스 룰이 적용된다는 점을 기억하세요.

면책사항
해당 정보와 게시물은 금융, 투자, 트레이딩 또는 기타 유형의 조언이나 권장 사항으로 간주되지 않으며, 트레이딩뷰에서 제공하거나 보증하는 것이 아닙니다. 자세한 내용은 이용 약관을 참조하세요.
오픈 소스 스크립트
트레이딩뷰의 진정한 정신에 따라, 이 스크립트의 작성자는 이를 오픈소스로 공개하여 트레이더들이 기능을 검토하고 검증할 수 있도록 했습니다. 작성자에게 찬사를 보냅니다! 이 코드는 무료로 사용할 수 있지만, 코드를 재게시하는 경우 하우스 룰이 적용된다는 점을 기억하세요.
면책사항
해당 정보와 게시물은 금융, 투자, 트레이딩 또는 기타 유형의 조언이나 권장 사항으로 간주되지 않으며, 트레이딩뷰에서 제공하거나 보증하는 것이 아닙니다. 자세한 내용은 이용 약관을 참조하세요.