RSI of Ratio
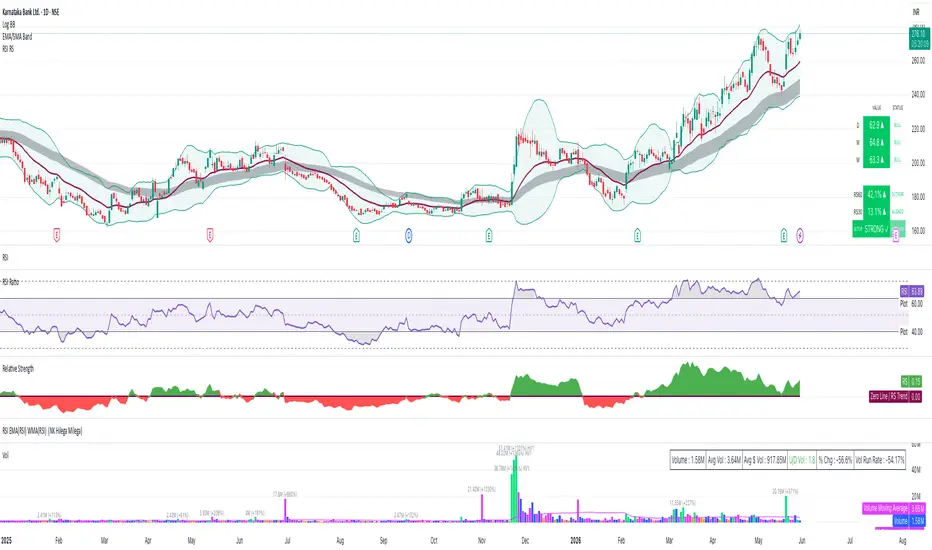
What it does:
Calculates RSI on the ratio of current symbol vs a user-selected compare symbol
(default: NSE:NIFTY). This shows whether the stock is strong or weak relative
to the index.
How to use:
- RSI above 60 → stock outperforming the index (gray dark fill)
- RSI 50–60 → mildly outperforming
- RSI 40–50 → mildly underperforming
- RSI below 40 → stock underperforming the index (gray dark fill)
Settings:
- RSI Length: default 30
- Compare Symbol: any TradingView symbol (Nifty, BTC, SPX, Gold etc)
- All levels adjustable: 70/60/50/40/30
Calculates RSI on the ratio of current symbol vs a user-selected compare symbol
(default: NSE:NIFTY). This shows whether the stock is strong or weak relative
to the index.
How to use:
- RSI above 60 → stock outperforming the index (gray dark fill)
- RSI 50–60 → mildly outperforming
- RSI 40–50 → mildly underperforming
- RSI below 40 → stock underperforming the index (gray dark fill)
Settings:
- RSI Length: default 30
- Compare Symbol: any TradingView symbol (Nifty, BTC, SPX, Gold etc)
- All levels adjustable: 70/60/50/40/30

면책사항
해당 정보와 게시물은 금융, 투자, 트레이딩 또는 기타 유형의 조언이나 권장 사항으로 간주되지 않으며, 트레이딩뷰에서 제공하거나 보증하는 것이 아닙니다. 자세한 내용은 이용 약관을 참조하세요.
면책사항
해당 정보와 게시물은 금융, 투자, 트레이딩 또는 기타 유형의 조언이나 권장 사항으로 간주되지 않으며, 트레이딩뷰에서 제공하거나 보증하는 것이 아닙니다. 자세한 내용은 이용 약관을 참조하세요.