Nadaraya-Watson Kernel Flow [NeBlok]
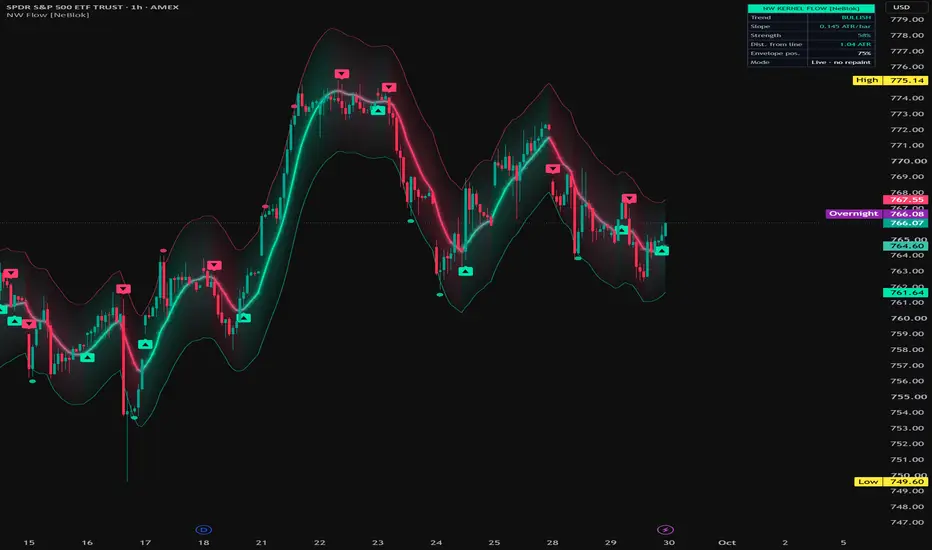
NADARAYA-WATSON KERNEL FLOW [NeBlok]
OVERVIEW
Nadaraya-Watson Kernel Flow is a non-repainting trend and envelope tool built on Nadaraya-Watson kernel regression, a statistical smoothing method from 1964. Instead of weighting bars equally (SMA) or by a fixed decay (EMA), a kernel assigns each past bar a weight based on its distance from the current bar using a chosen mathematical curve. The result is a smooth estimate of price with a shape you control.
This is an original implementation written from the underlying math. On top of the core estimator it adds four kernel types, a lag-compensation engine, a hysteresis trend filter, slope-strength coloring, envelope rejection signals, a live dashboard, and depth-style rendering.
WHAT REPAINTS AND WHAT DOES NOT
Many Nadaraya-Watson scripts show a curve that looks perfect on historical bars because each point is calculated using bars that came AFTER it. In real time, those turning points did not exist yet.
In this script:
- The kernel line, envelope, trend state, signals, alerts and dashboard are NON-REPAINTING. Every value uses only the current bar and bars before it.
- Signals are confirmed on bar close. A signal that prints on a closed bar stays there.
- The optional Hindsight Curve (off by default) DOES repaint. It is drawn as a dotted purple line labeled "HINDSIGHT · REPAINTS" and is for visual context only. No signal or alert is generated from it. Do not trade its turning points.
Because the live line only uses past data, it will lag more than a repainting curve. That trade-off is intentional. Lag Compensation (below) is provided to reduce it.
HOW IT WORKS
1. Kernel estimate: each of the last N bars is weighted by the selected kernel based on its distance from the current bar, and the weighted average becomes the kernel line.
2. Lag compensation: the kernel is run a second time on its own output, and the difference between the two passes is added back (similar in concept to how DEMA reduces lag). This speeds up turns at the cost of some overshoot.
3. Envelope: bands are placed above and below the line using either the average distance of price from the kernel line (Kernel MAE) or ATR, multiplied by your chosen width.
4. Trend state: the slope of the kernel line is measured in ATRs per bar. The trend only flips when the slope exceeds your threshold in the new direction. This hysteresis filter reduces back-and-forth flips when the line goes flat.
READING THE CHART
- Kernel line color: teal = bullish, pink = bearish. The line fades toward grey as the slope flattens, so a dimming line means the trend is losing strength before it flips.
- Neon Tube style: the envelope is shaded brightest at the kernel line and fades toward the band edges.
- Ribbon style: a ribbon is filled between the kernel line and a lagged copy of itself. Ribbon thickness reflects momentum, and the ribbon twists when direction changes.
- Minimal style: plain line and bands.
- ▲ / ▼ labels: trend flip signals (bar-close confirmed).
- Small circles: envelope rejections. Price closed outside the envelope, then closed back inside on the next bar.
DASHBOARD
- Trend: current trend state (Bullish / Bearish / Neutral).
- Slope: kernel slope in ATRs per bar.
- Strength: slope as a percentage of the "full color" slope setting.
- Dist. from line: how far price is from the kernel line, in ATRs.
- Envelope pos.: where price sits inside the envelope. 0% = lower band, 100% = upper band. Above 80% is colored bearish, below 20% bullish, to flag stretched conditions.
- Mode: confirms whether you're viewing live values only or live plus the repainting Hindsight Curve.
HOW TO USE IT
Trend following:
- Use the kernel line color and trend state as directional bias. Look for longs while bullish, shorts while bearish.
- A flip signal marks a change in bias, not an automatic entry. Many traders wait for a pullback toward the kernel line in the new direction.
- A fading (greying) line during an established trend is an early warning that momentum is stalling.
Mean reversion:
- Envelope rejections show where price stretched beyond its typical distance from the kernel line and then snapped back inside.
- Rejections in the direction of the trend (a bullish rejection off the lower band while the trend is bullish) are generally higher-context than rejections against it.
- Envelope pos. above 80% or below 20% indicates price is stretched relative to recent behavior.
Combining:
- The kernel line works well as a bias filter for other entry tools. Only take signals from your system that agree with the kernel trend.
- Dist. from line helps avoid chasing. Entries several ATRs away from the line carry more reversion risk.
SETTINGS GUIDE
Kernel Engine
- Kernel: Gaussian (smooth, classic), Rational Quadratic (fatter tails, more weight on older bars), Epanechnikov (statistically efficient, hard cutoff at 3× bandwidth), Laplace (sharpest and most responsive, also noisiest).
- Bandwidth (h): how many bars the kernel looks across. Higher = smoother and slower.
- RQ Alpha: Rational Quadratic only. Lower values = fatter tails.
- Lookback Window: maximum bars included per estimate.
- Lag Compensation: 0 = pure Nadaraya-Watson, 1 = maximum lag reduction with more overshoot. Default 0.5.
Envelope
- Width Source: Kernel MAE or ATR.
- Width Length / Width Multiplier: how the band width is averaged and scaled.
Signals
- Min Slope to Flip: the hysteresis threshold in ATRs per bar. Raise it to reduce flips in choppy markets; set to 0 to flip on any slope change.
- ATR Length: used for slope normalization, the dashboard, and ATR envelope mode.
Visuals
- Render Style, colors, slope needed for full color intensity, ribbon depth, and optional trend-colored candles.
Suggested starting points (not optimized — test on your own market and timeframe):
- Intraday futures (1–5 min): Bandwidth 6–10, Min Slope to Flip 0.02–0.04.
- Swing (1H–Daily): Bandwidth 8–14, Width Multiplier 2.5–3.0.
ALERTS
Two ways to set alerts:
1. Create one alert and choose "Any alert() function call" to receive all four events (bull flip, bear flip, bull rejection, bear rejection) with ticker, timeframe and price in the message.
2. Or choose individual conditions (Bull Flip, Bear Flip, Bull Envelope Rejection, Bear Envelope Rejection) to receive only the events you want.
Use one method or the other, not both, to avoid duplicate notifications. All alerts fire once per bar close.
LIMITATIONS
- Kernel regression is a smoothing method. It describes what price has done; it does not predict what price will do.
- The live line lags turning points. Lag Compensation reduces this but also introduces overshoot.
- In tight, sideways markets, flips and rejections become less reliable. Raise Min Slope to Flip or use a higher timeframe for context.
- Very high Lookback and Hindsight settings increase calculation load and may slow the script on long histories.
DISCLAIMER
This script is provided free for educational and informational purposes only. It is not financial advice, investment advice, or a recommendation to buy or sell any security, futures contract, or other financial instrument. Trading involves substantial risk of loss and is not suitable for every investor. Past performance, whether actual or indicated by historical signals, does not guarantee future results. Signals shown on historical bars do not account for slippage, commissions, or execution conditions. You are solely responsible for your own trading decisions. Always do your own research and consider consulting a licensed financial professional before trading.
OVERVIEW
Nadaraya-Watson Kernel Flow is a non-repainting trend and envelope tool built on Nadaraya-Watson kernel regression, a statistical smoothing method from 1964. Instead of weighting bars equally (SMA) or by a fixed decay (EMA), a kernel assigns each past bar a weight based on its distance from the current bar using a chosen mathematical curve. The result is a smooth estimate of price with a shape you control.
This is an original implementation written from the underlying math. On top of the core estimator it adds four kernel types, a lag-compensation engine, a hysteresis trend filter, slope-strength coloring, envelope rejection signals, a live dashboard, and depth-style rendering.
WHAT REPAINTS AND WHAT DOES NOT
Many Nadaraya-Watson scripts show a curve that looks perfect on historical bars because each point is calculated using bars that came AFTER it. In real time, those turning points did not exist yet.
In this script:
- The kernel line, envelope, trend state, signals, alerts and dashboard are NON-REPAINTING. Every value uses only the current bar and bars before it.
- Signals are confirmed on bar close. A signal that prints on a closed bar stays there.
- The optional Hindsight Curve (off by default) DOES repaint. It is drawn as a dotted purple line labeled "HINDSIGHT · REPAINTS" and is for visual context only. No signal or alert is generated from it. Do not trade its turning points.
Because the live line only uses past data, it will lag more than a repainting curve. That trade-off is intentional. Lag Compensation (below) is provided to reduce it.
HOW IT WORKS
1. Kernel estimate: each of the last N bars is weighted by the selected kernel based on its distance from the current bar, and the weighted average becomes the kernel line.
2. Lag compensation: the kernel is run a second time on its own output, and the difference between the two passes is added back (similar in concept to how DEMA reduces lag). This speeds up turns at the cost of some overshoot.
3. Envelope: bands are placed above and below the line using either the average distance of price from the kernel line (Kernel MAE) or ATR, multiplied by your chosen width.
4. Trend state: the slope of the kernel line is measured in ATRs per bar. The trend only flips when the slope exceeds your threshold in the new direction. This hysteresis filter reduces back-and-forth flips when the line goes flat.
READING THE CHART
- Kernel line color: teal = bullish, pink = bearish. The line fades toward grey as the slope flattens, so a dimming line means the trend is losing strength before it flips.
- Neon Tube style: the envelope is shaded brightest at the kernel line and fades toward the band edges.
- Ribbon style: a ribbon is filled between the kernel line and a lagged copy of itself. Ribbon thickness reflects momentum, and the ribbon twists when direction changes.
- Minimal style: plain line and bands.
- ▲ / ▼ labels: trend flip signals (bar-close confirmed).
- Small circles: envelope rejections. Price closed outside the envelope, then closed back inside on the next bar.
DASHBOARD
- Trend: current trend state (Bullish / Bearish / Neutral).
- Slope: kernel slope in ATRs per bar.
- Strength: slope as a percentage of the "full color" slope setting.
- Dist. from line: how far price is from the kernel line, in ATRs.
- Envelope pos.: where price sits inside the envelope. 0% = lower band, 100% = upper band. Above 80% is colored bearish, below 20% bullish, to flag stretched conditions.
- Mode: confirms whether you're viewing live values only or live plus the repainting Hindsight Curve.
HOW TO USE IT
Trend following:
- Use the kernel line color and trend state as directional bias. Look for longs while bullish, shorts while bearish.
- A flip signal marks a change in bias, not an automatic entry. Many traders wait for a pullback toward the kernel line in the new direction.
- A fading (greying) line during an established trend is an early warning that momentum is stalling.
Mean reversion:
- Envelope rejections show where price stretched beyond its typical distance from the kernel line and then snapped back inside.
- Rejections in the direction of the trend (a bullish rejection off the lower band while the trend is bullish) are generally higher-context than rejections against it.
- Envelope pos. above 80% or below 20% indicates price is stretched relative to recent behavior.
Combining:
- The kernel line works well as a bias filter for other entry tools. Only take signals from your system that agree with the kernel trend.
- Dist. from line helps avoid chasing. Entries several ATRs away from the line carry more reversion risk.
SETTINGS GUIDE
Kernel Engine
- Kernel: Gaussian (smooth, classic), Rational Quadratic (fatter tails, more weight on older bars), Epanechnikov (statistically efficient, hard cutoff at 3× bandwidth), Laplace (sharpest and most responsive, also noisiest).
- Bandwidth (h): how many bars the kernel looks across. Higher = smoother and slower.
- RQ Alpha: Rational Quadratic only. Lower values = fatter tails.
- Lookback Window: maximum bars included per estimate.
- Lag Compensation: 0 = pure Nadaraya-Watson, 1 = maximum lag reduction with more overshoot. Default 0.5.
Envelope
- Width Source: Kernel MAE or ATR.
- Width Length / Width Multiplier: how the band width is averaged and scaled.
Signals
- Min Slope to Flip: the hysteresis threshold in ATRs per bar. Raise it to reduce flips in choppy markets; set to 0 to flip on any slope change.
- ATR Length: used for slope normalization, the dashboard, and ATR envelope mode.
Visuals
- Render Style, colors, slope needed for full color intensity, ribbon depth, and optional trend-colored candles.
Suggested starting points (not optimized — test on your own market and timeframe):
- Intraday futures (1–5 min): Bandwidth 6–10, Min Slope to Flip 0.02–0.04.
- Swing (1H–Daily): Bandwidth 8–14, Width Multiplier 2.5–3.0.
ALERTS
Two ways to set alerts:
1. Create one alert and choose "Any alert() function call" to receive all four events (bull flip, bear flip, bull rejection, bear rejection) with ticker, timeframe and price in the message.
2. Or choose individual conditions (Bull Flip, Bear Flip, Bull Envelope Rejection, Bear Envelope Rejection) to receive only the events you want.
Use one method or the other, not both, to avoid duplicate notifications. All alerts fire once per bar close.
LIMITATIONS
- Kernel regression is a smoothing method. It describes what price has done; it does not predict what price will do.
- The live line lags turning points. Lag Compensation reduces this but also introduces overshoot.
- In tight, sideways markets, flips and rejections become less reliable. Raise Min Slope to Flip or use a higher timeframe for context.
- Very high Lookback and Hindsight settings increase calculation load and may slow the script on long histories.
DISCLAIMER
This script is provided free for educational and informational purposes only. It is not financial advice, investment advice, or a recommendation to buy or sell any security, futures contract, or other financial instrument. Trading involves substantial risk of loss and is not suitable for every investor. Past performance, whether actual or indicated by historical signals, does not guarantee future results. Signals shown on historical bars do not account for slippage, commissions, or execution conditions. You are solely responsible for your own trading decisions. Always do your own research and consider consulting a licensed financial professional before trading.

면책사항
해당 정보와 게시물은 금융, 투자, 트레이딩 또는 기타 유형의 조언이나 권장 사항으로 간주되지 않으며, 트레이딩뷰에서 제공하거나 보증하는 것이 아닙니다. 자세한 내용은 이용 약관을 참조하세요.
면책사항
해당 정보와 게시물은 금융, 투자, 트레이딩 또는 기타 유형의 조언이나 권장 사항으로 간주되지 않으며, 트레이딩뷰에서 제공하거나 보증하는 것이 아닙니다. 자세한 내용은 이용 약관을 참조하세요.