업데이트됨
SNP420/INDI/support_resist_future_level
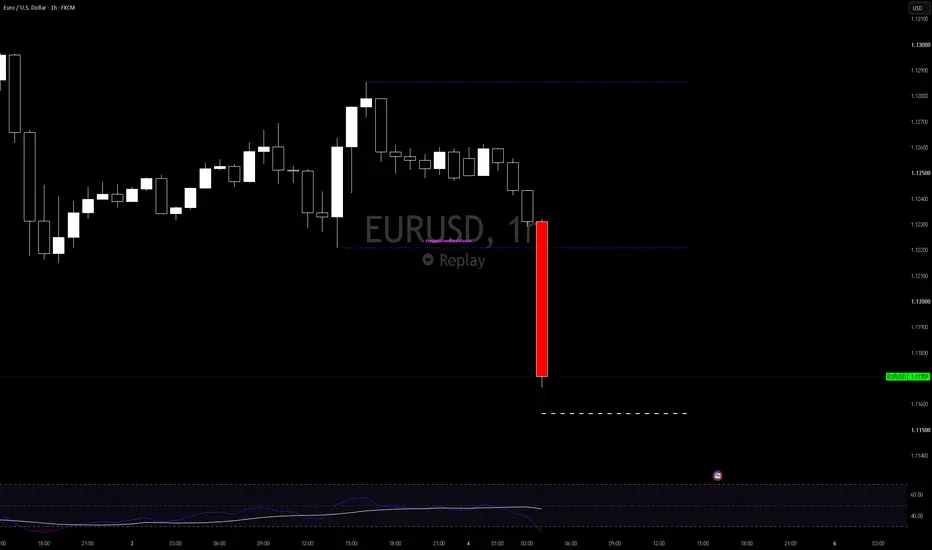
Functionality – short description
The indicator automatically detects the latest pivot highs/lows and builds the current resistance and support levels from them. New levels start as candidate levels (dotted lines).
Using an ATR-based tolerance, it counts how many times price precisely tests and rejects the level (touch + reversal).
Once the minimum number of touches is reached, the level is marked as validated (solid line). The indicator also detects breakouts of S/R, colors breakout candles, projects a target level after the breakout, and highlights retests of the broken levels with boxes.
autor: SNP_420
project: FNXS
ps: Piece a love
릴리즈 노트
Support Resist (SAR)What it does
SAR draws the latest support and resistance level, shows whether each level has been confirmed by price, and marks breakouts, a measured-move projection and retests of the broken level. Here SAR stands for Support And Resistance. It is not related to the Parabolic SAR.
How it works
Resistance is a pivot high and support is a pivot low, found with Left Bars and Right Bars (10 each by default). A pivot is known only after Right Bars bars have closed, so a level appears 10 bars after the pivot and its line is drawn back to the pivot bar. Only the latest support and resistance are kept. When a new pivot forms, the old line, its touch count and its retest boxes are removed.
A new level is drawn dotted as a candidate. A touch of resistance is counted when the high of a bar comes within a tolerance of the level and the bar closes below it. Support works the same way with the low and a close above. The tolerance is ATR(14) x 0.3. A bar is not counted if the previous bar was already in the zone, so a cluster of bars counts as one touch. After 3 touches (Min touches) the line becomes solid.
When the close crosses above resistance or below support, the bar is colored, and an orange dashed line is drawn one range height (resistance minus support) above the broken resistance or below the broken support. This is a simple measured move, not a forecast. After the breakout, bars whose low (after a breakout up) or high (after a breakout down) comes back within 5% of the range height of the broken level are marked with a box as retests.
How to use it
Use it on any symbol and timeframe. Dotted lines are unconfirmed candidates, solid lines are levels where price has been rejected several times. The retest boxes help you see whether a broken level holds from the other side, for example a broken resistance acting as support. Larger pivot settings give fewer, stronger levels with more delay. Tolerance and Min touches control how strict the confirmation is.
Settings
Pivot: Left Bars, Right Bars. Visual: colors and line width. Validation: Min touches, ATR Length, Tolerance (ATR multiple).
Originality
This is my own code, built on the standard Pine Script pivot, ATR and crossover functions, with no code reused from other publications. Compared with basic pivot support and resistance, it counts only touches where price is rejected, merges consecutive touches into one, scales the touch zone with ATR, shows confirmation by the line style, and combines the breakout, measured move and retest of the same pair of levels while keeping only the current structure on the chart.
Limitations
Levels appear Right Bars bars after the pivot and the line is drawn back to it, so on history the line starts earlier than the level was known.
Signals on the bar that is still forming can change until the bar closes.
Only the latest support and resistance are shown. There is no history of past levels.
Breakouts are based only on the close, with no volume or follow-through filter, and are marked on candidate levels too. A confirmed level stays solid even after it is broken.
If the latest resistance ends up below the latest support in a fast move, the projection is not meaningful and no retests are drawn.
The 5% retest zone is fixed and cannot be changed in the settings.
Breakout bar colors override the candle colors. The script has no alerts.
Results depend on the timeframe and the data feed. The script shows levels calculated from past data, does not predict price and is not a trading signal on its own.

BOOST ME
6 in investing and 5 in traiding
Czechia
6 in investing and 5 in traiding
Czechia
면책사항
해당 정보와 게시물은 금융, 투자, 트레이딩 또는 기타 유형의 조언이나 권장 사항으로 간주되지 않으며, 트레이딩뷰에서 제공하거나 보증하는 것이 아닙니다. 자세한 내용은 이용 약관을 참조하세요.
BOOST ME
6 in investing and 5 in traiding
Czechia
6 in investing and 5 in traiding
Czechia
면책사항
해당 정보와 게시물은 금융, 투자, 트레이딩 또는 기타 유형의 조언이나 권장 사항으로 간주되지 않으며, 트레이딩뷰에서 제공하거나 보증하는 것이 아닙니다. 자세한 내용은 이용 약관을 참조하세요.