Taught to Trade - Cost Hurdle
🔵 OVERVIEW
Costs are usually treated as a fee subtracted at the end. They are better understood as a hurdle: a distance price must travel before a trade is worth anything at all, in either direction.
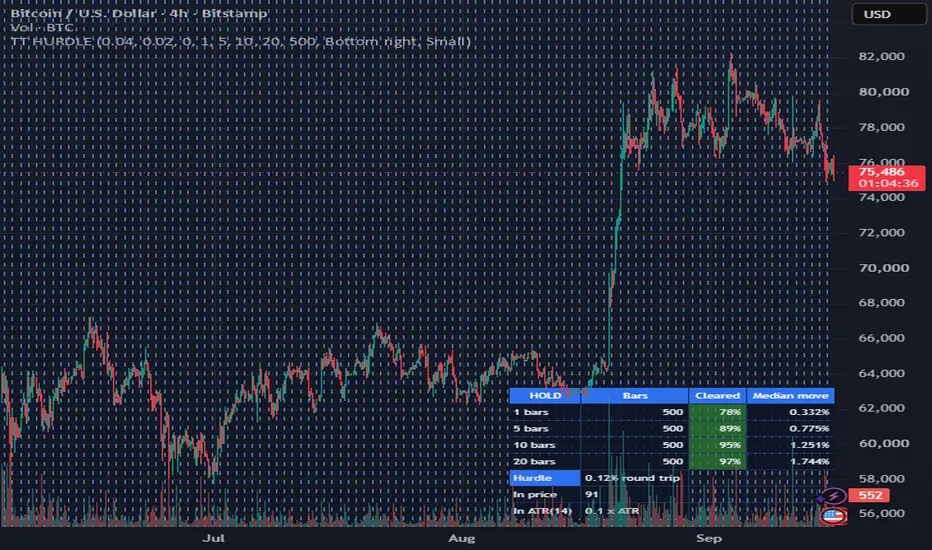
This measures how tall that hurdle is on the chart you are looking at — as a percentage, in price, and in ATR — and then reports how often this instrument has actually produced a move that size over the sample window, for four different holding periods.
Everything is computed from closed bars, looking backward only. Nothing repaints.
🔵 HOW THE HURDLE IS BUILT
Commission per side and slippage per side are both doubled, because a round trip pays each of them twice. An optional spread is added once. That total is the hurdle.
It is then expressed three ways. As a percentage, which is comparable across instruments. In price, which is what you actually see on the chart. And in ATR(14), which is the one worth paying attention to — it tells you what fraction of a typical bar's movement is consumed before you are level.
🔵 HOW TO READ THE TABLE
Each row is a holding period measured in bars. Bars is how many observations the window produced for that period.
Cleared is the share of those observations where price moved further than the hurdle, in absolute terms. It turns red below 50 percent, because at that point most of the moves this instrument produces over that holding period are smaller than what it costs you to participate in them.
Median move is the middle-sized absolute move over that period. Compare it directly with the hurdle. If the hurdle is close to the median, the typical trade is a coin flip against a fee.
🔵 WHAT THIS DOES NOT MEAN
Clearing the hurdle is not profit. It only means the move was big enough to have been worth trading — the direction still has to be right, and this measures absolute distance, so a move that cleared the hurdle downward counts exactly the same as one that cleared it upward.
A table that is entirely green does not mean a strategy will work here. It means costs are not the thing stopping it. That is a much smaller claim, and it is the only one this tool is entitled to make.
🔵 SETTINGS
Commission and slippage per side, plus an optional spread. Four holding periods, defaulting to 1, 5, 10 and 20 bars. Sample window length. Table position and text size.
Two alert conditions fire when a round trip costs more than half an ATR, and more than a full ATR. Neither fires on its own; you arm them in the alerts dialog. This script does not send buy or sell signals and never will.
🔵 WHERE IT FAILS
The cost inputs are yours, and the tool cannot verify them. Enter zero slippage and you will get a flattering table that means nothing. Zero slippage is the most common dishonest backtest setting there is, and this will not catch it for you.
It uses a single fixed cost figure. Real slippage is worse in fast markets and worse on larger size, which is exactly when it matters most. A constant understates the tail.
Absolute moves ignore direction entirely. Half of every number in the Cleared column came from moves that would have gone against you.
Close-to-close movement is not the path. A move that ends 1% away may have travelled 3% getting there and taken out a stop on the way. This says nothing about the route.
The median is a poor summary of a fat-tailed distribution. A large share of real trading outcomes live in the tails this column deliberately ignores.
The holding periods are fixed bar counts, not your actual holding times, and a strategy that exits on a condition rather than a bar count will not match any row here.
Percentage-based costs suit crypto and equities. Futures and forex price commissions per contract or per lot, and converting those into a percentage of notional is an approximation that gets worse at small position sizes.
Open source, so you can read every calculation instead of taking any of this on trust.
Educational tool only, not investment advice. It does not predict anything and does not generate signals. Trading involves substantial risk of loss.
Costs are usually treated as a fee subtracted at the end. They are better understood as a hurdle: a distance price must travel before a trade is worth anything at all, in either direction.
This measures how tall that hurdle is on the chart you are looking at — as a percentage, in price, and in ATR — and then reports how often this instrument has actually produced a move that size over the sample window, for four different holding periods.
Everything is computed from closed bars, looking backward only. Nothing repaints.
🔵 HOW THE HURDLE IS BUILT
Commission per side and slippage per side are both doubled, because a round trip pays each of them twice. An optional spread is added once. That total is the hurdle.
It is then expressed three ways. As a percentage, which is comparable across instruments. In price, which is what you actually see on the chart. And in ATR(14), which is the one worth paying attention to — it tells you what fraction of a typical bar's movement is consumed before you are level.
🔵 HOW TO READ THE TABLE
Each row is a holding period measured in bars. Bars is how many observations the window produced for that period.
Cleared is the share of those observations where price moved further than the hurdle, in absolute terms. It turns red below 50 percent, because at that point most of the moves this instrument produces over that holding period are smaller than what it costs you to participate in them.
Median move is the middle-sized absolute move over that period. Compare it directly with the hurdle. If the hurdle is close to the median, the typical trade is a coin flip against a fee.
🔵 WHAT THIS DOES NOT MEAN
Clearing the hurdle is not profit. It only means the move was big enough to have been worth trading — the direction still has to be right, and this measures absolute distance, so a move that cleared the hurdle downward counts exactly the same as one that cleared it upward.
A table that is entirely green does not mean a strategy will work here. It means costs are not the thing stopping it. That is a much smaller claim, and it is the only one this tool is entitled to make.
🔵 SETTINGS
Commission and slippage per side, plus an optional spread. Four holding periods, defaulting to 1, 5, 10 and 20 bars. Sample window length. Table position and text size.
Two alert conditions fire when a round trip costs more than half an ATR, and more than a full ATR. Neither fires on its own; you arm them in the alerts dialog. This script does not send buy or sell signals and never will.
🔵 WHERE IT FAILS
The cost inputs are yours, and the tool cannot verify them. Enter zero slippage and you will get a flattering table that means nothing. Zero slippage is the most common dishonest backtest setting there is, and this will not catch it for you.
It uses a single fixed cost figure. Real slippage is worse in fast markets and worse on larger size, which is exactly when it matters most. A constant understates the tail.
Absolute moves ignore direction entirely. Half of every number in the Cleared column came from moves that would have gone against you.
Close-to-close movement is not the path. A move that ends 1% away may have travelled 3% getting there and taken out a stop on the way. This says nothing about the route.
The median is a poor summary of a fat-tailed distribution. A large share of real trading outcomes live in the tails this column deliberately ignores.
The holding periods are fixed bar counts, not your actual holding times, and a strategy that exits on a condition rather than a bar count will not match any row here.
Percentage-based costs suit crypto and equities. Futures and forex price commissions per contract or per lot, and converting those into a percentage of notional is an approximation that gets worse at small position sizes.
Open source, so you can read every calculation instead of taking any of this on trust.
Educational tool only, not investment advice. It does not predict anything and does not generate signals. Trading involves substantial risk of loss.

Free Pine Script teardowns, a repaint checker and honest tools: taughttotrade.com (educational only, not financial advice)
면책사항
해당 정보와 게시물은 금융, 투자, 트레이딩 또는 기타 유형의 조언이나 권장 사항으로 간주되지 않으며, 트레이딩뷰에서 제공하거나 보증하는 것이 아닙니다. 자세한 내용은 이용 약관을 참조하세요.
Free Pine Script teardowns, a repaint checker and honest tools: taughttotrade.com (educational only, not financial advice)
면책사항
해당 정보와 게시물은 금융, 투자, 트레이딩 또는 기타 유형의 조언이나 권장 사항으로 간주되지 않으며, 트레이딩뷰에서 제공하거나 보증하는 것이 아닙니다. 자세한 내용은 이용 약관을 참조하세요.