OPEN-SOURCE SCRIPT
Volume Profile + LVN
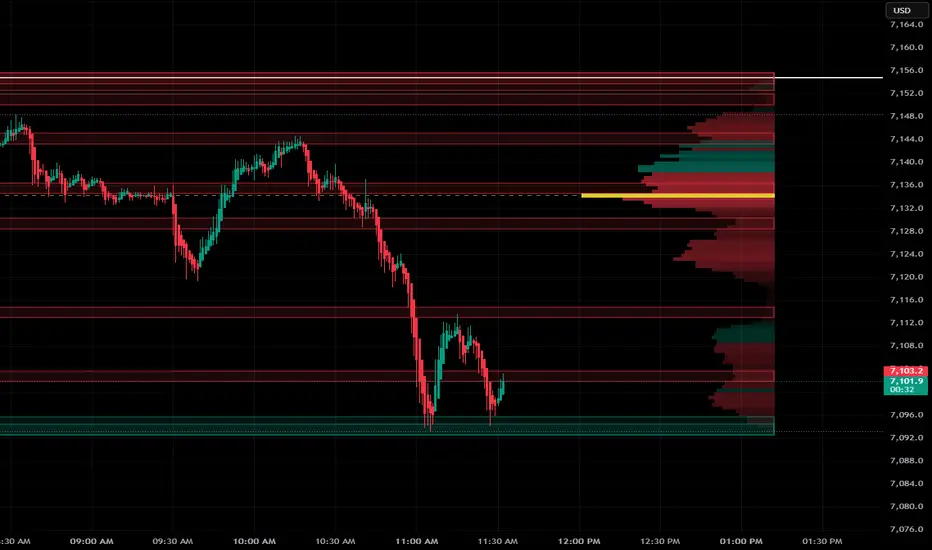
Volume Profile + Low Volume Nodes
A clean institutional-grade volume profile built for intraday traders. This indicator maps exactly where volume was traded across price levels during the session and automatically identifies the thin areas — the Low Volume Nodes — where price moves fast and institutions are likely to react.
What it does:
Volume Profile — displays a horizontal bar chart to the right of price showing how much volume traded at each price level. Green bars where buyers dominated, red bars where sellers dominated, yellow bar at the Point of Control — the single price level with the most volume traded.
Low Volume Nodes (LVN) — automatically detects the price zones where volume is significantly thinner than surrounding levels. These are the gaps in the market where price moved too fast for participants to trade much — creating imbalances that price tends to revisit and react to.
🟢 Green zones — LVN below current price = support. Price tends to bounce here or accelerate through on high volume.
🔴 Red zones — LVN above current price = resistance. Price tends to reject here or break through with momentum.
🟡 POC line — Point of Control extends left across the chart. The most important intraday reference level — price gravitates toward this level throughout the day.
How to use it:
When price approaches a green or red zone you have two scenarios — a bounce or a clean break.
Bounce — price touches the zone and closes back outside it. Look for a buy at green zones and a sell at red zones.
Break — price closes through the zone with volume. Trade the continuation in the direction of the break — buy above a broken red zone, sell below a broken green zone.
The thinner the zone the faster price will move through it. The POC acts as a magnet — if price is far from it expect it to get pulled back during the session.
Settings:
Profile Mode — Session resets each day for intraday use. Lookback uses a fixed bar count
Node Detection % — Controls how sensitive the LVN detection is. Higher finds more zones
Max LVN Nodes — Maximum number of zones shown — always displays the closest ones to current price
Zone Expand — Makes each zone slightly thicker to capture neighboring thin levels
Profile Offset — Controls the space between price and the profile
session mode - best for 1-5 minute timeframe
lookback mode - best for higher timeframe
A clean institutional-grade volume profile built for intraday traders. This indicator maps exactly where volume was traded across price levels during the session and automatically identifies the thin areas — the Low Volume Nodes — where price moves fast and institutions are likely to react.
What it does:
Volume Profile — displays a horizontal bar chart to the right of price showing how much volume traded at each price level. Green bars where buyers dominated, red bars where sellers dominated, yellow bar at the Point of Control — the single price level with the most volume traded.
Low Volume Nodes (LVN) — automatically detects the price zones where volume is significantly thinner than surrounding levels. These are the gaps in the market where price moved too fast for participants to trade much — creating imbalances that price tends to revisit and react to.
🟢 Green zones — LVN below current price = support. Price tends to bounce here or accelerate through on high volume.
🔴 Red zones — LVN above current price = resistance. Price tends to reject here or break through with momentum.
🟡 POC line — Point of Control extends left across the chart. The most important intraday reference level — price gravitates toward this level throughout the day.
How to use it:
When price approaches a green or red zone you have two scenarios — a bounce or a clean break.
Bounce — price touches the zone and closes back outside it. Look for a buy at green zones and a sell at red zones.
Break — price closes through the zone with volume. Trade the continuation in the direction of the break — buy above a broken red zone, sell below a broken green zone.
The thinner the zone the faster price will move through it. The POC acts as a magnet — if price is far from it expect it to get pulled back during the session.
Settings:
Profile Mode — Session resets each day for intraday use. Lookback uses a fixed bar count
Node Detection % — Controls how sensitive the LVN detection is. Higher finds more zones
Max LVN Nodes — Maximum number of zones shown — always displays the closest ones to current price
Zone Expand — Makes each zone slightly thicker to capture neighboring thin levels
Profile Offset — Controls the space between price and the profile
session mode - best for 1-5 minute timeframe
lookback mode - best for higher timeframe
오픈 소스 스크립트
트레이딩뷰의 진정한 정신에 따라, 이 스크립트의 작성자는 이를 오픈소스로 공개하여 트레이더들이 기능을 검토하고 검증할 수 있도록 했습니다. 작성자에게 찬사를 보냅니다! 이 코드는 무료로 사용할 수 있지만, 코드를 재게시하는 경우 하우스 룰이 적용된다는 점을 기억하세요.

면책사항
해당 정보와 게시물은 금융, 투자, 트레이딩 또는 기타 유형의 조언이나 권장 사항으로 간주되지 않으며, 트레이딩뷰에서 제공하거나 보증하는 것이 아닙니다. 자세한 내용은 이용 약관을 참조하세요.
오픈 소스 스크립트
트레이딩뷰의 진정한 정신에 따라, 이 스크립트의 작성자는 이를 오픈소스로 공개하여 트레이더들이 기능을 검토하고 검증할 수 있도록 했습니다. 작성자에게 찬사를 보냅니다! 이 코드는 무료로 사용할 수 있지만, 코드를 재게시하는 경우 하우스 룰이 적용된다는 점을 기억하세요.
면책사항
해당 정보와 게시물은 금융, 투자, 트레이딩 또는 기타 유형의 조언이나 권장 사항으로 간주되지 않으며, 트레이딩뷰에서 제공하거나 보증하는 것이 아닙니다. 자세한 내용은 이용 약관을 참조하세요.