OPEN-SOURCE SCRIPT
1MF Buy The Dip - Strategy
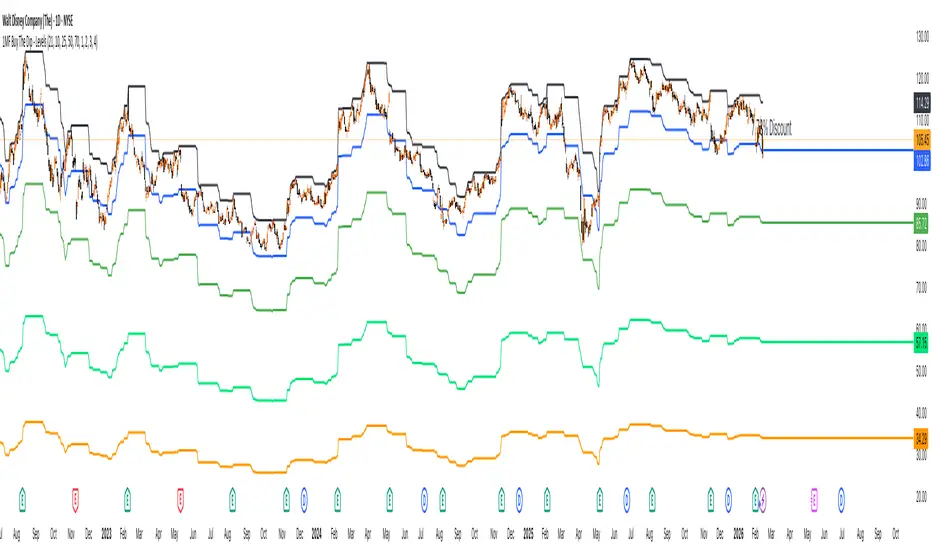
This is the indicator "1MF Buy The Dip - Levels" but made a strategy so you can backtest the usage on each levels.
There are 2 ways to enter:
BY QUANTITY
If Use Shares option is enabled, the amount of shares to open on each level will come from the values above. If it's disabled, then it will use whatever settings you did on the Properties Tab.
The strategy works the following way:
10% discount - a position is open, targeting the previous high
25% discount - another position is open to price average, targeting the same highs.
50% discount & %70% discount, other positions will be opened, targeting the same highs.
The volume of these positions will depend on the Shares Levels you defined (if Use Shares option is enabled), otherwise, on whatever settings you have setup on the Properties tab (percentage, amount, or shares itself).
It's a Buy the Dip and hold, so there's no stop loss as its expected to be an investing strategy instead of a trading strategy.
The look back bars amount is defaulted on 21, which represents 21 days on the daily timeframe (1-month = 30 days high), and from it will start calculating the discount down.
You can play with those numbers to see which one is the best efficient for each stock historically.
Any question, leave it below.
오픈 소스 스크립트
트레이딩뷰의 진정한 정신에 따라, 이 스크립트의 작성자는 이를 오픈소스로 공개하여 트레이더들이 기능을 검토하고 검증할 수 있도록 했습니다. 작성자에게 찬사를 보냅니다! 이 코드는 무료로 사용할 수 있지만, 코드를 재게시하는 경우 하우스 룰이 적용된다는 점을 기억하세요.

면책사항
해당 정보와 게시물은 금융, 투자, 트레이딩 또는 기타 유형의 조언이나 권장 사항으로 간주되지 않으며, 트레이딩뷰에서 제공하거나 보증하는 것이 아닙니다. 자세한 내용은 이용 약관을 참조하세요.
오픈 소스 스크립트
트레이딩뷰의 진정한 정신에 따라, 이 스크립트의 작성자는 이를 오픈소스로 공개하여 트레이더들이 기능을 검토하고 검증할 수 있도록 했습니다. 작성자에게 찬사를 보냅니다! 이 코드는 무료로 사용할 수 있지만, 코드를 재게시하는 경우 하우스 룰이 적용된다는 점을 기억하세요.
면책사항
해당 정보와 게시물은 금융, 투자, 트레이딩 또는 기타 유형의 조언이나 권장 사항으로 간주되지 않으며, 트레이딩뷰에서 제공하거나 보증하는 것이 아닙니다. 자세한 내용은 이용 약관을 참조하세요.