OPEN-SOURCE SCRIPT
SQVIGU Squeeze+ TSI Ghost
Description:
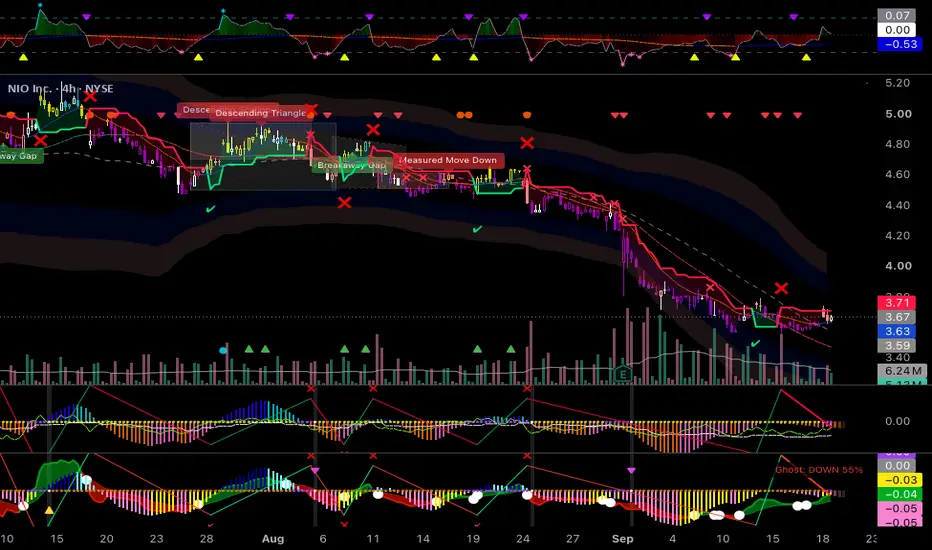
The SQVIGU Squeeze+ is an all-in-one momentum, trend, and projection indicator designed to keep your charts clean while delivering high-conviction signals. It upgrades the classic momentum squeeze by adding predictive "Ghost" projection bars, SuperTrend tracking, and a smooth, auto-scaling True Strength Index (TSI) Cloud Ribbon to confirm trend direction at a glance.
How to Use It:
The TSI Cloud Ribbon: The ribbon at the bottom of the indicator shows the broader trend. Light Blue means bullish momentum; Dark Blue means bearish. A bright White Dot appears exactly when the TSI crosses its signal line, indicating an optimal entry or momentum shift.
The Squeeze Dots (Zero Line): The dots on the zero line tell you when price is consolidating. Purple means the squeeze is building energy. White means the squeeze is firing (breakout). Yellow/Green means the squeeze is off.
Momentum Histogram & Ghost Bars: The classic red and green histogram shows current momentum. The slightly faded "Ghost" bars at the front project where momentum is heading 1 to 3 bars into the future based on linear regression.
SuperTrend Cloud & Zig-Zag: A Green (bullish) or Red (bearish) SuperTrend cloud will display on your main chart. Checkmarks (✔) indicate a confirmed trend cross, while Xs (❌) warn you of a likely false signal.
High-Probability Signals: Look for the tiny Yellow (Long) or Purple (Short) triangles on the top and bottom edges of the indicator pane. These only fire when a squeeze breakout perfectly aligns with a strong macro trend.
The SQVIGU Squeeze+ is an all-in-one momentum, trend, and projection indicator designed to keep your charts clean while delivering high-conviction signals. It upgrades the classic momentum squeeze by adding predictive "Ghost" projection bars, SuperTrend tracking, and a smooth, auto-scaling True Strength Index (TSI) Cloud Ribbon to confirm trend direction at a glance.
How to Use It:
The TSI Cloud Ribbon: The ribbon at the bottom of the indicator shows the broader trend. Light Blue means bullish momentum; Dark Blue means bearish. A bright White Dot appears exactly when the TSI crosses its signal line, indicating an optimal entry or momentum shift.
The Squeeze Dots (Zero Line): The dots on the zero line tell you when price is consolidating. Purple means the squeeze is building energy. White means the squeeze is firing (breakout). Yellow/Green means the squeeze is off.
Momentum Histogram & Ghost Bars: The classic red and green histogram shows current momentum. The slightly faded "Ghost" bars at the front project where momentum is heading 1 to 3 bars into the future based on linear regression.
SuperTrend Cloud & Zig-Zag: A Green (bullish) or Red (bearish) SuperTrend cloud will display on your main chart. Checkmarks (✔) indicate a confirmed trend cross, while Xs (❌) warn you of a likely false signal.
High-Probability Signals: Look for the tiny Yellow (Long) or Purple (Short) triangles on the top and bottom edges of the indicator pane. These only fire when a squeeze breakout perfectly aligns with a strong macro trend.
오픈 소스 스크립트
트레이딩뷰의 진정한 정신에 따라, 이 스크립트의 작성자는 이를 오픈소스로 공개하여 트레이더들이 기능을 검토하고 검증할 수 있도록 했습니다. 작성자에게 찬사를 보냅니다! 이 코드는 무료로 사용할 수 있지만, 코드를 재게시하는 경우 하우스 룰이 적용된다는 점을 기억하세요.

면책사항
해당 정보와 게시물은 금융, 투자, 트레이딩 또는 기타 유형의 조언이나 권장 사항으로 간주되지 않으며, 트레이딩뷰에서 제공하거나 보증하는 것이 아닙니다. 자세한 내용은 이용 약관을 참조하세요.
오픈 소스 스크립트
트레이딩뷰의 진정한 정신에 따라, 이 스크립트의 작성자는 이를 오픈소스로 공개하여 트레이더들이 기능을 검토하고 검증할 수 있도록 했습니다. 작성자에게 찬사를 보냅니다! 이 코드는 무료로 사용할 수 있지만, 코드를 재게시하는 경우 하우스 룰이 적용된다는 점을 기억하세요.
면책사항
해당 정보와 게시물은 금융, 투자, 트레이딩 또는 기타 유형의 조언이나 권장 사항으로 간주되지 않으며, 트레이딩뷰에서 제공하거나 보증하는 것이 아닙니다. 자세한 내용은 이용 약관을 참조하세요.