OPEN-SOURCE SCRIPT
Bitcoin 2Y-SMA Bands| Astral Vision
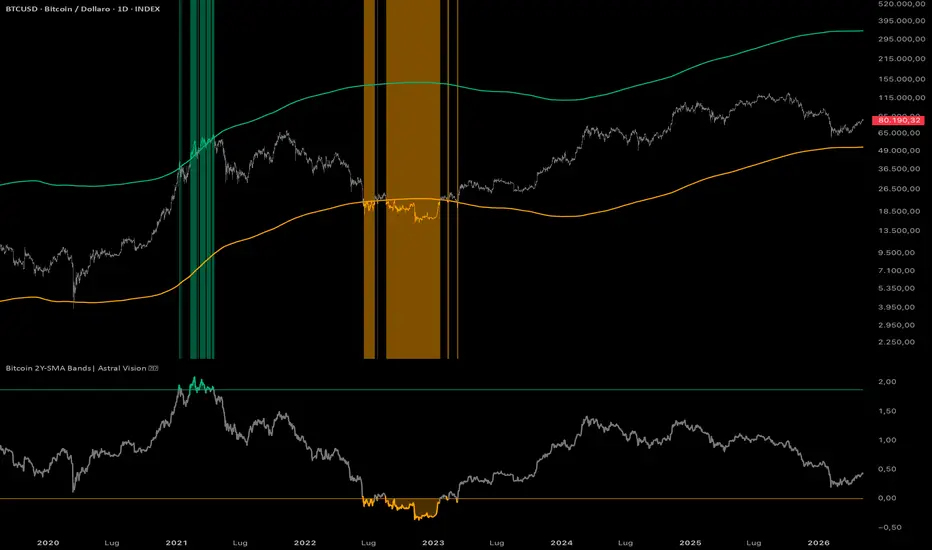
Bitcoin 2Y-SMA Bands | Astral Vision 🌠💠
The 2-year simple moving average spans a full halving epoch, filtering short and medium-term noise to expose Bitcoin's underlying long-term trend. This indicator builds a two-band valuation framework anchored to this baseline.
The bottom band scales the 2Y-SMA by a configurable multiplier (default 0.6), the level at which every major bear market has historically found its floor.
The top band scales from the bottom by a second multiplier (default 6.5), marking the ceiling of speculative excess beyond which price has rarely sustained.
The oscillator panel plots the log ratio of price to the bottom band, keeping both reference levels flat and proportionally scaled across all cycles regardless of Bitcoin's absolute price.
Calculation ⚙️
`Investor Bottom = SMA(close, 730) × bottom_multiplier`
`Investor Top = Investor Bottom × top_multiplier`
`Ratio = close / Investor Bottom`
`Oscillator = log(Ratio)` plotted against `log(1.0)` and `log(top_multiplier)`
Purpose 🎯
This indicator is a personal research tool designed to contextualize Bitcoin's price within a long-term valuation framework based on the 2-year simple moving average.
Disclaimer ⭕️
It is not financial advice, not an investment recommendation, and not affiliated with any financial institution, research firm, or organization of any kind. All content is provided for educational and informational purposes only. Always conduct your own research before making any financial decision.
Inputs 🎛️
- `Bottom Multiplier` scales the 2Y-SMA to define the accumulation floor (default 0.6)
- `Top Multiplier` scales the bottom band to define the distribution ceiling (default 6.5)
- `Plot Candle` toggles candle coloring on the price chart
- `Use Gradient Color` colors candles continuously by position within the valuation range rather than by binary threshold crossing
Colors 🎨
5 Astral Vision presets + custom override. Default: Hermes.
Plots 📊
- Investor bottom and top bands projected directly on the price chart
- Log ratio oscillator in the lower panel with fills at both extremes
- Background highlight when price breaches either band
- Candle coloring by active regime or continuous gradient
The 2-year simple moving average spans a full halving epoch, filtering short and medium-term noise to expose Bitcoin's underlying long-term trend. This indicator builds a two-band valuation framework anchored to this baseline.
The bottom band scales the 2Y-SMA by a configurable multiplier (default 0.6), the level at which every major bear market has historically found its floor.
The top band scales from the bottom by a second multiplier (default 6.5), marking the ceiling of speculative excess beyond which price has rarely sustained.
The oscillator panel plots the log ratio of price to the bottom band, keeping both reference levels flat and proportionally scaled across all cycles regardless of Bitcoin's absolute price.
Calculation ⚙️
`Investor Bottom = SMA(close, 730) × bottom_multiplier`
`Investor Top = Investor Bottom × top_multiplier`
`Ratio = close / Investor Bottom`
`Oscillator = log(Ratio)` plotted against `log(1.0)` and `log(top_multiplier)`
Purpose 🎯
This indicator is a personal research tool designed to contextualize Bitcoin's price within a long-term valuation framework based on the 2-year simple moving average.
Disclaimer ⭕️
It is not financial advice, not an investment recommendation, and not affiliated with any financial institution, research firm, or organization of any kind. All content is provided for educational and informational purposes only. Always conduct your own research before making any financial decision.
Inputs 🎛️
- `Bottom Multiplier` scales the 2Y-SMA to define the accumulation floor (default 0.6)
- `Top Multiplier` scales the bottom band to define the distribution ceiling (default 6.5)
- `Plot Candle` toggles candle coloring on the price chart
- `Use Gradient Color` colors candles continuously by position within the valuation range rather than by binary threshold crossing
Colors 🎨
5 Astral Vision presets + custom override. Default: Hermes.
Plots 📊
- Investor bottom and top bands projected directly on the price chart
- Log ratio oscillator in the lower panel with fills at both extremes
- Background highlight when price breaches either band
- Candle coloring by active regime or continuous gradient
오픈 소스 스크립트
트레이딩뷰의 진정한 정신에 따라, 이 스크립트의 작성자는 이를 오픈소스로 공개하여 트레이더들이 기능을 검토하고 검증할 수 있도록 했습니다. 작성자에게 찬사를 보냅니다! 이 코드는 무료로 사용할 수 있지만, 코드를 재게시하는 경우 하우스 룰이 적용된다는 점을 기억하세요.

My premium indicators are available on Whop:
whop.com/astralvision
Astral Vision 🌠💠
whop.com/astralvision
Astral Vision 🌠💠
면책사항
해당 정보와 게시물은 금융, 투자, 트레이딩 또는 기타 유형의 조언이나 권장 사항으로 간주되지 않으며, 트레이딩뷰에서 제공하거나 보증하는 것이 아닙니다. 자세한 내용은 이용 약관을 참조하세요.
오픈 소스 스크립트
트레이딩뷰의 진정한 정신에 따라, 이 스크립트의 작성자는 이를 오픈소스로 공개하여 트레이더들이 기능을 검토하고 검증할 수 있도록 했습니다. 작성자에게 찬사를 보냅니다! 이 코드는 무료로 사용할 수 있지만, 코드를 재게시하는 경우 하우스 룰이 적용된다는 점을 기억하세요.
My premium indicators are available on Whop:
whop.com/astralvision
Astral Vision 🌠💠
whop.com/astralvision
Astral Vision 🌠💠
면책사항
해당 정보와 게시물은 금융, 투자, 트레이딩 또는 기타 유형의 조언이나 권장 사항으로 간주되지 않으며, 트레이딩뷰에서 제공하거나 보증하는 것이 아닙니다. 자세한 내용은 이용 약관을 참조하세요.