OPEN-SOURCE SCRIPT
MAHQuant_IND_WeeklyDailyHL_v1.0
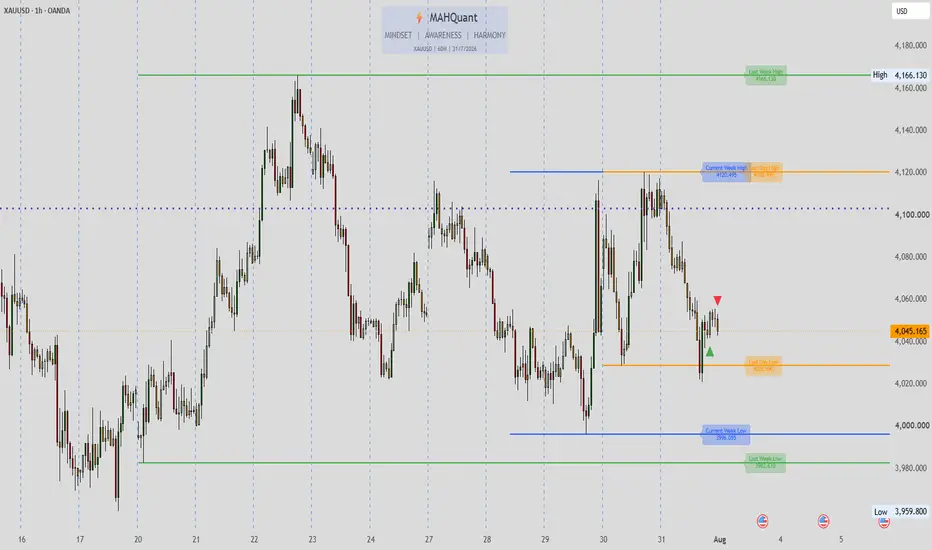
MAHQuant Weekly & Daily High-Low Levels
A professional price action indicator that automatically draws the previous week's and day's High/Low levels, as well as the current week's (Monday-Wednesday) range. It also includes a candle comparison feature to detect potential reversal signals.
🧠 HOW IT WORKS:
Weekly Levels (Previous Week):
• Retrieves the highest and lowest prices from the previous full trading week using request.security("W", ...)
• Draws horizontal lines at those levels
• Includes adjustable percentage offsets to create buffer zones
• Labels display the exact price value
Daily Levels (Previous Day):
• Retrieves the highest and lowest prices from the previous trading day using request.security("D", ...)
• Draws horizontal lines at those levels
• Includes adjustable percentage offsets
• Labels display the exact price value
Current Week Levels (Monday - Wednesday):
• Tracks the high and low from Monday, Tuesday, and Wednesday separately
• After Wednesday close, calculates the highest high and lowest low among these 3 days
• Draws a single range line for the entire current week
• Extends to the right for forward-looking reference
Candle Comparison Logic:
• Compares the current candle's wick size to the previous candle's wick size
• Identifies when the current candle is opposite in direction (e.g., red after green)
• Highlights when the current candle's wick is larger than the previous candle's wick
• This helps spot potential rejection or reversal patterns
Bar Coloring Logic:
• Green: Bullish candle with large body and high volume
• Light Green: Bullish candle with small body or low volume
• Red: Bearish candle with large body and high volume
• Orange: Bearish candle with small body or low volume
⚙️ HOW TO USE:
1. Set your broker's timezone in the "Timezone" input
2. Toggle Weekly/Daily/Current Week levels on/off
3. Adjust the offset percentages to create buffer zones
4. Enable "Candle Comparison" to spot rejection signals
⚠️ DISCLAIMER:
This script is for educational purposes only. Not financial advice. Past performance does not guarantee future results.
📌 VERSION: 1.0 | DEVELOPER: MAHQuant | UPDATED: August 2026
🙏 Special thanks to Mr. Amirreza Arya for his valuable educational insights that inspired this tool.
오픈 소스 스크립트
트레이딩뷰의 진정한 정신에 따라, 이 스크립트의 작성자는 이를 오픈소스로 공개하여 트레이더들이 기능을 검토하고 검증할 수 있도록 했습니다. 작성자에게 찬사를 보냅니다! 이 코드는 무료로 사용할 수 있지만, 코드를 재게시하는 경우 하우스 룰이 적용된다는 점을 기억하세요.

Telegram: t.me/MAHQuantTradingSystem
TikTok: tiktok.com/@mahquant?_r=1&_t=ZS-99XOUB9EXLw
TikTok: tiktok.com/@mahquant?_r=1&_t=ZS-99XOUB9EXLw
면책사항
해당 정보와 게시물은 금융, 투자, 트레이딩 또는 기타 유형의 조언이나 권장 사항으로 간주되지 않으며, 트레이딩뷰에서 제공하거나 보증하는 것이 아닙니다. 자세한 내용은 이용 약관을 참조하세요.
오픈 소스 스크립트
트레이딩뷰의 진정한 정신에 따라, 이 스크립트의 작성자는 이를 오픈소스로 공개하여 트레이더들이 기능을 검토하고 검증할 수 있도록 했습니다. 작성자에게 찬사를 보냅니다! 이 코드는 무료로 사용할 수 있지만, 코드를 재게시하는 경우 하우스 룰이 적용된다는 점을 기억하세요.
면책사항
해당 정보와 게시물은 금융, 투자, 트레이딩 또는 기타 유형의 조언이나 권장 사항으로 간주되지 않으며, 트레이딩뷰에서 제공하거나 보증하는 것이 아닙니다. 자세한 내용은 이용 약관을 참조하세요.