OPEN-SOURCE SCRIPT
Market Crash Barometer AB
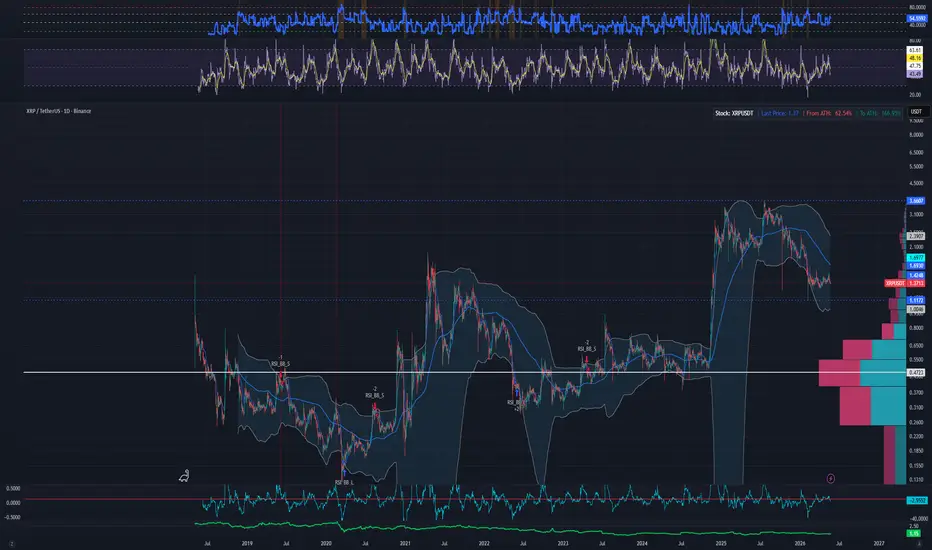
Market Crash Barometer by AB
The Market Crash Barometer is a multi-factor risk indicator designed to measure overall market stress and identify conditions that commonly appear before sharp market selloffs or panic events.
Instead of relying on a single signal, this indicator combines six key market factors into one unified Crash Score (0–100):
The combined score creates a real-time stress gauge that helps traders quickly assess whether markets are calm, weakening, or entering panic conditions.
Crash Score Zones
Background colors automatically highlight extreme risk environments:
Notes
This indicator is not intended to predict exact market tops or crashes. Instead, it acts as a probabilistic warning system by combining volatility, momentum, trend, and participation metrics into a single easy-to-read framework.
Works best when combined with price action and broader market analysis.
The Market Crash Barometer is a multi-factor risk indicator designed to measure overall market stress and identify conditions that commonly appear before sharp market selloffs or panic events.
Instead of relying on a single signal, this indicator combines six key market factors into one unified Crash Score (0–100):
- VIX Fear Index – Measures volatility and market fear
- Trend Strength – Detects when price trades below the 200-period moving average
- RSI Weakness – Identifies deteriorating momentum
- MACD Momentum – Confirms bearish momentum shifts
- Volume Expansion – Highlights abnormal trading activity
- ATR Volatility – Tracks rising market instability
The combined score creates a real-time stress gauge that helps traders quickly assess whether markets are calm, weakening, or entering panic conditions.
Crash Score Zones
- 0–25 → Normal Conditions
- 25–45 → Caution
- 45–65 → Stress
- 65–80 → Panic
- 80+ → Elevated Crash Risk
Background colors automatically highlight extreme risk environments:
- Orange = Panic conditions
- Red = Severe crash risk
- Best Uses
- Risk management
- Market regime detection
- Confirming bearish setups
- Identifying high-volatility environments
- Timing defensive positioning
Pine Script® Pine Script® Pine Script®
Notes
This indicator is not intended to predict exact market tops or crashes. Instead, it acts as a probabilistic warning system by combining volatility, momentum, trend, and participation metrics into a single easy-to-read framework.
Works best when combined with price action and broader market analysis.
오픈 소스 스크립트
트레이딩뷰의 진정한 정신에 따라, 이 스크립트의 작성자는 이를 오픈소스로 공개하여 트레이더들이 기능을 검토하고 검증할 수 있도록 했습니다. 작성자에게 찬사를 보냅니다! 이 코드는 무료로 사용할 수 있지만, 코드를 재게시하는 경우 하우스 룰이 적용된다는 점을 기억하세요.

면책사항
해당 정보와 게시물은 금융, 투자, 트레이딩 또는 기타 유형의 조언이나 권장 사항으로 간주되지 않으며, 트레이딩뷰에서 제공하거나 보증하는 것이 아닙니다. 자세한 내용은 이용 약관을 참조하세요.
오픈 소스 스크립트
트레이딩뷰의 진정한 정신에 따라, 이 스크립트의 작성자는 이를 오픈소스로 공개하여 트레이더들이 기능을 검토하고 검증할 수 있도록 했습니다. 작성자에게 찬사를 보냅니다! 이 코드는 무료로 사용할 수 있지만, 코드를 재게시하는 경우 하우스 룰이 적용된다는 점을 기억하세요.
면책사항
해당 정보와 게시물은 금융, 투자, 트레이딩 또는 기타 유형의 조언이나 권장 사항으로 간주되지 않으며, 트레이딩뷰에서 제공하거나 보증하는 것이 아닙니다. 자세한 내용은 이용 약관을 참조하세요.