지표

Moon VWAPMoon VWAP (MAVWAP) overlays anchored VWAP (AVWAP) segments that reset on calendar-based anchors you choose—primarily every New Moon (and optionally Full Moon), plus optional anchors for Mercury retrograde start, Venus retrograde start, Total Lunar Eclipse (TLE), Total Solar Eclipse (TSE), and a regime-flip anchor derived from your scripted eclipse rules.
What you get
Lunar markers: New Moon and Full Moon events (UTC), with styling options including August New Moon emphasis and optional ±day background tint around New Moons.
Retrograde context: Mercury (and optional Venus) retrograde start/end markers, optional in-span shading, optional shadow shading, and optional “open at Rx start” reference.
Eclipse markers: Total (and optional partial) lunar/solar eclipse marks.
Optional regime backdrop: Background tinting for a lunar-cycle vs solar-cycle interpretation (user-configurable rules in the inputs).
AVWAP suite: Separate toggles/colors for VWAP segments anchored to the events above—useful for tracking how price behaves from each anchor forward.
How to use
Pick which anchors matter for your process (most users start with New Moon AVWAP).
Choose marker style (emoji-only vs vertical lines) for a cleaner chart.
If something looks off vs your reference almanac, confirm the underlying UTC tables against your preferred astronomical source—this tool is for visual context, not a guarantee of timing precision on every feed.
Disclaimer: For education and research only. Not financial advice. Past performance does not guarantee future results. Astronomical/astrological cycle overlays are discretionary; verify critical dates independently. 지표

지표
전략

지표

Triple MACD PRO NASDAQ MTF CLEAN FLOW FINAL PROA minimalistic multi-timeframe MACD designed for high-speed markets like the NASDAQ.
This indicator focuses purely on momentum, flow, and structure – without visual clutter, signals, or distractions.
🔍 Concept
This tool combines three synchronized MACD layers:
M1 (Entry Engine) → fast momentum and execution timing
M5 (Flow) → short-term directional pressure
M15 (Structure) → higher timeframe bias
All components are normalized and enhanced with momentum acceleration to adapt to the speed of modern index markets.
🎯 Purpose
The indicator is built to:
Read real-time market flow
Identify high-probability continuation phases
Filter weak or low-quality moves
Provide a clean, distraction-free trading view
There are no signals, arrows, or background effects – only essential information.
🎨 Visualization
Histogram (M1) → momentum strength and acceleration
MACD/Signal Lines → structure and crossover context
MTF Fill (M5 & M15) → directional bias without clutter
Color logic:
Green → bullish pressure
Red → bearish pressure
Bright colors → increasing momentum
Darker tones → weakening momentum
Higher timeframe fills remain visible even when lines are hidden, providing continuous context.
📈 How to Use
Long Conditions:
M1 histogram turns and expands upward
M5 fill is bullish (green)
M15 supports or is neutral
Short Conditions:
M1 histogram turns and expands downward
M5 fill is bearish (red)
M15 confirms or aligns
⚠️ Important Notes
This is not a signal-based indicator
Designed for active decision-making and flow reading
Best used in trending or expanding markets
Avoid trading during flat or low-momentum conditions
🧠 Key Features
Multi-timeframe integration (M1 / M5 / M15)
Dynamic normalization (adapts to volatility)
Momentum acceleration (faster reaction than standard MACD)
Clean UI with optional HTF visibility
No repainting
💹 Best Markets
Highly optimized for:
NASDAQ (US100 / NQ) ⭐⭐⭐⭐⭐
Also suitable:
S&P 500 (ES / US500)
DAX (GER40)
Gold (XAUUSD)
Less effective for:
Low volatility Forex pairs
Sideways or illiquid markets
⏱️ Recommended Timeframes
M1 → Primary use (scalping / execution)
M5 → Flow confirmation
M15 → Structural bias
🚫 Not Designed For
Automated trading signals
Long-term investing
Range-bound strategies
Summary:
A high-performance, ultra-clean MACD framework built for traders who rely on structure, momentum, and flow – not signals. 지표

지표

SQZ Pro JS [MTF + ADX + Divergencias + Giros]El ecosistema definitivo del Squeeze Momentum. Basado en la estrategia clásica del Squeeze, este indicador ha sido reconstruido desde cero para traders exigentes que buscan precisión matemática y gráficos extremadamente limpios. Hemos eliminado el "ruido" y las señales falsas para centrarnos en lo que realmente importa: la fuerza de la tendencia, la alineación de temporalidades y las divergencias estructurales.
🎯 CARACTERÍSTICAS PRINCIPALES:
1. Motor de Divergencias PRO (Lógica de Olas)
Olvídate de las divergencias falsas causadas por pequeños baches en el precio. Este indicador utiliza un rastreador de "Olas" (Wave Tracker) que identifica el pico absoluto de la fuerza compradora/vendedora y lo compara estrictamente con la ola anterior.
Regla de Cero Estricta: Las divergencias alcistas solo se calculan en la zona roja (valles) y las bajistas en la zona verde (picos). Trazado limpio "de palo a palo".
2. Panel Dinámico Multi-Timeframe (MTF)
Un monitor lateral que te permite escanear el mercado desde 5 Minutos hasta Mensual. La tabla es inteligente: su tamaño se adapta dinámicamente según las temporalidades que actives.
Para cada temporalidad, el panel analiza simultáneamente:
La dirección del Squeeze.
La fuerza de la tendencia (Filtro ADX y cruces DI+/DI- integrados matemáticamente).
Eventos en tiempo real (Giros de color y cruces de la línea cero).
3. Señales Verticales de Precisión (Sin ensuciar el gráfico)
El indicador traza líneas verticales directamente en tu gráfico solo en la temporalidad en la que te encuentras, marcando los momentos críticos:
Giro Buy / Sell: Cuando el momentum cambia de dirección perdiendo fuerza.
Cruce 0 UP / DN: Cuando el momentum cruza la línea cero confirmando el cambio de bando.
Totalmente personalizables: Elige el grosor, color y estilo (línea sólida, punteada o discontinua) para adaptar el gráfico a tu estilo visual.
4. Estética "Clean Chart" (Cero distracciones)
Diseñado para no estorbar.
El Momentum se muestra en formato de columnas limpias (Verde oscuro para fuerza creciente, Rojo para fuerza decreciente).
Elementos secundarios como el ADX, las líneas DI o los puntos del Squeeze (dots) vienen ocultos de fábrica para mantener el gráfico puro, aunque su matemática sigue trabajando en segundo plano para la tabla MTF.
Las etiquetas molestas de la escala de precios han sido desactivadas por defecto.
💡 CÓMO UTILIZARLO:
El Panel (El Bosque): Utiliza la tabla MTF para confirmar que las temporalidades mayores (ej. Diario y 4H) están alineadas en la misma dirección (Fuerza + ADX).
El Histograma (El Árbol): Busca entradas en tu temporalidad operativa cuando el histograma confirme un "Giro" a favor de la tendencia mayor, o cuando detecte una Divergencia Pro confirmada.
⚙️ CONFIGURACIÓN DE FÁBRICA:
El indicador viene pre-configurado para operar "Out of the box" con colores intuitivos y sensibilidad profesional, pero ofrece control absoluto en sus ajustes para activar temporalidades menores (5m, 15m, 30m), mostrar las líneas del ADX o ajustar los periodos del canal de Keltner y las Bandas de Bollinger.
(Descargo de responsabilidad: Este indicador es una herramienta de análisis técnico y no constituye asesoramiento financiero. Úsalo en confluencia con tu propia gestión de riesgo). 지표

지표

지표

지표

지표

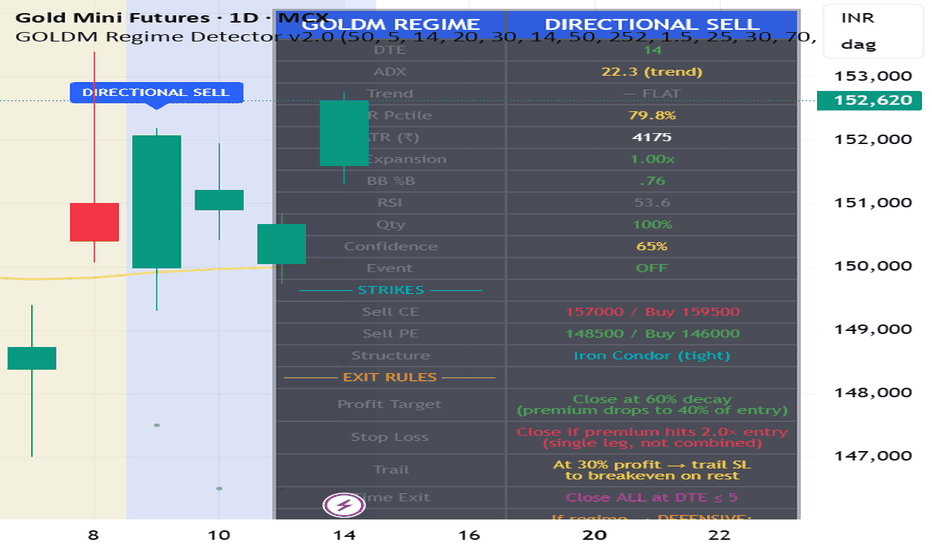
GOLDM Regime Detector v2.0
## **GOLDM Regime Detector v2.0**
**Institutional-Grade Options Selling Framework for MCX Gold Mini**
---
### **Overview**
GOLDM Regime Detector v2.0 is a **rule-based decision engine** built for systematic option sellers operating in **MCX Gold Mini (GOLDM)**.
Unlike traditional indicators that generate isolated signals, this framework continuously evaluates market structure and outputs a **complete trading stance** — covering **regime, structure, strike placement, position sizing, and exits**.
The objective is simple:
> **Trade the right structure, in the right environment, with controlled risk.**
---
### **Regime Architecture**
The model classifies market conditions into four execution states:
* **Regime 1 — Premium Selling (Full Size)**
Range-bound market with stable volatility
→ Deploy **Iron Condors / Strangles**
* **Regime 2 — Directional Selling (Full Size)**
Orderly trend with controlled volatility
→ Deploy **Credit Spreads aligned with trend**
* **Regime 3 — Reduced Exposure (Half Size)**
Suboptimal or uncertain conditions
→ Trade **wider strikes with reduced capital**
* **Regime 4 — Defensive Mode**
Volatility expansion or structural break
→ **No new exposure — manage or exit existing positions**
---
### **Model Construction**
The system integrates multiple dimensions of market behavior:
* **Trend** → EMA slope + ADX (direction + strength)
* **Volatility** → ATR percentile + expansion dynamics
* **Positioning** → Bollinger %B (range vs extremes)
* **Time Risk** → Days to Expiry (DTE constraints)
* **Event Risk** → Manual override for macro events
Each regime is triggered only when conditions align across these factors, ensuring **context-aware execution rather than reactive trading**.
---
### **Strike Engineering**
All strike levels are **systematically derived from ATR**, ensuring consistency across volatility regimes:
* Dynamic distance from spot based on regime quality
* Wider strikes in adverse conditions
* Rounded to **MCX-standard 500 intervals**
This removes discretionary bias from strike selection and aligns risk with market conditions.
---
### **Embedded Risk Framework**
The script includes a predefined exit structure:
* **Profit Capture** → 40–50% premium decay
* **Stop Loss** → Premium expansion threshold (2× entry)
* **Time Exit** → Forced closure near expiry
* **Regime Transition** → Automatic shift to defensive posture
* **Partial Management** → Profit lock-in with trailing logic
---
### **Execution Interface**
* Real-time **regime classification**
* **Suggested structure** (IC / spreads)
* **Strike levels plotted on chart**
* **Confidence score**
* **DTE and event warnings**
* Fully integrated **decision dashboard**
---
### **Usage Guidelines**
* Apply on **MCX:GOLDM1! or front-month futures**
* Optimized for **Daily timeframe**
* Execute systematically — **regime → structure → strikes → risk management**
* Designed for traders prioritizing **process over prediction**
---
### **Positioning**
This framework is built for traders who:
* Prefer **structured decision-making over discretionary trading**
* Want **consistency across market regimes**
* Understand that **edge comes from execution discipline, not prediction**
---
### **Disclaimer**
This tool provides a structured framework for decision-making.
Execution, risk management, and capital allocation remain the responsibility of the user.
---
지표
Supertrend ScalpingThis Pine Script indicator called “Supertrend Scalping” is designed for scalping strategies and is built around the Supertrend indicator, enhanced with a complete trade management system including multiple Take Profit (TP) levels and a dynamic Stop Loss (SL).
The script begins by calculating the ATR (Average True Range), which measures market volatility. The user can choose between the standard ATR (RMA) or a simple moving average version (SMA). This ATR is then used to construct the Supertrend bands by adding and subtracting a multiple of the ATR from a price source (by default, hl2). These bands adjust dynamically and define the trend: when price breaks above the upper band, the trend turns bullish; when it breaks below the lower band, the trend becomes bearish.
Trading signals are generated when the trend changes direction. A BUY (LONG) signal appears when the trend shifts from bearish to bullish, while a SELL (SHORT) signal appears when it shifts from bullish to bearish. At each new signal, the script initializes a virtual trade using the current closing price as the entry point.
The core strength of this script lies in its trade management system. It automatically calculates three Take Profit levels (TP1, TP2, TP3) and an initial Stop Loss, all based on configurable ATR multiples. These levels are displayed on the chart using colored lines and labels. The script then continuously monitors price action to detect when these levels are reached.
When a Take Profit level is hit, it is visually removed. If TP1 is reached, the Stop Loss can be moved to the entry price (break-even). If TP2 is reached, the Stop Loss is moved up to the TP1 level. This creates a smart trailing stop mechanism that progressively locks in profits. If either TP3 or the Stop Loss is hit, the trade is fully closed and all visual elements are cleared.
Additionally, the script updates label positions in real time so they follow the current bar, and it highlights the active trend with a colored background (green for bullish, red for bearish). It also includes alert conditions for entry signals as well as TP and SL hits.
In summary, this indicator goes beyond simple signal generation by offering a complete scalping framework, combining entry signals, structured profit targets, risk management, and volatility-based adaptability. 지표

전략

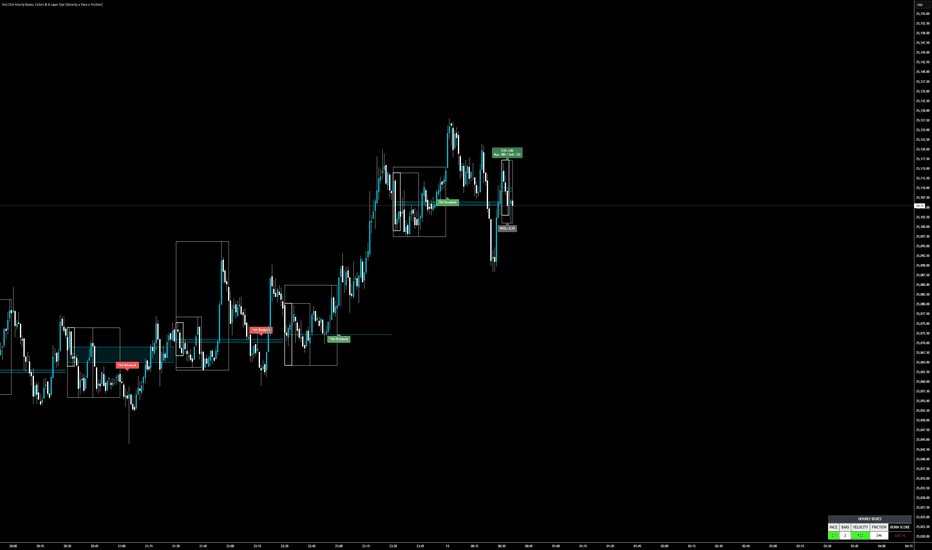
Hourly Structure Boxes & VolumeThis indicator merges micro-session market structure with a localized volume kinematics engine. By anchoring opening range boxes (5m, 15m, and 30m) to a strict hourly cycle, it allows traders to visualize initial balance boundaries while simultaneously measuring the order flow effort required to break out of them.
Core Logic & Mechanics
This script resolves the common issue of Cumulative Volume Delta (CVD) "drifting" over time by forcing it to reset at specific structural boundaries. The mashup of visual price boxes and volume data is justified because the volume calculations are strictly dependent on the structure for their anchor points.
Hourly Micro-Boxing: At the start of every hour, the script begins drawing three nested ranges: the first 5 minutes, 15 minutes, and 30 minutes. It calculates the midlines of the 5m and 15m ranges and highlights the space between them as a "Midline Zone," projecting it forward to the end of the hour as a critical area of structural gravity.
Dynamic CVD Resets: The CVD engine does not run continuously. It resets at the top of the hour, at the completion of each micro-box (5m, 15m, 30m), AND dynamically if the price touches the extended 5m or 15m midlines. This ensures the volume delta is always measuring the immediate push off a structural level.
3-Stage Breakout Engine: The script actively monitors the 15-minute box for a specific exhaustion-breakout pattern. It requires three stages to trigger a signal:
Stage 1: Price wicks or touches outside the 15m box boundary.
Stage 2: Price retreats back inside the 15m box.
Stage 3: A subsequent candle strictly closes outside the box. Only then does it print a "15m Breakout" label, filtering out standard liquidity sweeps.
Volume Kinematics Dashboard: The lower dashboard calculates proprietary metrics:
Pace: Total points moved divided by the bars elapsed since the last structure reset.
Velocity: CVD divided by bars elapsed.
Friction: Absolute Velocity / Absolute Pace. Measures absorption (how much volume is being burned for minimal point gain).
Burn Score: A localized exhaustion metric adjusted by an Auto-Session Divisor to normalize values between the main New York session and overnight trading.
How to Use It
Designed primarily for scalping volatile indices like the Nasdaq 100 on lower timeframes (1m to 5m), this tool provides actionable data for mean-reversion and breakout trading.
Trading the 15m Breakout: Wait for the 3-stage breakout label to print. Before entering, check the dashboard's "Velocity" and "Friction." If the breakout label prints with high Velocity and low Friction, it signals genuine momentum.
Midline Zone Bounces: If price enters the shaded cyan 5m-15m Midline Zone, watch for the CVD reset. If the reset immediately shows heavy opposing volume (a spike in Pace and Velocity in the opposite direction), the midline zone is defending successfully, offering a tight-risk entry back toward the hourly box extremes.
Friction Exhaustion: If price is pushing against the 30-minute box boundary but the dashboard shows extreme "Friction" and a high "Burn Score" (turning purple or red), the move is being absorbed by limit orders. This is a setup for a fade/reversal back to the midlines. 지표
지표
전략

지표

Stock Option Seller - Open Road
## 📌 Description — Open Road · Option Seller
**Open Road · Option Seller** is a structured decision-support indicator designed for **systematic option sellers** trading monthly credit spreads on large-cap Indian equities.
It converts price action, momentum, and volatility into a **clear, rules-based structure selection**:
* **Put Credit Spread**
* **Call Credit Spread**
* **Iron Condor**
* **Wait (no trade)**
The goal is simple:
Remove discretion and provide a **repeatable framework for directional and non-directional option selling**.
---
## ⚙️ Core Logic
The system is built on a **multi-factor scoring model**:
### 1. Trend Engine (3-factor scoring)
* EMA positioning (20/50)
* Short-term consistency (last 5 closes vs EMA)
* 21-day momentum
This produces a **Trend Score (-3 to +3)**:
* +3 → Strong Bullish
* -3 → Strong Bearish
* Between → Neutral / Lean bias
---
### 2. Market Condition Filters
* **RSI (14)**
* Identifies exhaustion and conflicts with trend
* **ADX (14)**
* Distinguishes trending vs range-bound environments
---
### 3. Structure Selection Logic
* **Low trend / extreme RSI → Iron Condor**
* **Trend + clean RSI + ADX confirmation → Directional spreads**
* **Conflict → No trade (WAIT)**
This ensures trades are taken only when **market structure is aligned**.
---
### 4. Strike & Risk Framework
* Uses **ATR-based wing sizing**
* Automatically rounds to practical strike intervals
* Provides **approximate strike suggestions** for:
* Short legs
* Hedge legs
---
## 📊 Visual Panels
The indicator includes 4 diagnostic panels:
1. **EMA Distance Panel**
→ Measures price positioning vs trend
2. **RSI Panel**
→ Highlights overbought / oversold regimes
3. **ADX Panel (+DI / -DI)**
→ Identifies trend strength and direction
4. **Trend Score Histogram**
→ Clean visual representation of directional bias
---
## 🧠 Signal Output
On the latest candle, the system displays a **decision panel** with:
* Trend classification
* Score (out of 3)
* RSI & ADX interpretation
* ATR + wing size
* Final structure recommendation
* Suggested strike levels
---
## 🎯 Designed For
* Monthly option sellers
* Systematic traders (rule-based execution)
* Traders who want to avoid discretionary bias
* Large-cap equity option strategies
Best suited for:
**RELIANCE, HDFCBANK, TCS, SBIN, AXISBANK (Daily timeframe)**
---
## ⚠️ Important Notes
* This is a **decision-support tool**, not a fully automated trading system
* Strike suggestions are **approximate** and should be validated with live option chain data
* Works best when combined with **risk management and position sizing discipline**
---
## 🧩 Philosophy
Most option sellers fail not because of strategy, but because of **inconsistent structure selection**.
Open Road enforces:
* When to sell directionally
* When to stay neutral
* When to not trade
That alone removes a large part of edge erosion.
지표

지표

전략

VCP Historical Score Histogram PM📊 VCP Historical Score Histogram
The VCP Historical Score Histogram is a specialized companion tool to the Pro Dashboard, designed to visualize the "silent" contraction of volatility over the history of a stock. While standard price action can look random, the VCP Score reveals the underlying institutional accumulation and the precise moments when a stock becomes "tight" enough to explode.
🔍 Why Use the Histogram?
VCP (Volatility Contraction Pattern) trading is all about timing. This indicator maps the multi-metric VCP Scoring Engine (0-100) across every bar on the chart, allowing you to identify Volatility Cyclicity.
By observing the score historically, you can:
Spot Accumulation: See the score gradually climbing from <30 to >70 as the "weak hands" are shaken out.
Verify Tightness: Historically correlate price consolidations with BBW (Bollinger Band Width) percentiles.
Detect Energy Buildup: High scores sustained over many weeks indicate a "coiled spring" setup.
🎨 Visual Intelligence
The histogram uses a sophisticated color-coding system to help you interpret the setup at a glance:
🔥 Emerald Green (70 - 100): High Conviction Zone. The stock is in a maximum contraction state with bullish trend alignment and high relative strength.
🟡 Gold (50 - 69): Watchlist Zone. Volatility is contracting, but the setup may need one more "t" (tightening) or a volume dry-up.
🔘 Slate Grey (< 50): Standard/Loose Action. The stock is either in a broad base or hasn't yet entered a high-probability VCP state.
⚡ Key Features
Peak Labeling: Automatically identifies and labels local score peaks, helping you find historical pivot highs where the setup was at its "tightest."
Squeeze Persistence: Features a built-in background highlight for TTM Squeeze states, allowing you to see how many bars the price has remained compressed before a move.
Benchmark Integration: Directly compares the symbol's momentum against a benchmark (like NIFTY 500) to ensure you are only trading the leaders of the market.
📉 Best Used With
This script is designed to be placed in a separate pane below the price chart. To complete the professional setup, use it alongside the VCP Pro Single Symbol Dashboard to have both deep-dive live metrics and historical trend visibility.
Methodology: Ported from Mayya Capital's quantitative VCP strategy research, focusing on Bollinger Band Width contraction, RVOL dry-ups, and 52-week high proximity.
"In the stock market, quiet action is often the precursor to loud gains." 지표