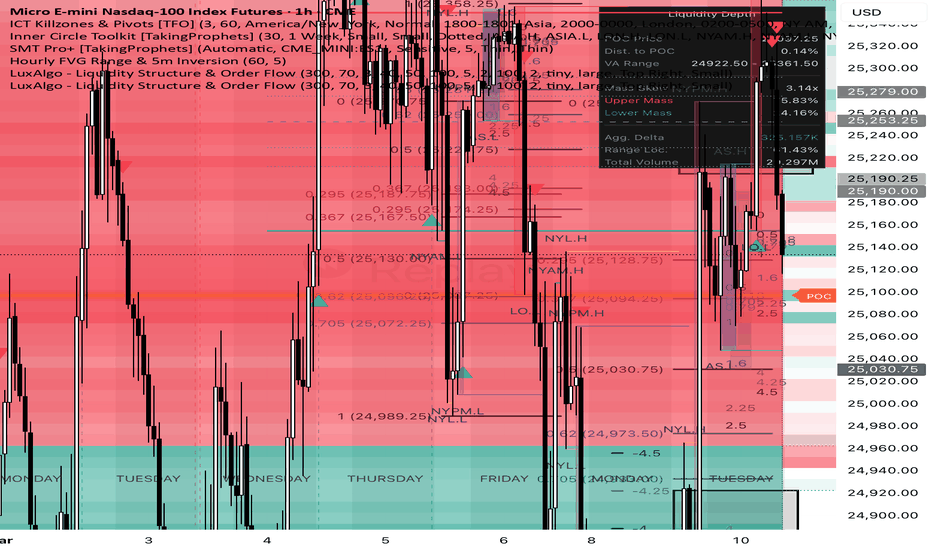
SYP Daily SweepTired of drawing the same horizontal lines every single day? Welcome to your new favorite automated setup.
We all know the market is just one big hunt for liquidity. This indicator is specifically designed to map out exactly where the "Smart Money" is looking, turning your chart into a literal roadmap for high-probability setups. Stop guessing, start printing! 🖨️💵✨
Here is what this all-in-one toolkit does for you automatically every day at UTC 00:00 (Daily Open):
🔥 CORE FEATURES
1. True FRVP POC (Point of Control) with Volume Data
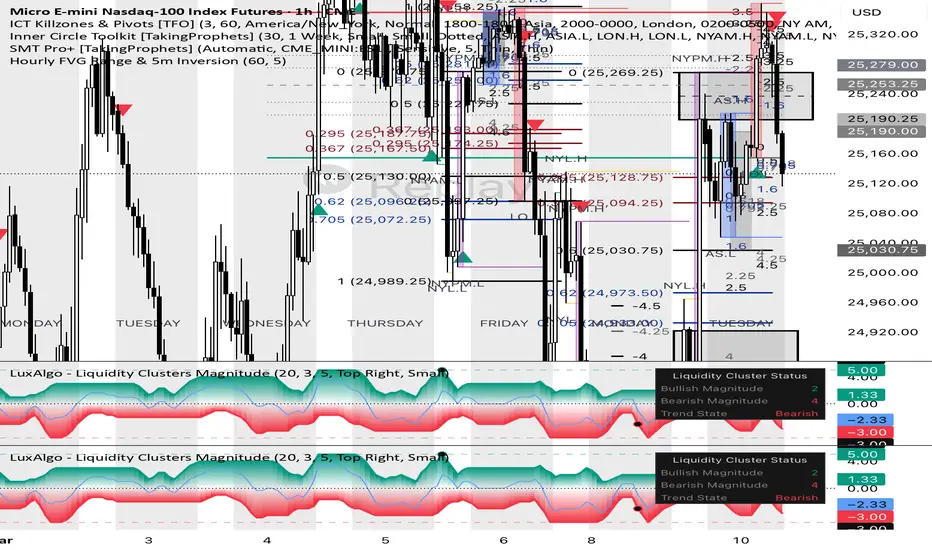
Forget basic close-price calculations. We built a custom Fixed Range Volume Profile (FRVP) engine that distributes the previous day's volume across the entire high-to-low range. It plots a crisp white line starting from yesterday's open directly to the current price action, showing you exactly where the heaviest volume was traded (Complete with the actual volume number label!). When price approaches this level, pay attention.
2. Automated PDH & PDL (Previous Daily High/Low)
Previous daily extremes are massive magnets for price. This script plots the PDH and PDL perfectly, starting right from the exact candle that formed them, giving you clean, distraction-free charts.
3. Liquidity Sweep Detection (The Secret Sauce 🧪)
Did yesterday's candle sweep the day before yesterday's high or low? If yes, the script automatically plots the "Bullish Sweep" or "Bearish Sweep" levels. These are prime locations to look for nasty traps and explosive reversals.
4. Major Trading Session Killzones
Asian, London, and New York sessions are beautifully highlighted with background boxes. Know exactly when the volatility is about to step into the market. (Fully customizable times and colors in the settings).
5. Daily Session Separators
Clean dashed vertical lines to separate your trading days visually.
💡 HOW TO USE THIS PRINTER:
Wait for London or NY session volume to kick in.
Look for price to interact with the PDH/PDL or our True POC.
Did we just hit a Liquidity Sweep level? Watch for a lower timeframe market structure shift or FVG.
Execute, manage your risk, take profit, and enjoy your day. 🍹
This indicator is built for day traders, scalpers, and SMC/ICT enthusiasts who want to keep their charts clean but insanely informative.
Drop a Boost 🚀 if this script helps you catch those easy setups! 지표

전략

지표

지표
지표

지표

지표

지표

지표

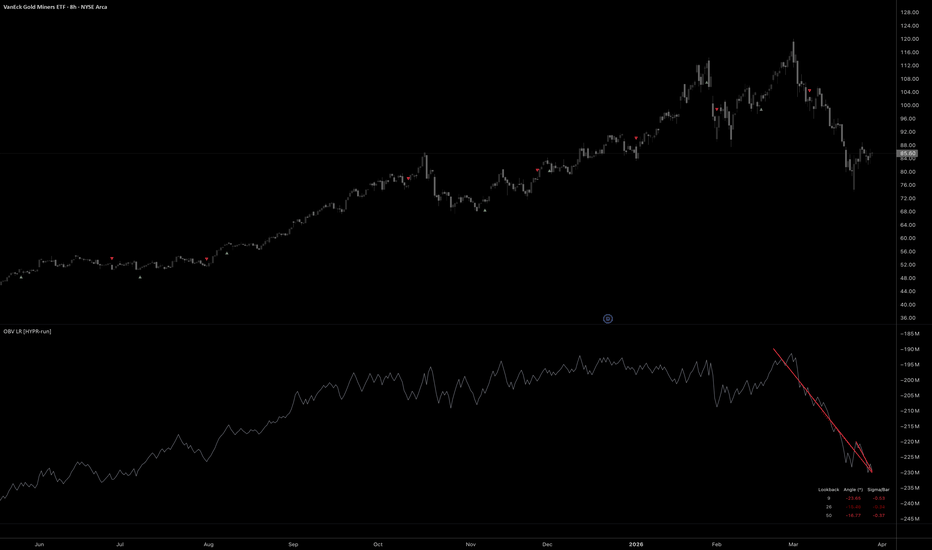
OBV Linear Regression Multi-Slope [HYPR-run]DESCRIPTION:
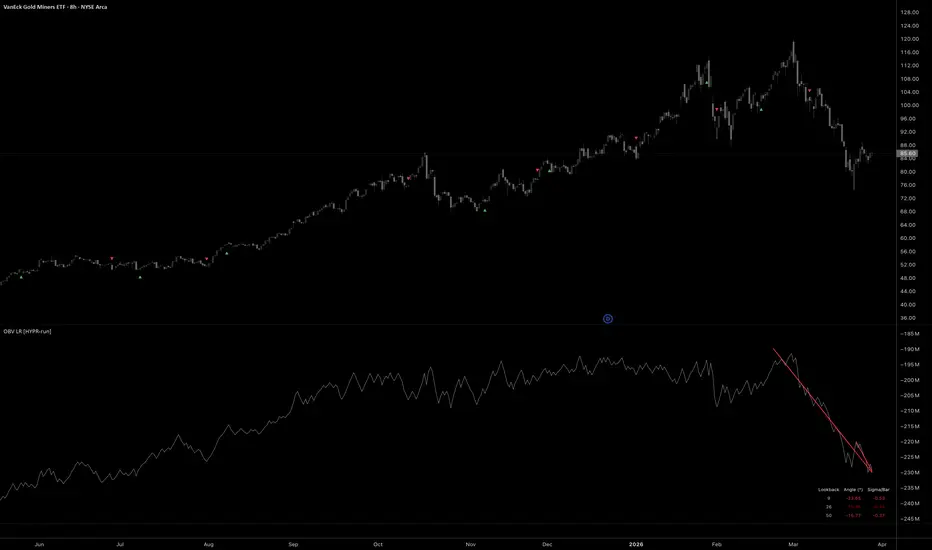
Three linear regression slopes fitted to On-Balance Volume. Measures whether accumulation or distribution is accelerating, decelerating, or reversing across short, medium, and long lookbacks simultaneously. Raw OBV tells you the cumulative direction of volume flow. Fitting a linear regression to it gives you the rate of change: the slope. Three slopes at different lookbacks show the structure of volume commitment. When all three agree, volume flow is structurally committed in one direction. When they disagree, the timeframes are in conflict.
DISCOVERING EDGE
Dual and triple slope alignment has proven to be a staple confirmation signal in our most reliable automated strategies for both entries and exits. When two or three independent lookbacks agree on the direction of volume flow, the commitment is structural, not noise. When alignment breaks, the first slope to flip tells you exactly where conviction cracked. We built this indicator to surface that alignment as a first-class signal rather than something you eyeball across separate panes.
THREE LR SLOPES vs RAW OBV LINE
Three slopes at different lookbacks show whether all timeframes of volume flow agree or conflict. Dual alignment (short + long) is the entry signal; triple (all three) confirms later for pyramids. When triple breaks, that's the exit. Values above 0.3 mean the slope is steeper than one standard deviation per bar (very strong trend). Sigma/bar above 0.1 means the slope is statistically strong; below 0.05 is weak.
FEATURES
- Three linear regression slope lines on OBV (short 9, medium 26, long 50)
- Optional adaptive short lookback (ATR-scaled for low timeframes)
- Slope alignment detection: dual (short+long) and triple (all three)
- Universal angle normalization (slope/sigma x 45 degrees)
- Sigma/Bar ratio: slope strength relative to OBV noise
- Auto-adjusts all lookbacks by timeframe (weekly/monthly compress)
- Webhook alerts on slope flip or triple alignment
- Full bar filter rejects doji/wick-heavy bars
- Dashboard with lookback, angle, and sigma/bar for all three lines
HOW IT WORKS
Linear regression calculates the best-fit line through OBV values over a lookback window. The slope of that line is the rate of volume flow. Positive slope = accumulation accelerating. Negative slope = distribution accelerating. The universal angle normalizes raw slope by OBV standard deviation so the dashboard reads consistently across any asset (BTC's OBV in millions, a low-cap's in thousands, same angle scale).
UNIVERSAL ANGLE
Slope divided by OBV standard deviation per bar, multiplied by 45. A value of 45 degrees means the slope equals one standard deviation per bar. Makes angle comparable across any asset and timeframe: 30 degrees on BTC means the same relative strength as 30 degrees on SOL.
ALERT MODES
Slope Flip: fires when selected lookback crosses zero. Negative to positive = accumulation starting (LONG). Positive to negative = distribution starting (SHORT). Triple Alignment: fires when all three slopes agree on direction. Fewer signals, higher conviction. Alert payload is built into the script as JSON; works with any webhook receiver.
CREDITS
On-Balance Volume: Joseph Granville, Granville's New Key to Stock Market Profits (1963) 지표
ema table 3.3It scans the Top 10 Heavyweight Stocks (like HDFC Bank, Reliance, ICICI) and tells you instantly if their current price is trading above or below your chosen EMA (Moving Average).
ABOVE (Green): Indicates Bullish momentum (Strength).
BELOW (Red): Indicates Bearish pressure (Weakness).
2. Fully Customizable
Custom EMA: You can input any EMA period (e.g., 9, 21, 50, or 200) directly from the settings.
On/Off Toggles: You can turn individual EMA columns on or off depending on your strategy.
Adaptive Timeframe: The dashboard automatically switches based on your chart (e.g., if you look at a 5m chart, it shows 5m trends; if you switch to Daily, it shows Daily trends).
3. The Scorecard (Decision Maker)
At the bottom of the table, you get a Total Count:
Example: If 8/10 stocks are ABOVE, the market is structurally strong for buying.
If 7/10 stocks are BELOW, the market is weak, and you should be cautious about long trades.
In short: You get the sentiment of the entire market at a glance without ever having to switch between 10 different charts 지표

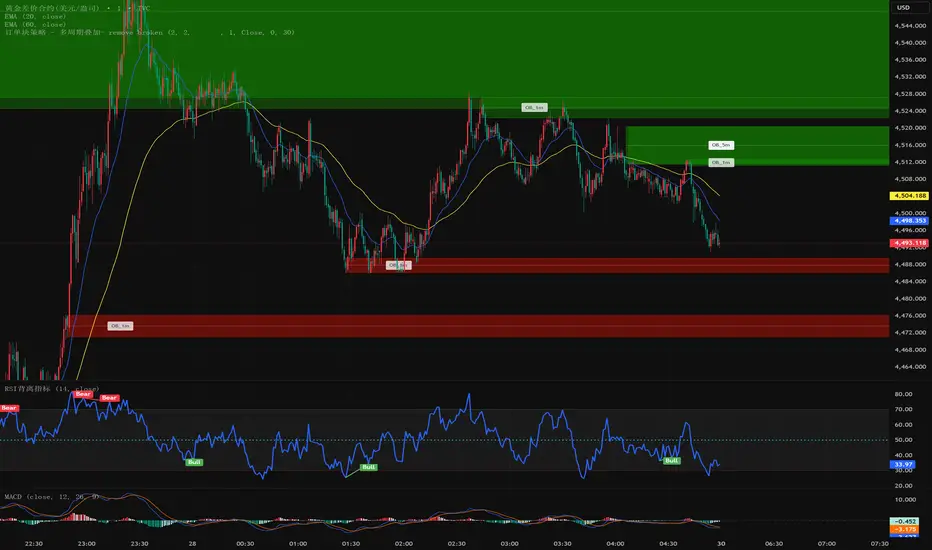
Multi-Timeframe Order Block StrategyThis indicator identifies high-quality Bullish and Bearish Order Blocks based on price action engulfing patterns with an adjustable engulfing error tolerance.
It supports multi-timeframe OB overlay (1m, 5m, 15m, 1h, 4h), automatic mitigation detection, and visual labeling with customizable colors, styles, and positioning.
Order blocks are automatically removed once mitigated, providing clean and reliable structure for smart money concepts trading.
Features:
Bullish & Bearish Order Block detection using engulfing price action
Adjustable engulfing error margin
Multi-timeframe Order Block visualization (1m / 5m / 15m / 1h / 4h)
Automatic mitigation detection (Wick / Close mode)
Customizable colors, line styles, and label positioning
Real-time alerts for Order Block formation and mitigation 지표

지표

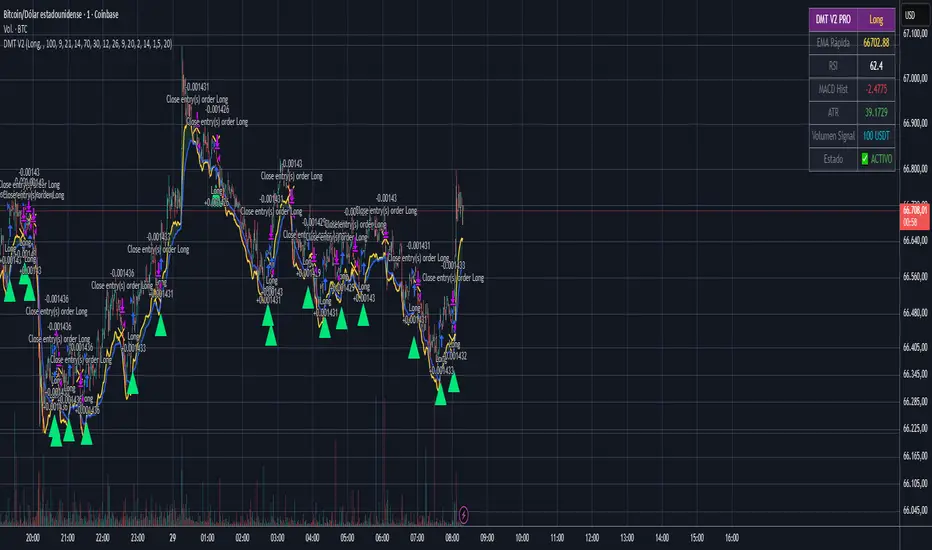
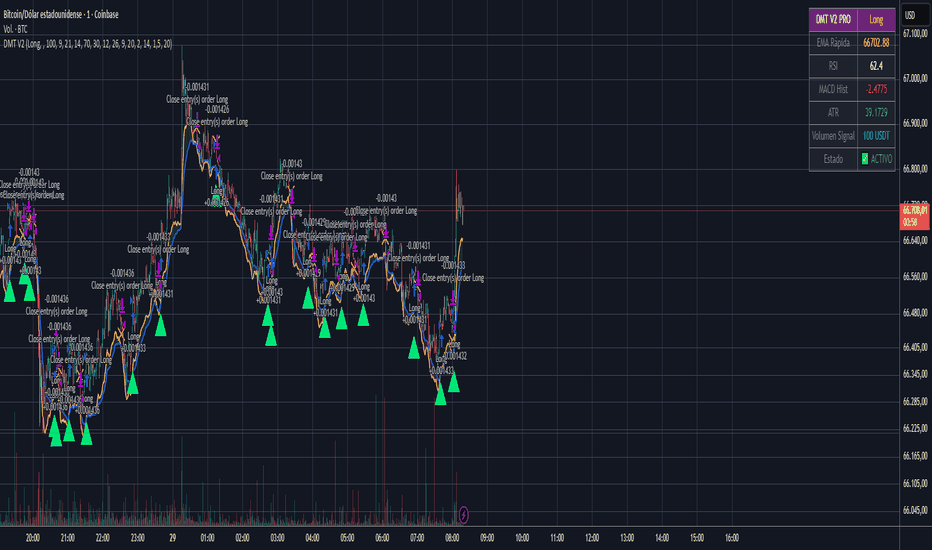
DMT Full Control Pro V2 [DearmasTrader]This is the official documentation for integrating the TradingView Strategy V2 with your DearmasTrader platform (V1.8.5+).
Our TradingView Strategy V2 has been optimized to send ultra-low latency signals, specifically designed to communicate with the internal engine of our DCA (Dollar Cost Averaging) system. When using this strategy, the analytical "brain" is in TradingView, but capital execution is protected by DearmasTrader.
Below, we detail all the possibilities and commands you can use to maximize your returns without risking your budget.
🛠️ How Does the Connection Work?
DearmasTrader operates under a "Directional Lock" system and strict capital management. This means that:
TradingView tells you WHEN and IN WHICH DIRECTION to enter. (Sends the Signal).
DearmasTrader decides HOW to execute that capital and at what price to average down. (Ignoring erroneous or excessive TV volumes).
Connect Strategy V2 to your Bot by pasting your unique URL and Webhook Token in the Alerts section of TradingView.
📡 Webhook Message Options (Payloads)
When you configure the Strategy V2 alert, the JSON message you send to the Webhook will determine how the bot reacts. You have two ways to operate: Strict Commands (Our recommendation) and Neutral Commands.
1️⃣ Strict Directional Commands (Safest / Recommended)
These commands force DearmasTrader to check if the Bot is pre-configured for that same direction. If there is human error (e.g., you send SHORT to a Long bot), the system will reject the order to protect you.
"action": "LONG"
Ideal for: Strategy V2 configured only to buy on dips.
Bot Response: If the bot in your panel is in LONG, it will execute its base order (BaseOrder) and display its DCA grid downwards. If your bot was in SHORT, it will ignore it as a security vulnerability.
"action": "SHORT"
Ideal for: V2 strategies trading bearish bounces.
Bot Response: Identical to Long, but exclusively for short selling. It will display the DCA grid upwards.
2️⃣ Neutral (Flexible) Commands
These commands tell DearmasTrader to initiate a cycle regardless of the situation, adapting to the bot's current native configuration.
"action": "ENTRY" or "action": "OPEN"
Ideal for: Strategy creators who use a single webhook to activate a bot, regardless of its configuration in the panel.
Bot Response: It will read the configuration in the DearmasTrader panel and open a Long position if the bot indicates Long, or a Short position if the bot indicates Short.
3️⃣ Panic Button or Take Profit (Close) Command
TradingView can close a position regardless of the PnL (Profit-to-Low) signal from DearmasTrader (e.g., a trailing stop detected in TradingView by a moving average crossover).
"action": "CLOSE" (or EXIT, FLAT)
Bot Response: DearmasTrader will execute an immediate market order, closing 100% of the current position, canceling all pending Safety Orders, and returning to inactive status (WaitForSignal: true). It will be clean and ready to hunt for a new entry.
⚙️ Golden Rules on Financial Capital and DCA
If you see parameters like "contracts": 1000 in your TradingView message from strategy V2, DON'T WORRY. In the overall architecture, DearmasTrader V1.8.5+ implements "Anti-Volume Overwrite".
📝 What does this mean? Even if TradingView sends a message saying "Buy 1000 BTC", your internal bot will ignore it on initial entries (OPEN/ENTRY). DearmasTrader will always use the margin budget from your BaseOrderVolume and will progressively increase it using your SafetyOrders table configured in the web panel. DCA always takes precedence over risk.
🎯 Best Practice V2: Bidirectional Accounts (Hedging)
With Strategy V2, we often want to trade both long and short positions on the same pair (e.g., BTC/USDT). To avoid conflicts of cross-positions, the professional method supported by our team is:
Create two different bots in DearmasTrader. One bot (BTC-LONG-V2) pre-set to long, and another bot (BTC-SHORT-V2) pre-set to short. Both bots will generate two different webhook links in your admin panel.
In TradingView V2: Create two separate alerts. In the "Long Condition" alert, paste the webhook of your long bot. In the "Short Condition" alert, paste the webhook of your short bot.
This way, you isolate risk and allow opposing strategies to perform their DCA (Dollar-Cost Analyzed) by averaging without canceling each other out or causing sudden closures on the Binance/Bybit exchange.
Developed and maintained by the Quantitative Engineering team at
전략
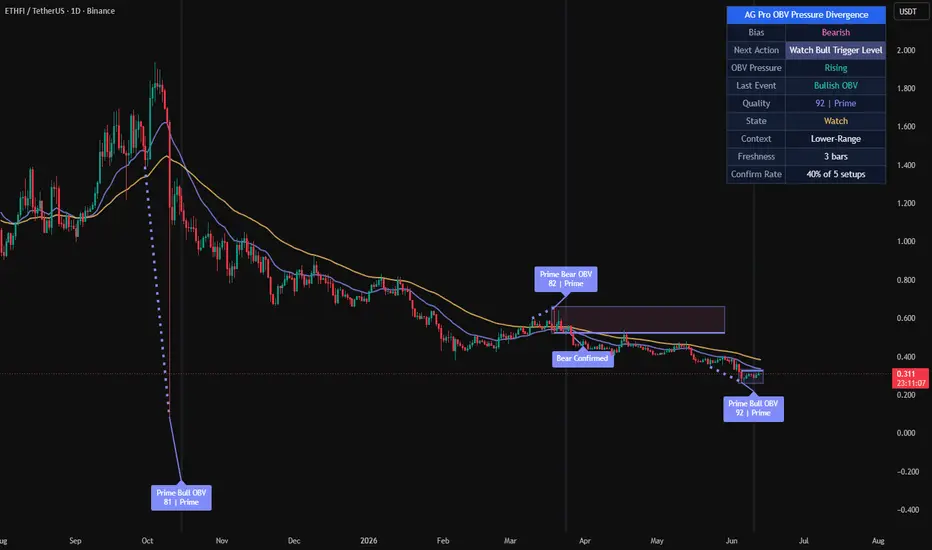
AG Pro OBV Pressure Divergence [AGPro Series]AG Pro OBV Pressure Divergence
Overview
AG Pro OBV Pressure Divergence is a context-aware divergence quality map built around the relationship between price structure and On-Balance Volume pressure.
The script is designed to identify bullish and bearish divergence events, then rank those events by participation quality, structural context, and follow-through behavior. Instead of treating every divergence as equally important, it separates weaker pressure disagreements from more meaningful setups and organizes them into a cleaner decision framework.
This is not a generic divergence marker that prints every local mismatch between price and an underlying series. Its purpose is to classify divergence events through a layered process that includes pivot structure, price displacement, OBV behavior, trend context, confirmation timing, and visual emphasis.
The result is a tool that can be used to study when price and participation begin to disagree, while still preserving a practical chart view that remains readable during live market conditions.
What this script does
- Detects bullish divergence when price forms a lower low while OBV forms a higher low
- Detects bearish divergence when price forms a higher high while OBV forms a lower high
- Filters divergence candidates using pivot separation and ATR-based price swing requirements
- Scores events by quality instead of treating all signals the same
- Highlights the strongest events with more prominent chart objects
- Tracks confirmation and invalidation behavior after the initial event
- Displays a compact summary panel for state, pressure, context, and freshness
Unique Edge
Many divergence tools stop at basic detection. They show a disagreement between price and an oscillator or cumulative volume series and leave the rest to the user.
This script takes a different approach.
Its goal is not to maximize the number of divergence labels on the chart. Its goal is to classify divergence quality.
That difference matters. A simple divergence can appear in noisy conditions, in weak structural locations, or without any meaningful follow-through. In those cases, the event may still be technically valid, but not equally useful from an analytical point of view.
AG Pro OBV Pressure Divergence attempts to address that by combining several layers:
1. Structural divergence detection
2. ATR-normalized price displacement filtering
3. OBV pressure comparison between pivots
4. Local trend context using fast and slow EMA structure
5. Setup monitoring through confirmation and invalidation logic
6. Visual hierarchy that distinguishes lower-quality from higher-quality events
Because of this design, the script is better understood as a divergence classification framework rather than a simple divergence marker.
It is also distinct from breakout, reclaim, or trend continuation tools. It does not evaluate break-retest mechanics, VWAP reclaim logic, or general trend strength as its primary objective. Its focus is the quality of price-versus-participation disagreement.
Methodology
The script begins by identifying swing pivots through a configurable pivot length. These pivots form the structural anchor points used to compare price and OBV behavior.
For bullish divergence:
- price must form a lower low
- OBV must form a higher low
For bearish divergence:
- price must form a higher high
- OBV must form a lower high
After a raw divergence is found, the script applies additional requirements before the event is accepted:
Pivot Separation
A minimum bar gap is enforced between pivots so that tightly packed micro-swings do not dominate the output.
Minimum Price Swing
The distance between the two relevant pivots is measured relative to ATR. This prevents very small structural changes from being treated like full-quality events.
Pressure Evaluation
The OBV relationship between the two pivots is examined to determine whether participation is actually improving or weakening in a meaningful way.
Trend Context
Fast and slow EMA structure is used to frame whether the event is appearing against or within the prevailing price environment.
Contextual Location
The script also evaluates where the event is occurring in its local range structure. This helps separate mid-range noise from more interesting reversal or exhaustion locations.
Scoring
All of the above components contribute to a quality score. That score is then used to separate lower-priority events from stronger ones.
Confirmation
After the initial event, the script tracks a confirmation window. During that window, the setup may confirm, remain pending, expire, or become invalidated.
This layered structure is intentional. The script does not assume that a divergence label alone is enough.
Signal Structure
The script organizes events into a sequence instead of a single binary output.
Event Detected
A new bullish or bearish divergence is found and scored.
Pending State
The event remains active while the script monitors whether follow-through appears within the confirmation window.
Confirmed
If the confirmation condition is met within the allowed window, the event is marked as confirmed.
Invalidated
If price fails the setup before confirmation, the event is marked as invalidated.
Expired
If no confirmation occurs within the defined number of bars, the setup is no longer treated as active.
This state-based behavior is useful because it prevents the chart from presenting all divergence events as finalized conclusions the moment they appear.
Quality Model
The script uses a quality threshold and a premium threshold to distinguish event strength.
Lower-quality events can still be displayed when the user wants a fuller map of all structure, but the script can also be configured to focus only on stronger setups.
This creates three practical layers of interpretation:
Building
A divergence exists, but the score is lower and the event should be treated with more caution.
High
The event passes the main quality threshold and receives stronger visual treatment.
Premium
The event exceeds the premium threshold and receives the strongest category treatment in the script.
This does not mean that premium events are guarantees, and it does not imply that lower-quality events are unusable. It simply reflects that not every divergence deserves the same level of attention.
Panel Summary
The summary panel is intended to give quick context without forcing the user to inspect every label one by one.
The panel includes:
- Bias
A simple view of the current directional background based on the fast and slow EMA relationship.
- Pressure
A quick summary of whether OBV pressure is rising, falling, or mixed.
- Last Event
Shows the most recent detected divergence direction.
- Quality
Displays the score and current classification of the most recent event.
- State
Shows whether the most recent tracked setup is in watch, confirmed, invalidated, or idle state.
- Context
Provides a compact view of the local environment, such as trend-up, trend-down, or range-related placement.
- Freshness
Indicates how many bars have passed since the latest tracked event.
Visual Design
The chart output is intentionally organized with hierarchy.
Qualified events are easier to spot than weaker ones.
Confirmation labels are visually distinct from initial event labels.
Link lines help explain which two pivots created the divergence.
Optional background pulse and active setup zone provide temporary emphasis without permanently dominating the chart.
EMA context remains available but is visually secondary to the divergence structure.
Tooltips are included for key settings so that the logic behind the inputs remains understandable directly from the settings panel.
Signals and Alerts
The script includes alert conditions for the main state transitions:
- New Bullish Pressure Divergence
- New Bearish Pressure Divergence
- Premium Bullish Pressure Divergence
- Premium Bearish Pressure Divergence
- Bullish Pressure Divergence Confirmed
- Bearish Pressure Divergence Confirmed
- Pressure Divergence Invalidated
These alerts are designed to reflect internal script states rather than making claims about future price outcomes.
Key Inputs
Pivot Length
Controls how swings are defined. Higher values reduce noise but may delay detection.
OBV Smoothing
Smooths the OBV series before divergence analysis. Higher values create a cleaner but slower pressure curve.
Minimum Pivot Separation
Prevents overly compressed pivots from producing excessive clustering.
Minimum Price Swing (ATR)
Requires meaningful structural movement before a divergence is accepted.
Quality Threshold
Defines the minimum score required for a divergence to be treated as a qualified event.
Premium Threshold
Defines the score level required for premium classification.
Confirmation Window (Bars)
Controls how long a pending event is monitored before it expires.
Use Close-Based Confirmation
Switches confirmation logic between close-based behavior and intrabar high/low behavior.
Main Label Size
Scales event, confirmation, and invalidation labels.
Panel Text Size
Controls panel readability independently from chart labels.
Drawing Emphasis
Adjusts how visually prominent lines, EMA context, and active zone objects appear on the chart.
How to use it
This script is best approached as a context tool, not as a stand-alone decision engine.
A practical workflow may look like this:
1. Identify whether the panel context is aligned with a broad directional background or whether the market is behaving more like a range.
2. Observe whether a new divergence appears in a meaningful local location rather than in the middle of random price noise.
3. Compare the quality score and classification.
4. Watch whether the event confirms or invalidates within the chosen time window.
5. Combine the information with your own structure, risk, and execution framework.
The script is often more informative when used to reduce attention on weaker disagreements and concentrate on better-formed pressure divergences.
Who it may be useful for
This script may be useful for users who want:
- a more structured way to study price and OBV disagreement
- a cleaner divergence map with stronger visual hierarchy
- a chart that distinguishes raw detection from confirmed follow-through
- a volume-pressure oriented lens that is different from standard oscillator-only divergence tools
It may be less suitable for users who want a high-frequency signal stream, a one-click entry engine, or a tool that treats every local divergence as equally relevant.
Limitations and Transparency
This script has important limitations.
First, divergence is an analytical concept, not a guaranteed turning-point mechanism. A divergence can appear and still fail, extend, or resolve slowly.
Second, the scoring model is a ranking method, not a prediction formula. A higher score does not mean certainty. It only means that the event better satisfies the script's internal conditions.
Third, pivot-based logic requires structure to form. This means the script necessarily depends on completed swing information and will not behave like a forward-only projection model.
Fourth, confirmation and invalidation logic are simplifications intended to organize event follow-through. They do not replace full trade management, execution rules, or independent risk control.
Fifth, any indicator that uses volume-derived inputs depends on the characteristics of the underlying market data. Users should be aware that data quality and market structure can differ across symbols and venues.
This script is therefore best used as a contextual classification tool rather than a complete standalone methodology.
What this script is not
- It is not a guarantee of reversals.
- It is not a promise engine.
- It is not a fully automated trading system.
- It is not a substitute for independent structure analysis or risk management.
- It is not designed to predict every local top or bottom.
- It is not intended to imply that premium signals are always superior in every market condition.
Its purpose is narrower and more practical:
to organize OBV-based divergence events into a more useful analytical framework.
Risk Disclosure
This script is for chart analysis and research purposes only.
It does not provide financial advice, investment advice, portfolio advice, or a guarantee of future market behavior. Market conditions can change quickly, and any signal or classification generated by the script can fail or become invalid.
Users should make independent decisions and apply their own risk controls before acting on any chart output.
In summary
AG Pro OBV Pressure Divergence is a public, chart-based tool for analyzing divergence quality through the interaction of price structure and OBV pressure.
Its main contribution is not that it detects divergence, but that it attempts to rank divergence events by structural relevance, pressure context, and follow-through state.
For users who want a cleaner way to study whether price and participation are beginning to disagree, this script aims to provide a more selective and better-organized framework than a raw all-events divergence marker.
지표

Moving Average ExponentialTriple EMA Ribbon Indicator (Short, Medium, Long-Term)
This indicator is a classic Exponential Moving Average (EMA) ribbon designed for TradingView, fully upgraded to Pine Script v6. It plots three distinct EMAs on the chart simultaneously, helping traders quickly identify market trends, dynamic support/resistance levels, and potential entry or exit signals across different time horizons.
Key Features
Three-Tier Trend Analysis: The indicator combines three EMAs with default lengths of 21 (Short-term), 55 (Medium-term), and 144 (Long-term). This combination is widely used by professional traders to filter out market noise and capture the core trend.
Fully Customizable: Users can easily adjust the length, data source (e.g., close, open, high, low), and offset for each of the three EMAs directly from the indicator settings panel, without needing to modify the code.
Visual Clarity: The EMAs are color-coded for instant recognition:
Red Line (EMA 21): Represents the short-term momentum.
Blue Line (EMA 55): Represents the medium-term trend.
White Line (EMA 144): Represents the long-term macro trend.
Pine Script v6 Optimized: The code has been modernized to utilize the latest Pine Script v6 namespaces (such as ta.ema and input.int), ensuring maximum performance, stability, and future compatibility on the TradingView platform.
How to Use
Trend Identification: When the short-term EMA (Red) is above the medium-term (Blue) and long-term (White) EMAs, it indicates a strong bullish trend. Conversely, when the short-term EMA is at the bottom, it signals a bearish trend.
Crossovers: Watch for the EMA 21 crossing above the EMA 55 or EMA 144 as a potential buy signal (Golden Cross). A cross below can be interpreted as a sell signal (Death Cross).
Dynamic Support/Resistance: In a trending market, the EMA 55 and EMA 144 often act as strong dynamic support (in an uptrend) or resistance (in a downtrend) zones where price pullbacks might bounce.
This tool is perfect for trend-following strategies and can be applied to any asset class, including Crypto, Forex, and Stocks, across any timeframe. 지표

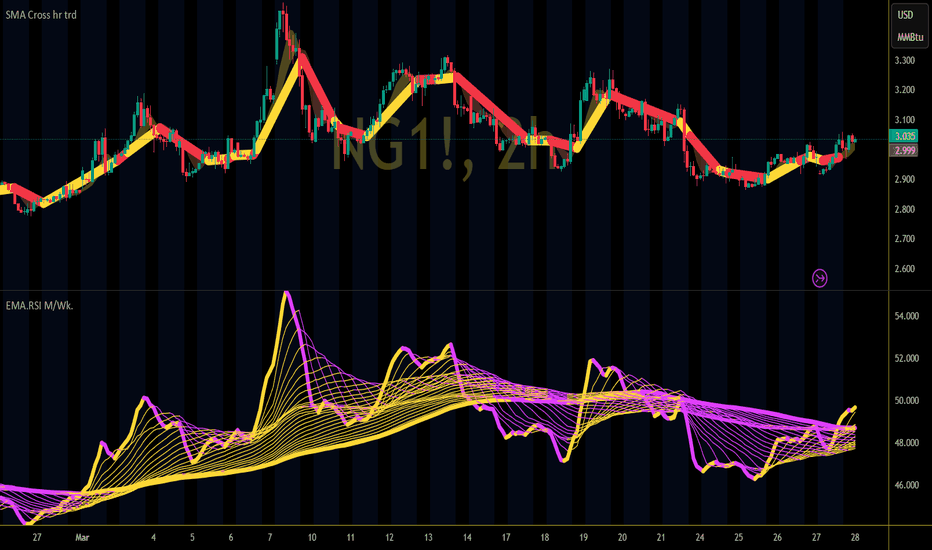
RSI AND Multi EMA 1. The Core Concept: RSI EMA SmoothingStandard RSI can be jagged and prone to false spikes. By applying an EMA (typically a 13 or 21-period) to the RSI line itself, you create a signal line that represents the "average momentum."RSI > RSI EMA: Upward momentum is accelerating.RSI < RSI EMA: Downward momentum is accelerating.
2. The Multi-Timeframe (MTF) FilterTo identify "false" moves, you compare a lower timeframe (e.g., 15-minute or 1-hour) with a higher timeframe (e.g., 4-hour or Daily).A. Identifying a "False" Market Fall (The Bear Trap)When the market drops suddenly, retail traders often panic-sell. The MTF RSI EMA shows this is "false" if:Lower Timeframe (LTF): The RSI drops sharply below its EMA and enters the oversold zone (under 30).Higher Timeframe (HTF): The RSI remains comfortably above its EMA and stays in the bullish territory (above 50).The Interpretation: The long-term trend is still healthy. The sudden fall is likely a liquidity grab or a minor retracement. Instead of selling, professional traders look for "hidden bullish divergence" here to buy the dip.B. Identifying a "False" Jump (The Bull Trap/Exit Signal)When the market pumps suddenly, FOMO (Fear Of Missing Out) often kicks in. The MTF RSI EMA suggests this is the "wrong time to enter" if:Lower Timeframe (LTF): The RSI verticalizes, screaming into the overbought zone (above 70) and moving far away from its EMA.Higher Timeframe (HTF): The RSI is hitting a "ceiling" (like 60 or 70) or is showing a lower high while price shows a higher high (Bearish Divergence).The Interpretation: The "jump" is an exhaustion move. The market is overextended. Instead of entering, this is the time to "shed" (reduce) positions or tighten stop-losses.
3. Practical Trading Rules Market Action
RSI / EMA Condition Action to Take Sudden Spike LTF RSI is > 80; HTF RSI is showing weakness/divergence. Do Not Enter. Scale out of long positions (Shed).Sudden Dump LTF RSI is < 20; HTF RSI is still above 50 and its EMA. Do Not Panic. Look for support levels to add to positions.
4. Why This Works Market cycles move in waves. A "sudden jump" on a 5-minute chart might look like a breakout, but when viewed through the lens of a Daily RSI EMA, it may simply be the price returning to its mean before continuing a larger downtrend. Summary for your notes: True moves are synchronized across timeframes (RSI and EMA trending together on both LTF and HTF).False moves are characterized by "decoupling" (LTF goes parabolic while HTF remains stagnant or rolls over). 지표
지표
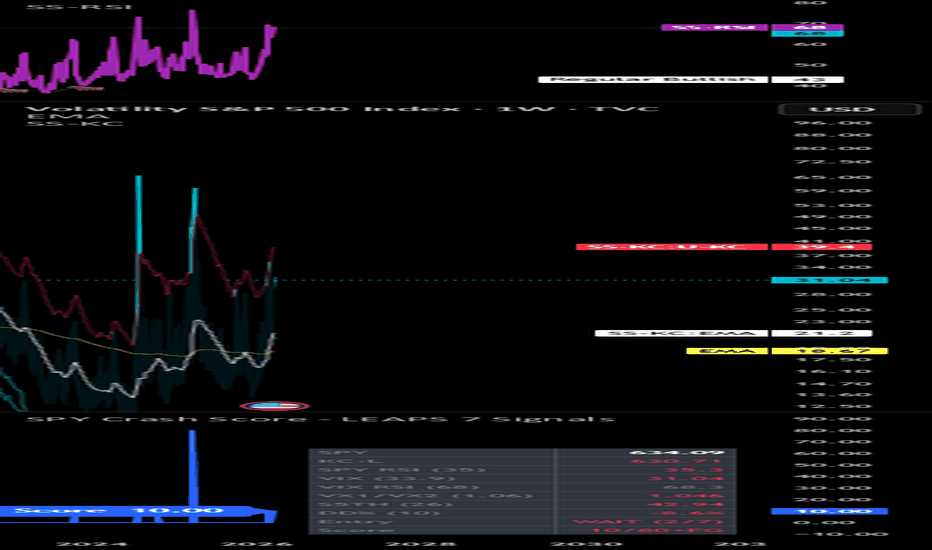
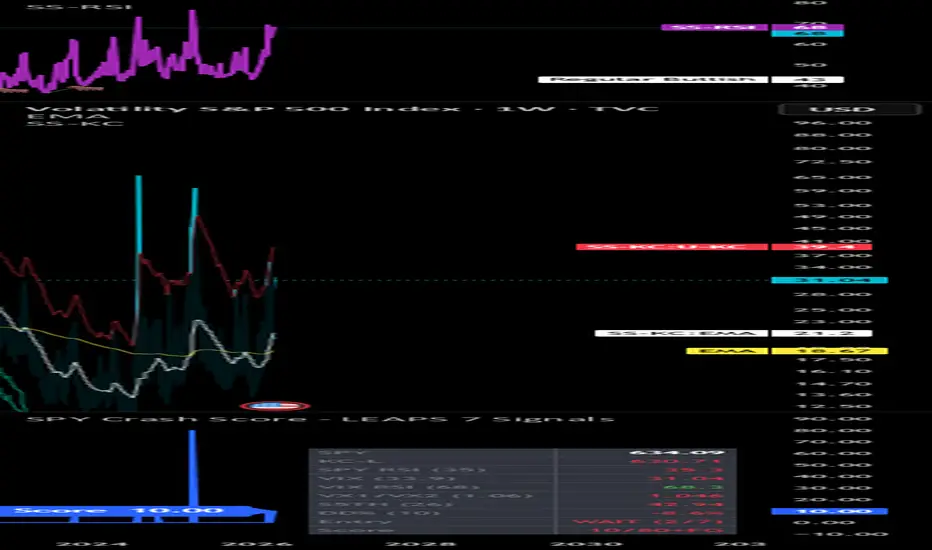
SPY Crash Score - LEAPS 7 SignalsA systematic trading decision tool for timing long-dated SPY call options (LEAPS) during market crashes. Built around a 7-signal, 100-point scoring framework backtested over 10 years (2016–2026) with a 100% win rate at threshold entries.
How it works:
Enter 8 weekly values from TradingView every Sunday — SPY close, Keltner Channel lower band, SPY RSI, CNN Fear & Greed index, VIX level, VIX RSI, VX1!/VX2! ratio, and S5TH breadth reading. The tool scores each signal against calibrated thresholds derived from historical crash entries (Oct 2018, Dec 2018, Mar 2020, Apr 2025) and outputs a deployment verdict.
Signals scored:
Keltner Channel breach (SPY ≤ KC Lower, weekly) — 20pts
SPY weekly RSI ≤ 33.82 — 20pts
CNN Fear & Greed ≤ 20 — 20pts
VIX ≥ 33.90 — 15pts
VIX weekly RSI ≥ 68 — 15pts
VX1!/VX2! backwardation ≥ 1.060 — 5pts
S5TH breadth ≤ 26% — 10pts
Deployment rules:
Score ≥ 80 → deploy 40% | Consecutive week ≥ 80 → deploy 70% | Perfect 100 → deploy 100%. Take profit at Keltner Basis.
IBKR conditional order tracker highlights when both overnight order conditions are simultaneously met (VIX ≥ 29 AND SPY ≤ 622.61). 지표

지표

Multi-Indicator Dashboard + Signals + WinRateQuick Reference for Your Charts:
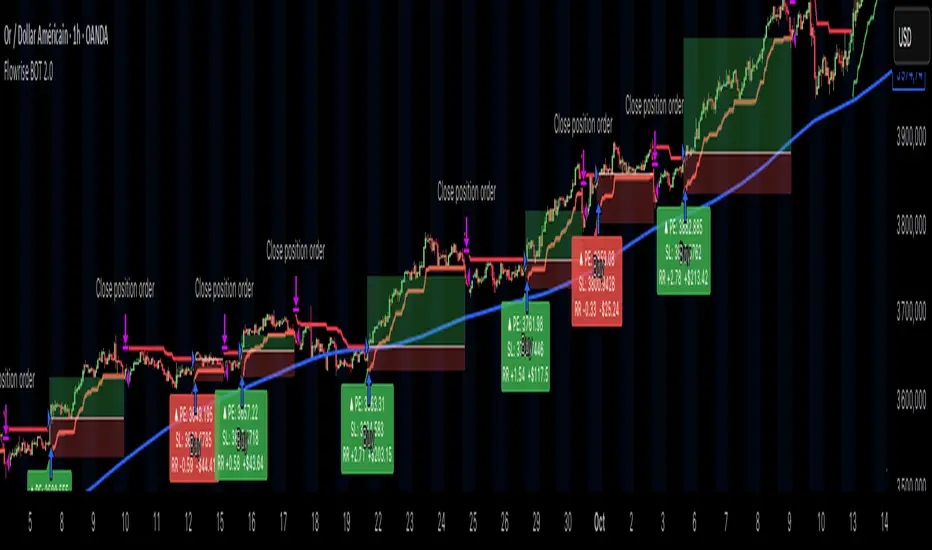
The 10 Dots (Bottom): These are your "Confluence Radar." When they all turn Green (Bullish) or Red (Bearish) at the same time, a BUY or SELL label will appear.
The Dashboard Table: Gives you the precise "why" behind every signal. You can check individual indicator states (like "Oversold" or "Neural ANN Bull") and track your performance metrics in real-time.
Active Trade Management: Watch the Red (SL) and Green (TP) lines on your chart. If you have Break Even turned on, you'll see the red line move to your entry price once the profit target is hit.
Mandatory Toggles: Remember, if an indicator is checked "ON" in settings, the strategy treats it as a mandatory requirement. To simplify the signals, simply uncheck the indicators you aren't using.
Confluence Reminder:
The BUY/SELL signals trigger only when all indicators that you have turned "ON" agree. If you only want signals from Stoch RSI, CCI, and CMF, simply toggle the others "OFF" in the settings.
Final Multi-Indicator Dashboard Pro (Indicator Version):
Full Indicator Display: The dashboard table now shows the real-time state of all 10 indicators: Stoch RSI, CCI, CMF, MACD, DMI, Aroon, RAI, Neural ANN, Volatility, and Candle Bias.
10 Signal Dots: I have added a row of 10 visual dots at the bottom of the chart. Each dot corresponds to one of the indicators listed above, allowing you to see confluence at a glance without reading the table.
Green: Bullish confirmation.
Red: Bearish confirmation.
Gray: Neutral / Mid-range.
Complete Tracking Suite:
Win Rate Tracker: Displays your hypothetical win rate based on the ATR targets.
Break Even Status: Monitors when a trade moves to a "risk-free" state.
Filter Status: Shows "ACTIVE" or "PAUSED" based on your performance limits.
Full Dashboard Control: You can now move the table to any corner of the screen and adjust the text size from Tiny to Large via the "Dashboard Settings" group.
MACD Integrated: The MACD is fully re-integrated into the settings and confluence logic.
Upgrades:
MACD Re-integrated:
The indicator now includes a full MACD group in the settings (Fast, Slow, Signal smoothing).
MACD crosses are now part of the confluence logic—if "Use MACD" is toggled on, it must agree with the other indicators to trigger a BUY/SELL signal.
A MACD status row has been added back to the dashboard table.
Dashboard Customization:
You can now choose the Table Position (Top Right, Bottom Left, etc.).
You can adjust the Text Size (Tiny to Large) to make the dashboard as compact or as visible as you need.
Signal Dots:
I added Signal Confirmation Dots at the bottom of the chart for the core signals: Stoch RSI, MACD, and Neural ANN.
Green = Bullish, Red = Bearish, Gray = Neutral. This allows you to monitor the "hidden" logic of the oscillators without cluttering the main price area.
Full Backtest Tracking:
The indicator version still maintains the Win Rate, Trade Count, and SL/TP tracking logic we built previously.
How to use:
Use the Dashboard Settings group to move the table and change its size.
Toggle indicators on or off in their respective groups to see how they change the BUY/SELL signal frequency.
지표

지표

지표