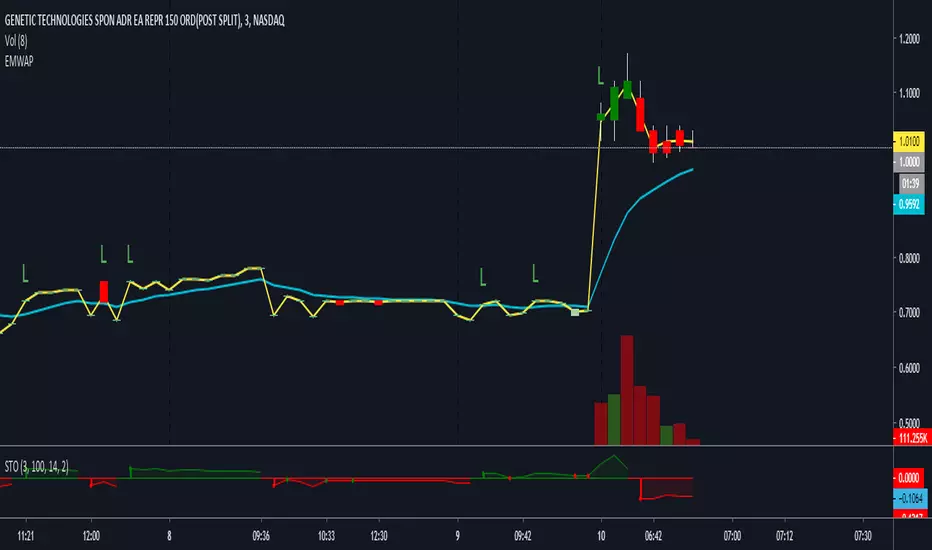
Session AverageThis indicator finds the average time of High or Low formed in sessions. This is a request from trader @Salmanmahmood15 . You need permission from him to fully use it 지표DevLucem의업데이트됨 42
Slices of Bitcoin A very simple indicator that shows how many times a currency fits into Bitcoin. In other words, the higher the value, the weaker the currency against Bitcoin. You can easily see that since the beginning of 2019 Stellar Lumen (XLM) lost half of its BTC-value while the USD-value was constant.지표icostan의17
Fractal Regression Channel V0.1Port of @RicardoSantos' Fractal Regression Channel V0 from pinescript 2 to pinescript 3. // Source: // Original Author: @RicardoSantos지표UnknownUnicorn2796841의113
BB Forecast PrototypeExperiment to try apply @atrader2's MA Forecast () to bollinger bands - didn't exactly work out how I expected it to, especially with the Upper/Lower forecast projections. 지표UnknownUnicorn2796841의69
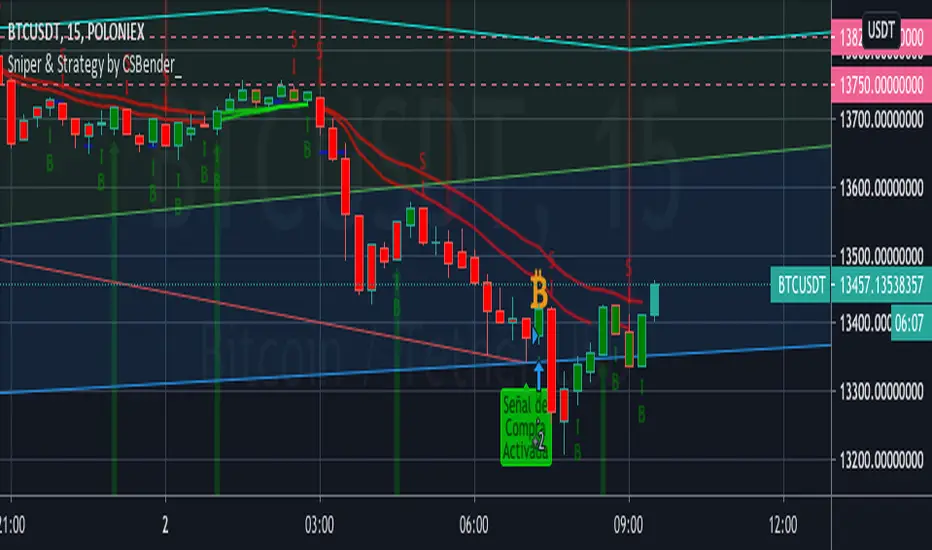
Sniper & Strategy SniperTrading permite detectar los momentos exactos de compra y venta obteniendo un buen rendimiento. Como aplicarlo: * Realice una compra cuando el indicador de COMPRA aparezca en la pantalla. * Realice una venta cuando el indicador de VENTA aparezca en la pantalla.전략CarlosBetancur의27 1.6 K
MACD SlopeShows slopes of macd line, signal line and histogram. A negative and rising slope shows improvement within a downtrend. A positive and falling slope shows deterioration within an uptrend. 지표tmyerskerry의8360
Linear regression slope as SARThis model calculate the slope of the linear regression and give you the uptrend or the down trend of the slope red line are downtrend and green line are up trend using len 1 you can make it longer or shorter (I put it on length of 40 but you can change that to what ever you want ) Similar to SAR it can give us the trends of buy and sell only by doing it by the linear way try longer length to see if it smooth the signal 4 hour graph 지표RafaelZioni의업데이트됨 6228
Linear Regression (Backtest / Trailing Stop)A Strategy with Backtest and Trailing Stop for Long/Short Credits: Study by RafaelZioni - Thanks buddy! 전략nilux의4267
linear regression newSo this is new attempt to plot linear regression , I hope TV will make it free so we will not need to break our heads on this important indicator지표RafaelZioni의업데이트됨 1376
Back - Front Futures Spread 4hr IndicatorThis puts a normalized back - front spread based on the close price.지표aimzieslol의53
Linear regression % channelThis channel is based on Linear regression by its % difference from the price the high and the low are determine by the % from the close price . For the best fit you need to put the TF on the same min of the graph. I put the channel to be 3 % above and bellow the price .by the same way you can add to the script more % line to make it better this is good indicator for filtering (if you want your signal to be above or bellow the % channel) or if you want to enter at certain price and exit by the지표RafaelZioni의90
Dorsey InertiaThis indicator was originally developed by Donald Dorsey (Stocks & Commodities, V.13:9 (September, 1995): "Refining the Relative Volatility Index"). Inertia is based on Relative Volatility Index (RVI) smoothed using linear regression. In physics, inertia is the tendency of an object to resist to acceleration. Dorsey chose this name because he believes that trend and inertia are related and that it takes more effort and energy to reverse the direction of a stock or market than to keep it in the지표everget의6403
Kirshenbaum BandsThis indicator was originally developed by Paul Kirshenbaum, a mathematician with a Ph.D. in economics from New York University. It uses the standard error of linear regression lines of the closing price to determine band width. This has the effect of measuring volatility around the current trend, rather than measuring volatility for changes in trend. Good luck! 지표everget의4244
Linear Regression Channel [jwammo12]This is a non-repaint version of the built-in linear regression indicator in pine. It creates moving bands where the current bar matches the built-in Linear Regression indicator exactly (see screenshot). The key to replicating the built-in function is calculating the std deviation across the length of bars away from the current Linear Regression line, as opposed to the linear regression line that would have been calculated at the historic bar. 지표jwammo12의업데이트됨 8406
linreg-areas (like fib system just more accurate) So this system is a different approach to form a daily fib like system. Its based on linear regression and its slope , we calculate the slope of the line and we put it in MTF format that is without security and non repainting (int2=1440 min) As you in graph the coin in this case BTC has cycle from low to high similar to the fibs system. the lowest level is bellow -0.2 , next level is -0.1 ,0,0.1 and above 0.2 is consider the highest with this system its easy to find the highs and the lows a지표RafaelZioni의4348
24HLRThis indicator is 24 hours Linear regression line . with upper SD and lower SD (can be manipulated ) The idea is that the coin will bounce up or down around the LR line (red) when you go lower frame of 4h up to1 hour charts then you can see more easy the direction of the coin , its potential low or potential high , where the LR lead the way . In this example we look on btc at 4hours chart and see that its in a cross road either to hell or to escape (if break the line going down upward) a지표RafaelZioni의742
Chande Kroll R-Squared IndexChande Kroll R-Squared Index script. This indicator was originally developed by Tushar S. Chande and Stanley Kroll (see their book `The New Technical Trader`, Chapter 2: `Linear Regression Analysis`).지표everget의2231
linear MultiTFThis is linear MTF .. just change the setting of the TF that youy want.. similar idea to heiken but i hope this one is not repainting:) 지표RafaelZioni의245
linearreg as heikenLinear regression as similar to heiken candles, arrow up (green) or down (red) show the trends 지표RafaelZioni의4166
LinearSARThis is colur coding of linear model and Sar . it good for a template to make upon it better models also it a great model for long or short on bitmex so have fun 지표RafaelZioni의446
LR ChannelScript draws actual positions of linear regression channel boundaries and doesn't repaint. Green lines color - for a positive slope of standard linear regression channel, red - for a negative slope.지표sergko13의4510
Linear Regression Channel - RKSell when turns red. Buy when turns green. Don't be greedy, keep booking profit. Gray means don't trade.지표mrkstocks의업데이트됨 2160
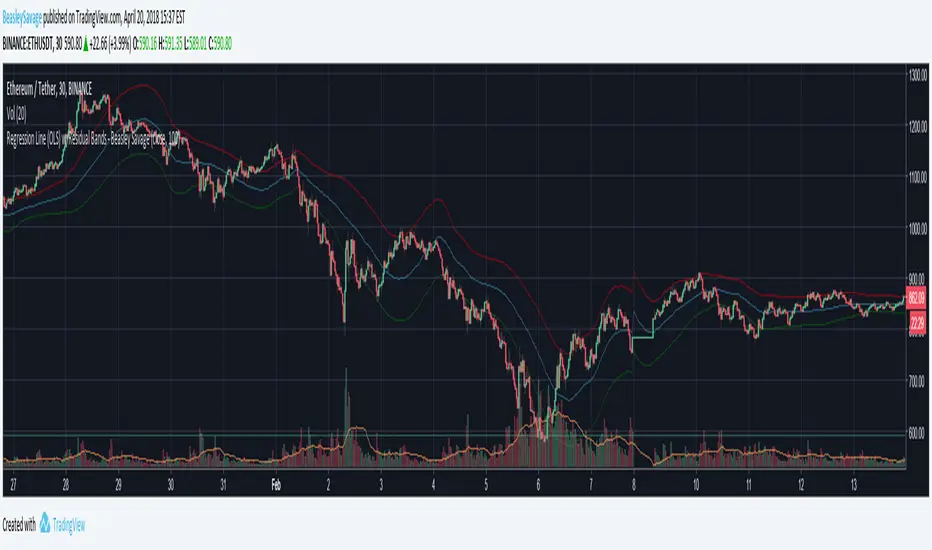
Regression Line (OLS) w/Residual Bands - Beasley SavagePlots linear regression "line of best fit" for a given source and length. Also plots the standard deviation of residuals as upper and lower bands. For some reason it's not plotting the lines exactly where the values are, so I wouldn't recommend using it as a purely visual indicator, but it could be used in strategies. A quick implementation of a strategy buying when the close crossed over the lower band and selling when close crossed under the upper band resulted in ~60-70% trade accuracy, not t지표BeasleySavage의60