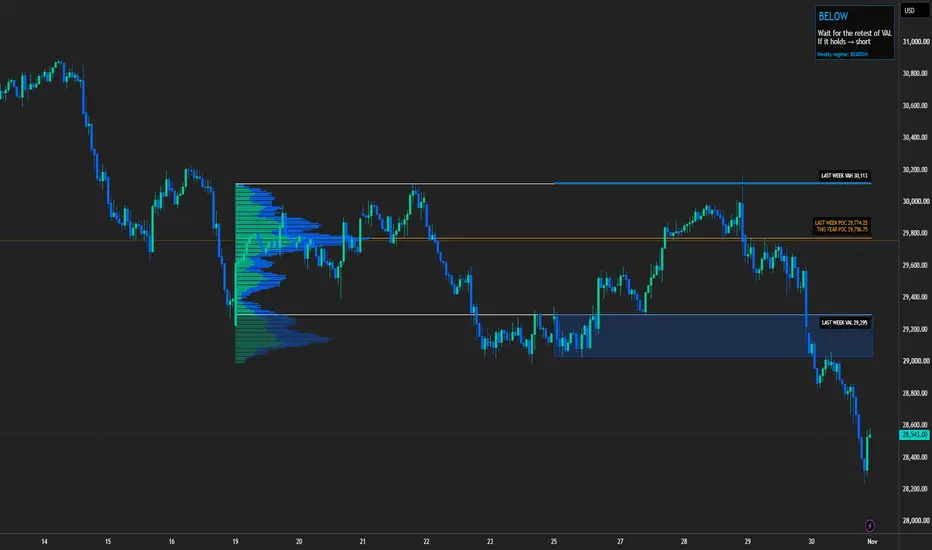
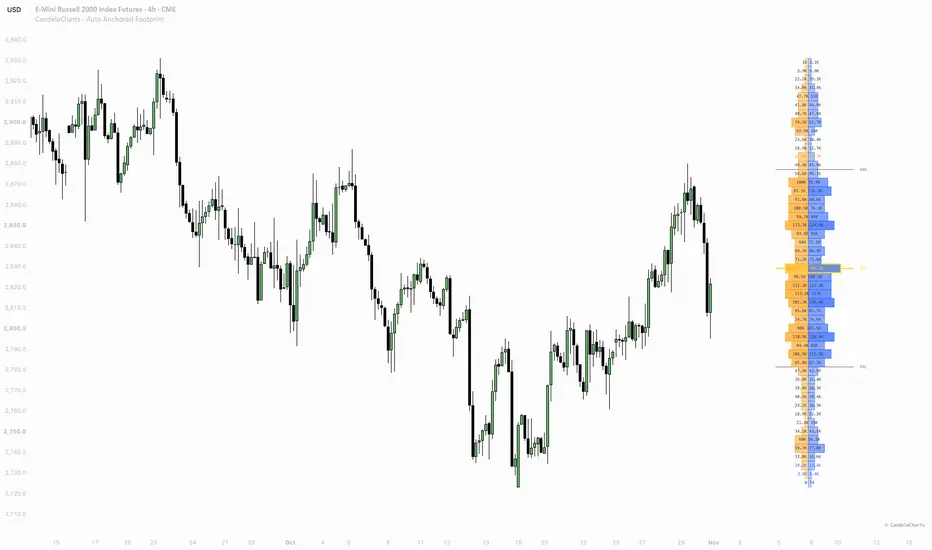
NLA Value MapNLA Value Map draws last week's volume profile and carries its value area into the current week, so you can see at a glance where price is meeting last week's value.
WHAT IT SHOWS
• Last week's volume profile, drawn over last week's candles. Teal = volume traded on up candles, blue = volume on down candles, brighter inside the value area.
• Last week's value area high (VAH) and value area low (VAL) as white lines and the point of control (POC) as an amber line, carried through the current week.
지표