지표

지표

지표

지표
지표

지표

지표

전략

지표
지표

지표

지표

지표

지표

지표

지표

지표

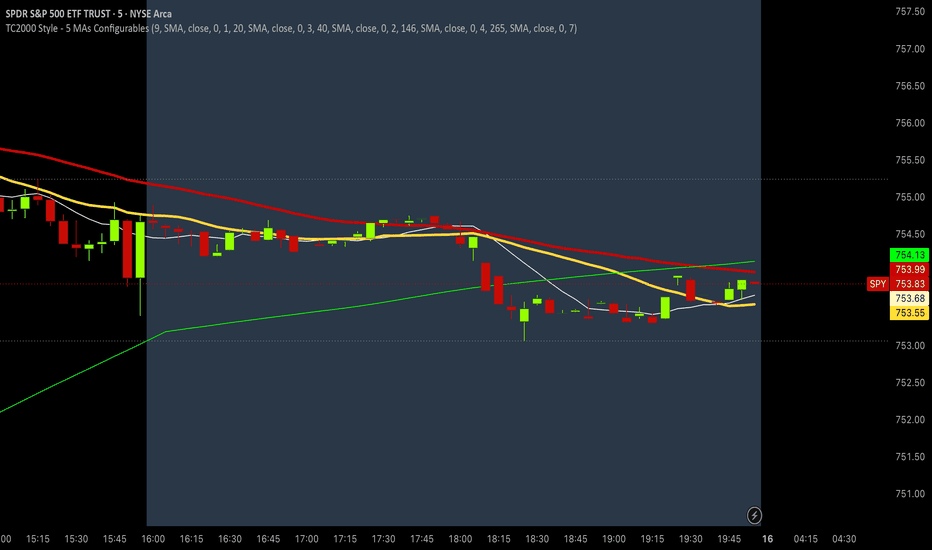
Kevin's swingdicatorsKevin's swingdicators
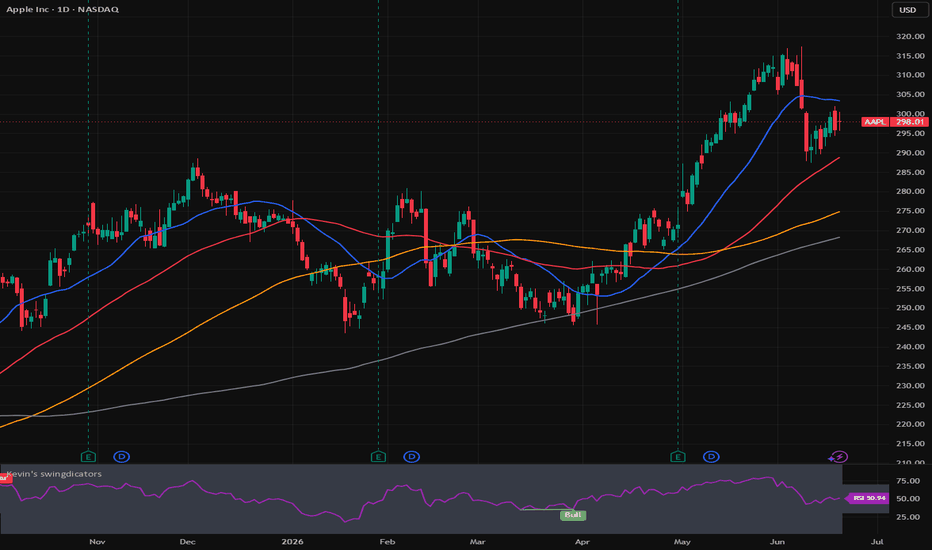
Kevin's swingdicators is a combined indicator for swing trading analysis. It includes an RSI divergence module and a configurable moving average ribbon.
The moving average module plots up to six moving averages on the price chart. By default, the first four moving averages are enabled: 20 SMA, 50 SMA, 100 SMA and 200 SMA. The fifth and sixth moving averages are disabled by default and can be configured manually. Users can change the moving average type, source, length and color.
The RSI module is displayed in a separate pane below the price chart. It includes optional detection of regular and hidden RSI divergences. Divergences are detected by comparing RSI pivots with the corresponding price highs or lows on the same bars.
Regular bullish divergence occurs when price makes a lower low while RSI makes a higher low. This can indicate weakening bearish momentum and a possible bullish reversal.
Regular bearish divergence occurs when price makes a higher high while RSI makes a lower high. This can indicate weakening bullish momentum and a possible bearish reversal.
Hidden bullish divergence occurs when price makes a higher low while RSI makes a lower low. This is generally interpreted as a possible bullish trend-continuation signal.
Hidden bearish divergence occurs when price makes a lower high while RSI makes a higher high. This is generally interpreted as a possible bearish trend-continuation signal.
The RSI divergence module includes three preset modes:
- Conservative: RSI length 14, pivot left 5, pivot right 5.
- Medium: RSI length 7 or 9, pivot left 3, pivot right 3.
- Aggressive: RSI length 5, pivot left 1, pivot right 3.
The conservative preset produces fewer signals and is intended to reduce noise. The aggressive preset produces more signals and reacts faster, but it may also produce more false signals. The medium preset is a compromise between both.
This indicator is intended for educational and analytical use only. It does not provide financial advice, buy signals or sell signals. RSI divergences should not be used in isolation. They are best interpreted together with market structure, support and resistance, trend direction, moving averages, volume, Fibonacci levels and other forms of technical analysis.
Dutch documentation is provided below.
## Nederlandse documentatie
Handig als je de gratis versie van Tradingview hebt of als je in 1 keer de setup klaar wil hebben zoals Kevin trade. Alles binnen 1 indicator, dus ruimschoots binnen de twee die je bij een gratis account van TV mag gebruiken.
De volgende indicatoren zijn hier gebundeld:
# Zes moving averages
Bij default staat dit ingesteld:
* 20SMA, blauw
* 50SMA, rood
* 100SMA, oranje
* 200SMA, grijs
Je kunt er desgewenst nog twee extra toevoegen, als je dat graag wilt. Deze staan default uit. Uiteraard kun je eventueel ook het type MA veranderen (bijv. exponentieel) en de kleuren wijzigen. Maar de defaults passen bij de instellingen die Kevin hanteert.
# Relative Strength Indicator
De RSI staat in een pane onder de chart.
## RSI divergentie
Als extra opties kan de RSI indicator ook bearish en bullish divergences identificeren (maar dat kun je ook uit zetten). Je kunt divergenties op meerdere manieren bepalen, de default is de "conservatieve" setting:
* Conservatief: gebruikt de lengte 14 (de wereldwijde RSI standaard), gebruikt 5 bars links en 5 bars rechts om een relevante low of high te bepalen.
* Aggresief: lengte 5 en 1 bar links en 3 rechts. Dit geeft veel meer divergenties en dus ook meer ruis. Maar als je aggresiever wilt traden, dan is dit er voor je.
Je kunt ook zelf de diverse instellingen wijzigen naar smaak en trading stijl.
Een **RSI-divergentie** ontstaat wanneer de prijs en de RSI niet meer dezelfde richting bevestigen. De prijs maakt bijvoorbeeld een nieuwe high of low, terwijl de RSI dat niet doet. Omdat RSI momentum meet, kan zo’n verschil erop wijzen dat de kracht achter de huidige beweging afneemt of juist dat een correctie binnen een trend bijna klaar is.
RSI-divergenties worden meestal berekend door twee opeenvolgende **swing points** of **pivots** met elkaar te vergelijken:
```text
Prijs-pivot 1 versus prijs-pivot 2
RSI-pivot 1 versus RSI-pivot 2
```
In deze indicator worden de pivots gevonden op basis van de RSI. Daarna wordt op dezelfde bars gekeken wat de prijs deed. Een bullish divergentie gebruikt doorgaans RSI-pivot lows en prijs-lows. Een bearish divergentie gebruikt RSI-pivot highs en prijs-highs.
---
# Reguliere RSI-divergentie
Een **reguliere divergentie** wijst meestal op een mogelijke **trendomkeer**. De prijs zet de bestaande beweging nog door, maar de RSI bevestigt die nieuwe extreme niet meer.
## Regular bullish divergence
Een **regular bullish divergence** ontstaat wanneer:
```text
Prijs: lagere low
RSI: hogere low
```
Berekening:
```text
current price low < previous price low
current RSI low > previous RSI low
```
Interpretatie:
De prijs maakt een nieuwe lagere bodem, maar de RSI maakt juist een hogere bodem. Dat betekent dat de neerwaartse beweging in prijs niet meer volledig wordt bevestigd door momentum. De verkoopdruk kan dus afnemen.
Voorbeeld:
```text
Prijs low 1 = 100
Prijs low 2 = 95
RSI low 1 = 25
RSI low 2 = 32
```
De prijs is zwakker, maar de RSI is sterker. Dit wordt meestal gezien als een mogelijk bullish reversal-signaal.
---
## Regular bearish divergence
Een **regular bearish divergence** ontstaat wanneer:
```text
Prijs: hogere high
RSI: lagere high
```
Berekening:
```text
current price high > previous price high
current RSI high < previous RSI high
```
Interpretatie:
De prijs maakt een nieuwe hogere top, maar de RSI maakt een lagere top. De opwaartse beweging wordt dus niet meer volledig bevestigd door momentum. De koopdruk kan afnemen.
Voorbeeld:
```text
Prijs high 1 = 100
Prijs high 2 = 106
RSI high 1 = 75
RSI high 2 = 67
```
De prijs is sterker, maar de RSI is zwakker. Dit wordt meestal gezien als een mogelijk bearish reversal-signaal.
---
# Hidden RSI-divergentie
Een **hidden divergence** is anders. Waar een reguliere divergentie meestal op een mogelijke draai wijst, wijst een hidden divergence meestal op mogelijke **trendvoortzetting**.
Bij hidden divergence blijft de prijsstructuur in de richting van de trend intact, maar de RSI corrigeert sterker dan de prijs. Dat kan betekenen dat de markt intern momentum heeft “gereset”, terwijl de trend zelf nog niet gebroken is.
---
## Hidden bullish divergence
Een **hidden bullish divergence** ontstaat meestal binnen een bestaande uptrend.
Voorwaarde:
```text
Prijs: hogere low
RSI: lagere low
```
Berekening:
```text
current price low > previous price low
current RSI low < previous RSI low
```
Interpretatie:
De prijs blijft relatief sterk, omdat hij een hogere bodem maakt. De RSI maakt echter een lagere bodem, wat aangeeft dat de oscillator dieper is gecorrigeerd. Dit kan betekenen dat de pullback voldoende is afgekoeld terwijl de bullish prijsstructuur intact blijft.
Voorbeeld:
```text
Prijs low 1 = 100
Prijs low 2 = 104
RSI low 1 = 40
RSI low 2 = 31
```
De prijs maakt een hogere bodem, maar RSI maakt een lagere bodem. Dit wordt vaak gezien als een bullish continuation-signaal.
---
## Hidden bearish divergence
Een **hidden bearish divergence** ontstaat meestal binnen een bestaande downtrend.
Voorwaarde:
```text
Prijs: lagere high
RSI: hogere high
```
Berekening:
```text
current price high < previous price high
current RSI high > previous RSI high
```
Interpretatie:
De prijs blijft relatief zwak, omdat hij een lagere top maakt. De RSI maakt echter een hogere top, wat aangeeft dat de oscillator sterker is opgeveerd dan de prijs. Dit kan betekenen dat de tijdelijke bounce voldoende is afgekoeld, terwijl de bearish prijsstructuur intact blijft.
Voorbeeld:
```text
Prijs high 1 = 100
Prijs high 2 = 96
RSI high 1 = 58
RSI high 2 = 69
```
De prijs maakt een lagere top, maar RSI maakt een hogere top. Dit wordt vaak gezien als een bearish continuation-signaal.
---
# Belangrijkste verschil tussen regular en hidden divergence
Het verschil zit zowel in de **berekening** als in de **interpretatie**.
| Type | Prijs | RSI | Meestal geïnterpreteerd als |
| --------------- | ----------: | ----------: | -------------------------------- |
| Regular bullish | lagere low | hogere low | mogelijke omkeer omhoog |
| Regular bearish | hogere high | lagere high | mogelijke omkeer omlaag |
| Hidden bullish | hogere low | lagere low | mogelijke voortzetting uptrend |
| Hidden bearish | lagere high | hogere high | mogelijke voortzetting downtrend |
Kort gezegd:
```text
Regular divergence = prijs maakt een nieuw extreme, RSI bevestigt niet.
Hidden divergence = prijsstructuur blijft intact, RSI corrigeert dieper.
```
Of nog compacter:
```text
Regular divergence = mogelijke reversal
Hidden divergence = mogelijke continuation
```
---
# Gebruik in de praktijk
Een RSI-divergentie is geen zelfstandig koop- of verkoopsignaal. In Kevin's aanpak gebruiken we divergenties als contextsignaal.
Een reguliere bullish divergence is sterker wanneer die verschijnt rond steun, na een duidelijke daling, of wanneer daarna een hogere high in prijs ontstaat. Een reguliere bearish divergence is sterker rond weerstand, na een duidelijke stijging, of wanneer daarna een lagere low in prijs ontstaat.
Hidden bullish divergence is vooral relevant in een bestaande uptrend. Hidden bearish divergence is vooral relevant in een bestaande downtrend. Zonder trendcontext zijn hidden divergences minder betrouwbaar, omdat ze bedoeld zijn als voortzettingssignalen.
Gebruik RSI-divergenties alleen in combinatie met sterke levels, ronde getallen, Fibonacci, tend, moving averages, et cetera.
지표
지표
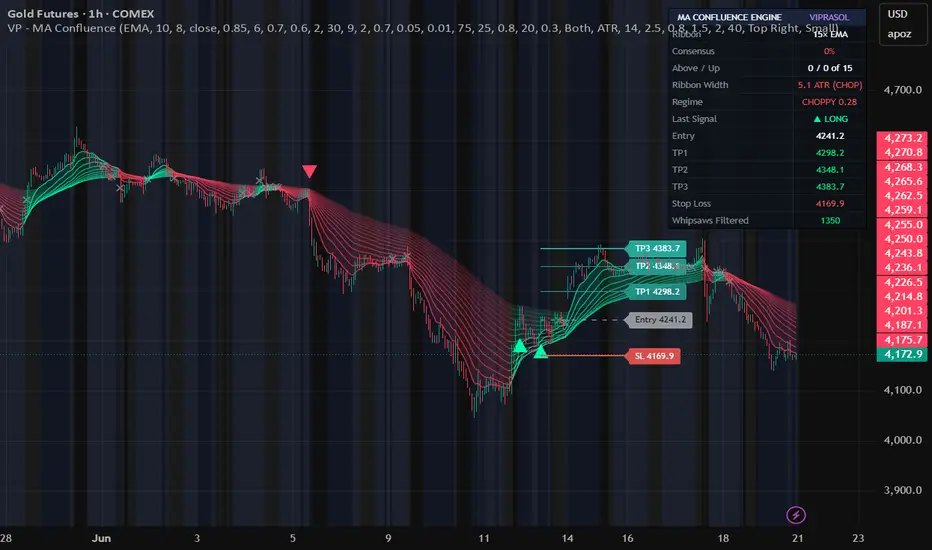
MA Confluence Engine [Viprasol]MA Confluence Engine — 15-MA Consensus Ribbon
═══════════════════════════════════════════════════════════
ONE CROSSOVER IS AN OPINION. FIFTEEN MAs AGREEING IS A TREND.
═══════════════════════════════════════════════════════════
A single moving-average crossover whipsaws constantly — two lines tangle in chop and
fire signal after signal that goes nowhere. MA Confluence Engine replaces that one
fragile opinion with the agreement of a 15-MA ribbon. It only signals when most of the
ribbon agrees on direction, stands aside when the ribbon squeezes together (a
compressed ribbon IS chop), and on every signal it draws a complete trade plan:
Entry, TP1, TP2, TP3 and Stop Loss.
═══════════════════════════════════════════════════════════
HOW THE CONSENSUS WORKS
═══════════════════════════════════════════════════════════
The engine builds a ribbon of 15 moving averages, spaced from a fast base length
upward (e.g. 10, 18, 26 … 122). Every bar it measures two things across all 15:
• How many is price trading ABOVE?
• How many are SLOPING UP?
These combine into a single CONSENSUS SCORE from 0 to 100:
100% = price above all 15 MAs AND all 15 rising (a fully stacked uptrend)
0% = price below all 15 AND all 15 falling (a fully stacked downtrend)
50% = mixed — the ribbon disagrees
A long signal fires only when consensus rises through your bullish threshold
(default 75%), a short when it falls through the bearish threshold (default 25%).
Half-hearted moves where the ribbon disagrees never trigger.
═══════════════════════════════════════════════════════════
THE TRADE PLAN — DRAWN ON THE LAST SIGNAL
═══════════════════════════════════════════════════════════
The moment a signal fires, the engine projects five levels forward and labels each
with its price:
• ENTRY — at the signal close
• STOP LOSS — your risk distance away (ATR or %); this distance defines 1R
• TP1 / TP2 / TP3 — at your chosen R-multiples of that risk (default 1R / 2R / 3R)
Only the most recent signal's plan is shown, so the chart stays clean. The dashboard
mirrors the exact prices, and every alert carries the full plan (Entry/SL/TP1/TP2/TP3)
so it's ready for journaling or automation.
═══════════════════════════════════════════════════════════
THE RIBBON IS ITS OWN CHOP FILTER
═══════════════════════════════════════════════════════════
When a market chops, moving averages of every length collapse onto each other — the
ribbon goes flat and thin. The engine measures RIBBON WIDTH (the spread of the 15 MAs,
normalized by ATR) and skips signals whenever the ribbon is compressed below your
threshold. A second Kaufman Efficiency-Ratio gate confirms price is actually trending.
Filtered crosses are drawn faintly (✕) and counted, so you SEE what was avoided.
═══════════════════════════════════════════════════════════
21 VERIFIED, LICENSE-CLEAN MOVING AVERAGES
═══════════════════════════════════════════════════════════
Build the ribbon from any one of:
SMA, EMA, WMA, RMA, VWMA, DEMA, TEMA, HMA, ALMA, T3, McGinley, ZLEMA, KAMA, FRAMA,
VIDYA, SuperSmoother, Gaussian, Laguerre, Kalman, LSMA, Median.
Each is implemented from its published formula and credited to its author. Jurik's JMA
is deliberately excluded — it is a proprietary, trademarked product whose every
open-source "version" is an unlicensed reverse-engineering.
═══════════════════════════════════════════════════════════
DASHBOARD
═══════════════════════════════════════════════════════════
• Live consensus score, with price-above and sloping-up counts (x of 15)
• Ribbon width + chop state, trend-regime efficiency reading
• Last signal direction and the full Entry / TP1 / TP2 / TP3 / SL prices
• Whipsaws filtered
═══════════════════════════════════════════════════════════
FEATURES
═══════════════════════════════════════════════════════════
• 15-MA ribbon colored by consensus (red → green) or simple bull/bear, with fill
• Entry/TP1/TP2/TP3/SL level lines + labels on the latest signal
• Choppy-regime background shading + faint markers on filtered crosses
• Direction filter (Both / Longs / Shorts)
• Stop in ATR or %, take-profits as R-multiples
• Alerts for long, short, and chop — signal alerts include the full trade plan
• Full MA sub-parameter control (ALMA, T3, KAMA, Gaussian, Laguerre, Kalman, VIDYA, McGinley)
═══════════════════════════════════════════════════════════
HOW TO USE
═══════════════════════════════════════════════════════════
1. Choose an MA type, base length, and spacing for the ribbon.
2. Wait for a signal — it only fires when the ribbon fans out and aligns (consensus
through your threshold) in a trending regime.
3. Use the drawn Entry / SL / TP1 / TP2 / TP3 as your trade plan; scale out at the TPs.
4. Raise the consensus thresholds and ribbon-width minimum to make signals stricter
(fewer, cleaner) — the whipsaw-filtered count shows the filter working.
═══════════════════════════════════════════════════════════
HONEST LIMITATIONS — PLEASE READ
═══════════════════════════════════════════════════════════
• Signals are evaluated on bar close; act on confirmed bars to avoid intrabar flicker.
• A consensus system enters LATER than a single fast crossover — it trades fewer,
higher-quality moves and will sit out fast reversals. That trade-off is the point.
• The TP/SL levels are a risk framework, not a prediction — markets do not owe you 3R.
• Volume MAs (VWMA) and the regime math need reliable data; some synthetic forex/CFD
feeds are less meaningful.
• This is a decision-support tool, not financial advice. Trade at your own risk.
═══════════════════════════════════════════════════════════
CREDITS & ORIGINALITY
═══════════════════════════════════════════════════════════
MA methods credited to their authors: Wilder (RMA), Mulloy (DEMA/TEMA), Hull (HMA),
Legoux & Kouzis-Loukas (ALMA), Tillson (T3), McGinley, Kaufman (KAMA/Efficiency Ratio),
Ehlers (ZLEMA, SuperSmoother, Gaussian, Laguerre, FRAMA), Chande (VIDYA), Kálmán
(Kalman). All formulas are public-domain / published methods. Every line of Pine — the
MA dispatcher, the 15-MA consensus engine, the ribbon chop filter, the trade-plan
projection, and the visualization — is original Viprasol work written from the
published formulas. No third-party Pine code is reused; no proprietary algorithms included.
지표

지표

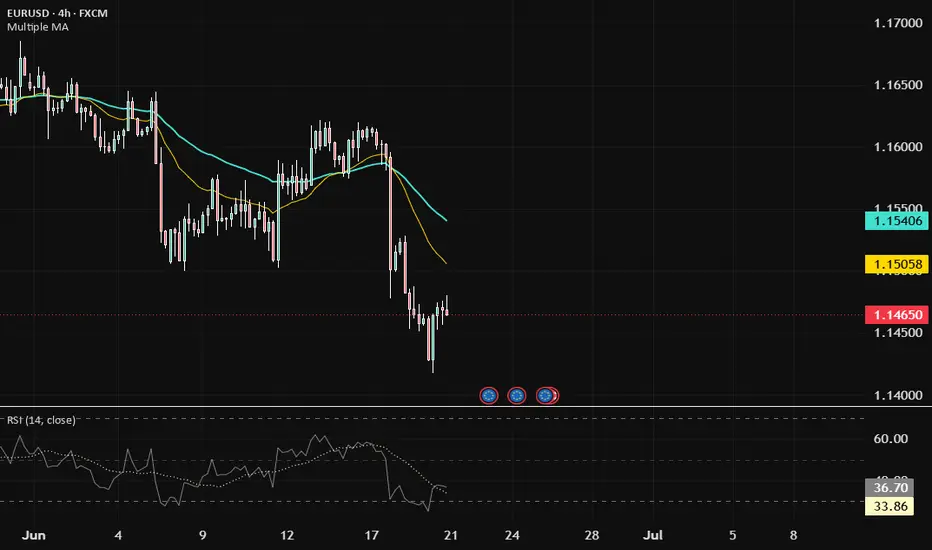
Multiple EMA + SMA (8-in-1, or 4 of each)This combo indicator takes Tradingview's default SMA and EMA Pinescript code and basically duplicates it 8 times. There are 4 EMAs and 4 SMAs, each configurable to their own timeframe, line, color, etc. I did this so I could see several combinations of moving averages on various chart timeframes, such as:
- Daily chart: 200 SMA, 50 SMA, 20 EMA
- 4 hour chart: 200 SMA, 50 EMA, 20 EMA
- 1 hour chart: 50 EMA, 20 EMA, 9 EMA
- 30 minute chart: 50 EMA, 20 EMA, 9 EMA
Moving Averages Are Filters, Not Triggers: The moving average smooths price action to reveal the dominant market current, not to provide buy or sell signals alone. It filters market noise but requires price action confirmation for entry decisions.Therefore it's important to note the **slope** direction of the MA too.
Matching Time Frame and Holding Period: Using a moving average setting built on a timeframe inconsistent with your trade duration (e.g., a short moving average on a multi-month trade) causes frequent whipsaws. The setting must reflect your trade horizon.
Three Roles of Moving Averages on Any Time Frame:
1. **Tide (Slowest Line)** — Indicates the overall market direction and which side to trade.
2. **Trend (Middle Line)** — Represents the active trend you trade around.
3. **Timing (Fastest Line)** — Identifies pullback zones and potential entry points.
Consistency and Discipline are Crucial: The hardest part of trading is not knowing the settings but patiently waiting for alignment of the tide, trend, and timing lines, and resisting impulsive trades.
When to use EMA or SMA: Shorter time frames use EMAs for faster reaction to price changes, whereas longer time frames use SMAs to smooth out noise and emphasize broader trends. The 200-day SMA is particularly important as it is the most widely followed moving average, creating real support/resistance due to collective market attention.
Examples and Practical Application:
- A trader looking for a long trade on the daily chart might identify:
- Price above a rising slope 200 SMA (tide) = only look for long trades
- Price above a rising slope 50 SMA (trend) = confirms a healthy trend
- Price pulls back to 20 EMA (timing zone) = start watching for price action confirming the entry
- Crossovers like the "golden cross" (50 SMA crossing 200 SMA) are only contextual signals indicating trend shifts, don't use them as entry triggers.
- On faster charts (1-hour and 30-minute), multiple touches of moving averages happen frequently due to noise; thus, confirmation from price action, volume, or other indicators is essential.
The core takeaway here is that knowing precise moving average numbers is easy. Mastering the **patience, discipline, and risk management** to trade only when the tide, trend, and timing all align is what really separates successful traders from losing ones. 지표

지표