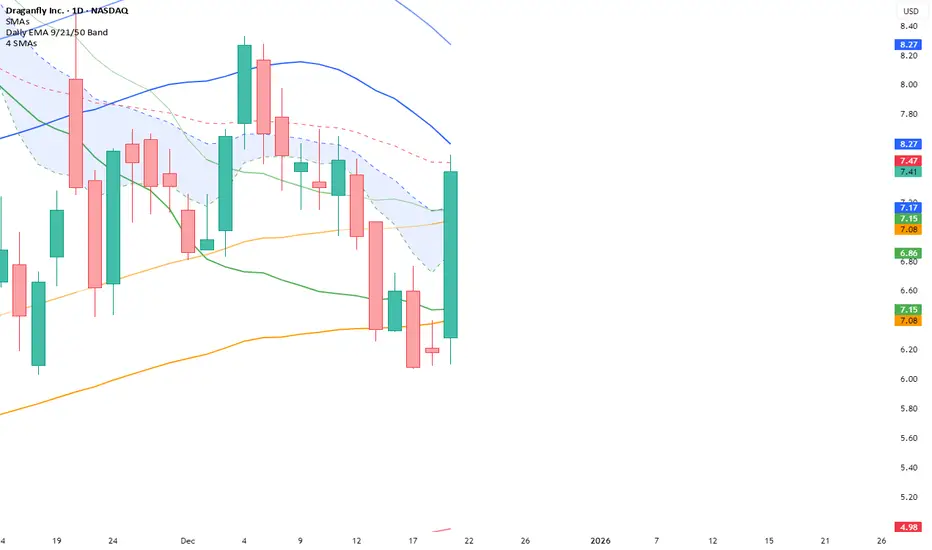
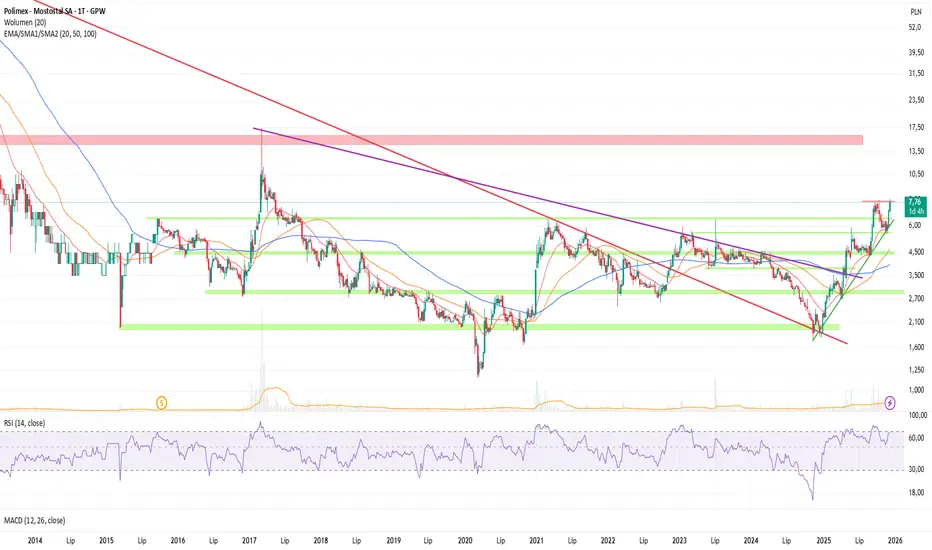
GK1 Long only Daily Trend Strategy Max 4 Positions Risk-BasedThis strategy buys strong uptrends on the daily chart, risks a fixed % of capital per trade, limits how many trades are open at once, and exits using a trailing volatility stop or when the trend weakens.
What kind of market does this work best in?
1.Strong, persistent trends
2.Index ETFs, sector ETFs, large-cap stocks
3.Bull markets or strong sector rotations
It will underperform in:
Sideways markets
Choppy ranges
High-frequency reversals
The market condition this is looking for " A healthy, established uptrend"
It only goes LONG (no shorts) and only when all of these are true:
Short-term trend is up:
14-day moving average > 50-day moving average
Long-term trend is bullish:
Price is above the 200-day moving average
Primary trend is improving:
200-day MA is rising (today > yesterday)
Volume is normal (not dead, not crazy):
Avoids illiquid days and blow-off spikes
Translation: “I only buy when the market is already strong and behaving normally.”
It can hold up to 4 positions at the same time
Designed for multiple signals across time, not over-trading
You choose a Risk % per trade (default = 1%)
That means: If the stop loss is hit, you lose ~1% of your total account
It uses ATR (Average True Range):
ATR measures how much the market normally moves
Stop loss = 2.5 × ATR
Position size =
(1% of account) ÷ stop distance
So:
Volatile market → smaller position
Calm market → bigger position
Exit #1: Trailing ATR stop (main exit)
Tracks the highest close since entry
Stop moves up only, never down
If price reverses by ~2.5 ATR → exit
📌 Translation:
“Let winners run, cut losers automatically.”
Exit #1: Trailing ATR stop (main exit)
Tracks the highest close since entry
Stop moves up only, never down
If price reverses by ~2.5 ATR → exit
📌 Translation:
“Let winners run, cut losers automatically.”
전략

지표
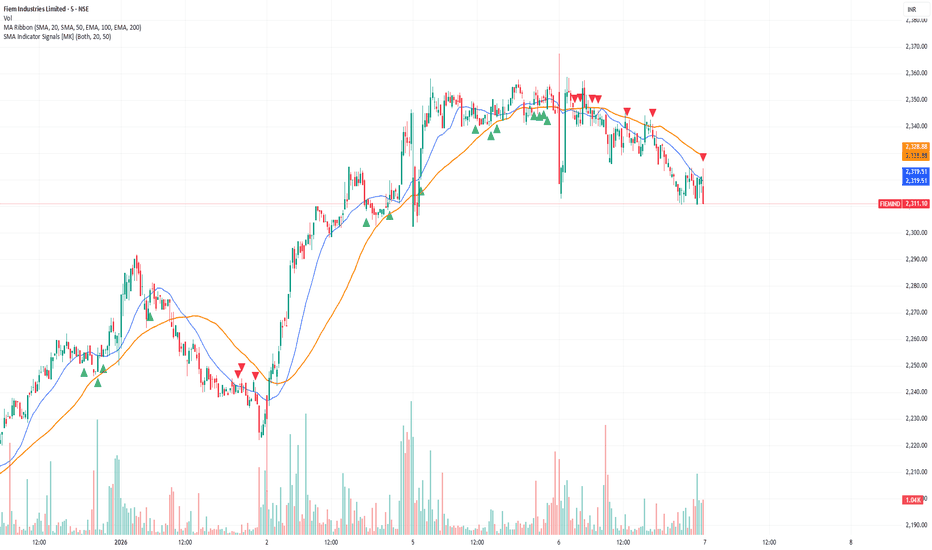
MA Momentum Score by WizkaThis is my explorative study script which I have named as MA Momentum Score. It calculates one score number (-10,+10) to describe the price and MA structure. It gives points on the order and direction of price and three moving averages so that bullish order (Price>MA20>MA50>MA200) gives +1 point to each pair, and bearish order gives -1 point. There are 6 comparisons (price and 3 MAs against each other). Addition to this +1 point is given if the direction of each is upwards, and -1 if downwards. So, altogether score can be from -10p (fully bearish structure) to +10p (fully bullish structure). This is shown as blue line in the indicator. It uses classic SMAs of 20,50,200 and it is called Slow score. Next, the similar score is calculated for faster MAs (5,12,26) and it is called Fast score (orange line). Finally, the differential Fast-Slow is calculated and visualized as histogram. Green, when Fast>Slow (bullish), and Red, when Fast 지표

지표
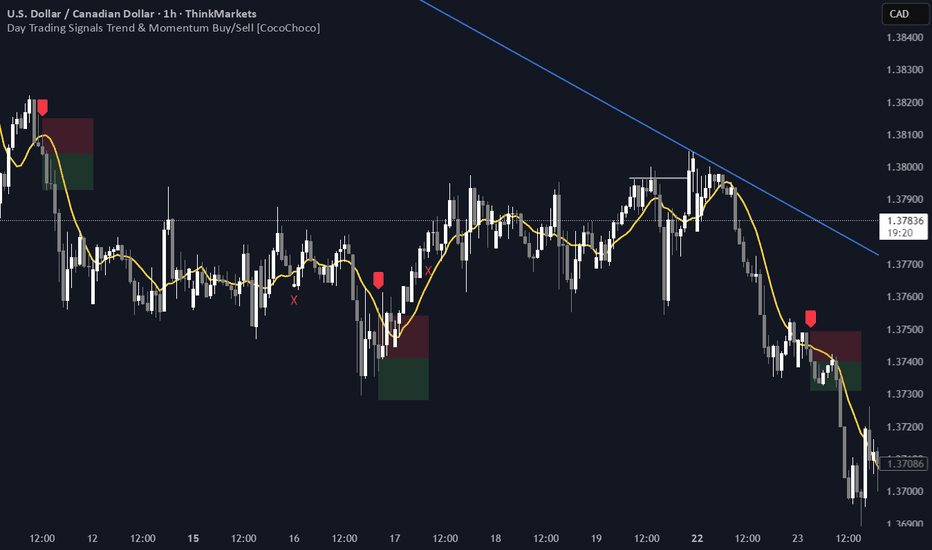
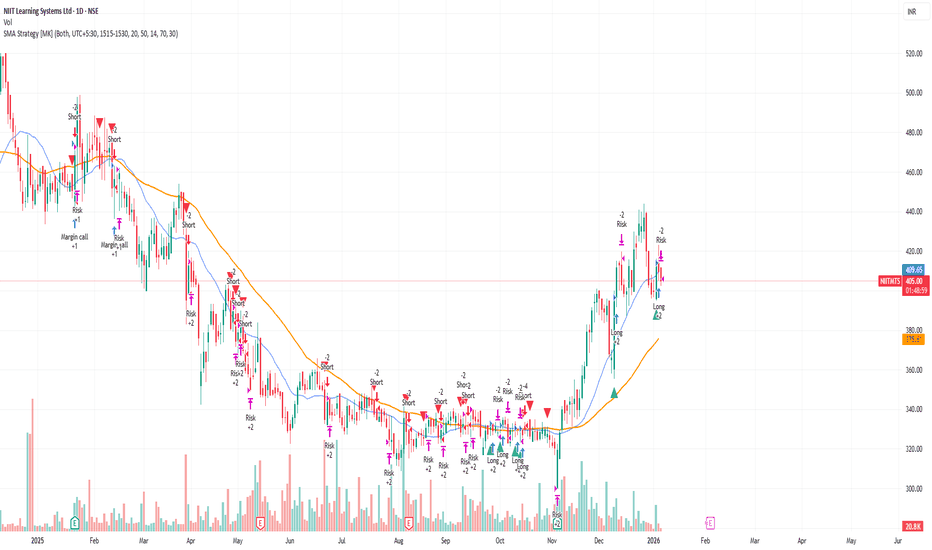
SMA Strategy [MK]Overview
This strategy is a momentum-based trend-following system designed to capture sustained market moves while minimizing "whipsaws" often found in sideways markets. It utilizes a dual-SMA filter for trend direction, a precise price-crossover trigger for entry, and the Average Directional Index (ADX) to gauge market strength.
How It Works
The strategy follows a strict "Trend + Momentum + Strength" hierarchy:
1. Trend Identification (The Filter) The script uses a Fast SMA (20) and a Slow SMA (50).
Long Bias: SMA-20 > SMA-50.
Short Bias: SMA-20 < SMA-50.
2. Precise Entry (The Trigger) Unlike strategies that enter simply because the price is above a line, this script requires a Price Crossover.
Long Entry: Price must actively cross from below to above the SMA-20.
Short Entry: Price must actively cross from above to below the SMA-20.
3. Trend Strength (The ADX Gatekeeper) To solve the problem of sideways markets where moving averages run parallel, we’ve integrated the ADX (Average Directional Index). The strategy will only trigger a trade if the ADX is above a user-defined threshold (default is 25), ensuring we only enter when the market is trending.
4. RSI Safety Filter To prevent "buying the top" or "selling the bottom," the RSI checks for overextended conditions. It prevents long entries if the RSI is already overbought and short entries if it is oversold.
Exit Logic
The strategy features three layers of protection:
Trend Reversal Exit: Closes the position if the price crosses back over the SMA-20 while the macro trend (SMA-20/SMA-50) has flipped.
Fixed Take Profit: A percentage-based target to lock in gains during sharp moves.
Fixed Stop Loss: A percentage-based safety net to protect capital.
Key Features
Directional Selector: Choose between "Long Only," "Short Only," or "Both."
Visual Feedback: Background colors highlight "Trending" (Green) vs "Sideways" (Red) market regimes.
Fully Customizable: All lengths and thresholds for SMAs, RSI, and ADX can be adjusted to fit different assets and timeframes.
Instructions for Use
Timeframe: This strategy is optimized for trending timeframes such as the 1-Hour (1H), 4-Hour (4H), or Daily (D). Using it on very low timeframes (1-minute or 5-minute) may increase the number of false signals due to market noise.
Asset Classes: Best suited for high-volume assets like Major Forex Pairs, Large-Cap Stocks, and Blue-Chip Cryptocurrencies.
Parameter Tuning: Use the "Strategy Tester" to find the ideal ADX Threshold for your specific asset. Volatile assets usually require a higher ADX (30+) to filter out fake breakouts.
Disclaimer
Financial Risk Warning: The script provided is for educational and informational purposes only. Trading involves significant risk, and there is always the potential for loss. Past performance, whether simulated or real, is not a guarantee of future results.
The author of this script is not a financial advisor. This indicator is not a signal service or a recommendation to buy or sell any security. Always perform your own due diligence and test any strategy thoroughly on a demo account before risking live capital. By using this script, you acknowledge that you are solely responsible for your trading decisions and any resulting financial outcomes. 전략
지표

Momentum Trend & Ignition DashboardDescription
Rationale & Originality Traders often struggle with chart clutter, needing separate indicators for Moving Averages, Volume anomalies, and Fundamental stats (like 52-week highs or Float). This script solves this problem by creating a unified "Momentum Dashboard." It is not just a collection of averages; it is a purpose-built tool for Breakout and Trend Following strategies (such as CAN SLIM or VCP).
The uniqueness of this script lies in its "Confluence Logic": it allows a trader to instantly validate a setup by checking three pillars simultaneously without changing tabs:
Trend: Are the key MAs (20, 50, 100, 200) stacked correctly?
Ignition: Is there a "Power Play" (Big Price Move + Heavy Volume) occurring right now?
Stats: Is the stock near its 52-week high, and does it have a supportive Up/Down Volume Ratio?
How It Works (Detailed Calculations)
1. Custom Trend Ribbon (4x MA Mix):
The script plots 4 independent Moving Averages.
Innovation: Unlike standard inputs, each MA can be individually toggled between SMA (Simple) or EMA (Exponential). This allows traders to mix "Fast" trend lines (e.g., 10 or 20 EMA) with "Slow" institutional lines (e.g., 50 or 200 SMA) in one overlay.
2. "Purple Dot" Ignition Detection:
This features a custom detection algorithm for "Ignition Bars."
Logic: It compares the current candle's Close to the previous Close. If the move exceeds a user-defined threshold (default 5%) AND the Volume exceeds a fixed liquidity threshold (default 500k), a Purple Dot is plotted.
This filters out "low volume drift" and highlights true institutional participation.
3. Relative Volume (RVol) Engine:
Calculates the ratio of Current Volume to the 50-period SMA of Volume.
Visuals: If the ratio exceeds the user threshold (e.g., 1.5x average), the dashboard highlights the data, and optionally the chart bars, alerting the trader to unusual activity.
4. Statistical Dashboard (Data Panel):
Using request.security, the panel fetches daily timeframe data regardless of the chart view.
52-Week & 13-Week H/L: Calculates the percentage distance from these key levels to gauge overhead supply.
U/D Ratio: Calculates the sum of volume on "Up Days" vs. "Down Days" over 50 periods. A value > 1.0 suggests institutional accumulation.
Float %: (Stocks Only) Fetches financial data to show the percentage of shares available for trading.
How to Use This Script
This script is designed for Trend Following and Breakout Trading:
The Setup: Use the Data Panel to find stocks with a U/D Ratio > 1.0 and price within 15% of the 52-Week High.
The Trend: Ensure price is above the MA 2 (set to 50 SMA) and MA 4 (set to 200 SMA) to confirm a Stage 2 uptrend.
The Trigger: Watch for the Purple Dot.
If a Purple Dot appears as price breaks out of a consolidation (base), it confirms institutional buying.
Use the RVol panel to confirm that volume is at least 1.5x normal levels.
Risk Management: Use the MA 1 (set to 20 EMA) as a trailing stop-loss during strong trends.
Settings & Configuration
MAs: Fully adjustable Length and Type (SMA/EMA).
Big Move (Purple Dot): Adjust the % Move based on asset volatility (e.g., use 3% for Large Caps, 10% for Crypto).
Table: The data panel is fully dynamic. You can toggle specific rows (like Float or SMA distance) On/Off to save screen space, and position it anywhere on the chart.
Credits & References
The concept of Relative Volume (RVol) and U/D Ratio is derived from standard Volume Analysis used by William O'Neil.
The "Big Move" combined with Volume thresholds is based on standard Volume Spread Analysis (VSA) concepts regarding "Effort vs. Result."
Financial data fetch (Float) utilizes TradingView's built-in financial() library. 지표

SMAcross-mvrOverview
SMAcross-mvrNew is a flexible, non-repainting moving-average strategy designed for clarity, configurability, and reliable backtesting.
It supports multiple entry styles, optional layered exits, and full-capital position sizing, while remaining stable during chart zooming and dragging.
🚀 What’s New in v2
✅ Multiple Entry Modes
You can now choose how trades are entered:
Entry Mode A: Short SMA crosses Long SMA
Entry Mode B: Price crosses Long SMA
This allows both classic MA-crossover trading and trend-continuation pullback entries using the same strategy.
✅ Modular Exit System (Checkbox-Based)
Exit logic is now fully modular using independent checkboxes:
☑ Exit on opposite signal
☑ Exit when price closes beyond Short SMA
You may enable one, both, or neither.
If both are enabled, the strategy exits on whichever condition occurs first.
✅ Terminology Clarity
All labels, inputs, and alerts now use semantic naming:
Short SMA (formerly 13 SMA)
Long SMA (formerly 30 SMA)
This makes the strategy easier to understand and future-proof if SMA lengths are changed.
✅ Full-Capital Position Sizing
Each trade uses 100% of available equity, allowing performance to naturally compound over time during backtests.
✅ Optional Visual Enhancements
Optional cross price labels (can be toggled on/off)
Color-filled zone between Short and Long SMAs for quick trend recognition
Optional 200 SMA (off by default) for higher-timeframe context
✅ Alert-Ready (TV-Safe)
All alerts use static messages compatible with TradingView’s alert system, making the strategy suitable for:
Manual trade notifications
Webhook-based automation
Broker integrations
🔒 Design Principles
No repainting
No line continuations (TradingView-safe formatting)
Stable behavior when zooming or scrolling
Clear separation of entry logic, exit logic, and visuals
⚠️ Notes
This script is intended for educational and research purposes.
Always forward-test and apply proper risk management before live trading. 전략

지표

Multi-MA SuiteMulti-MA Suite - Customizable Moving Averages Indicator
Overview
Multi-MA Suite is a comprehensive moving average indicator that combines both Exponential Moving Averages (EMAs) and Simple Moving Averages (SMAs) in a single, highly customizable tool. Designed for traders who rely on multiple timeframe analysis, this indicator provides up to 9 moving averages (5 EMAs + 4 SMAs) with full control over visibility, color schemes, and parameters.
Key Features
✓ Dual MA Types:
5 Exponential Moving Averages (EMAs) - Responsive to recent price action, ideal for short to medium timeframes
4 Simple Moving Averages (SMAs) - Slow and stable, specifically designed for long timeframe analysis
✓ Full Customization:
Individual toggle switches to show/hide each moving average
Custom color picker for each MA line
Adjustable length and source for all moving averages
Progressive line width (thicker lines for longer periods)
✓ Pre-configured Defaults:
EMA: 9, 21, 50, 100, 200 (common swing trading periods)
SMA: 50, 100, 200, 300 (institutional reference levels for long-term trends)
Color-coded scheme: Warm colors (yellow-orange) for EMAs, Cool colors (blue-purple) for SMAs
✓ Clean Interface:
Organized input groups for easy navigation
Clear labeling and logical parameter ordering
Minimal chart clutter with toggle controls
Key Difference - Speed & Timeframe:
EMAs: Fast and reactive → Best for short to medium timeframes (1-min to 4-hour charts)
SMAs: Slow and smooth → Best for long timeframes (daily, weekly, monthly charts)
Recommended Settings
Day Trading (Short Timeframes):
Focus on EMAs: 9, 21, 50
Use 1-minute to 15-minute charts
SMAs react too slowly for intraday timeframes
Swing Trading (Medium Timeframes):
Use all EMAs with SMA 50 and 200
1-hour to daily charts work best
Mix of EMAs for entries, SMAs for trend context
Position Trading (Long Timeframes):
Focus primarily on SMAs: 50, 100, 200, 300
Daily to weekly charts recommended
SMAs excel here due to their slow, stable nature
Can add EMA 200 for comparison
Investment Analysis (Very Long Timeframes):
SMAs only: 100, 200, 300
Weekly to monthly charts
SMA's slow calculation filters noise perfectly for long-term trends
EMA Timeframe-Specific Recommendations
📌 Important Notes on EMA Usage by Timeframe:
Small Timeframes (5-minute and 15-minute charts):
Use 9 EMA and 21 EMA
These fast EMAs respond quickly to price changes
Perfect for scalping and day trading
The 9/21 EMA crossover is a popular day trading strategy
Medium Timeframes (1-hour to 4-hour charts):
Use 21 EMA and 50 EMA
Balances responsiveness with trend reliability
Ideal for swing trading and intraday position holding
The 21/50 EMA combination filters out noise while staying responsive
Long Timeframes (Daily and Weekly charts):
Use 50 EMA and 200 EMA
The classic trend-following combination
50 EMA for medium-term trend, 200 EMA for major trend
The 50/200 EMA crossover is known as the "Golden Cross" (bullish) or "Death Cross" (bearish)
For very long-term analysis on these timeframes, consider using SMAs instead
Quick Reference Guide:
5m / 15m: EMA 9 & 21
1h / 4h: EMA 21 & 50
1D / 1W: EMA 50 & 200 (or switch to SMAs for even smoother signals)
Practical Trading Strategy with EMAs
📌 Why Use EMAs for Active Trading:
For active trading, use EMAs because they have faster movement compared to SMAs. This faster response to price changes allows you to catch trends earlier and exit trades before major reversals occur.
Three-EMA Trading System:
1. 9 EMA - Quick Trend Recognition:
Use the 9 EMA to understand the trend quickly
When price is above 9 EMA = Short-term uptrend
When price is below 9 EMA = Short-term downtrend
The 9 EMA reacts immediately to price momentum changes
Perfect for entry timing and quick trend identification
2. 21 EMA - Exit Signal and Trend Confirmation:
When the 21 EMA breaks (price crosses it), exit your trade
This is critical because when the 21 EMA breaks, the trend will likely reverse
The 21 EMA acts as your "stop-loss line"
Breaking the 21 EMA signals that the short-term momentum has shifted
Example: In an uptrend, when price crosses below 21 EMA, exit longs immediately
Example: In a downtrend, when price crosses above 21 EMA, exit shorts immediately
3. 50 EMA - Full Correction Understanding:
Use the 50 EMA to understand the complete correction
The 50 EMA shows where the full pullback or correction might end
When price reaches the 50 EMA, it often bounces (in a strong trend)
Breaking the 50 EMA indicates a deeper correction or potential trend reversal
Use it to gauge the strength of the overall trend
Customization Tips
Toggle unnecessary MAs off to reduce chart clutter based on your trading style and timeframe
For the 3-EMA trading strategy, enable only 9, 21, and 50 EMAs
For long timeframes (daily+), disable EMAs and use only SMAs to avoid over-reactive signals
Match your EMA selection to your timeframe using the guide above
Adjust colors to match your chart theme or to highlight specific MAs
Modify lengths to fit specific market conditions or asset volatility
Change source from close to high/low/HL2 for alternative perspectives
Use thicker lines for key decision MAs (edit linewidth in settings)
Color Scheme Rationale
EMAs (Warm Colors):
Yellow → Orange progression represents increasing timeframes while maintaining visual cohesion. The warm palette signals "active" or "fast-reacting" nature of EMAs, perfect for shorter timeframes and active trading.
SMAs (Cool Colors):
Blue → Purple progression provides clear visual distinction from EMAs. The cool palette suggests "stable," "slow," and "smooth" characteristics of SMAs, ideal for long timeframe analysis.
What Makes This Different?
Unlike basic MA indicators, Multi-MA Suite provides:
Both EMA and SMA in one indicator (saves indicator slots)
Optimized MA selection based on speed characteristics - fast EMAs for short timeframes, slow SMAs for long timeframes
Clear timeframe-specific EMA recommendations for immediate use
Practical trading strategy included - 9 EMA for trend, 21 EMA for exit, 50 EMA for corrections
Individual control over each MA (toggle, color, parameters)
Thoughtful default settings based on widely-used trading periods
Color-coded system for instant visual differentiation
Clean, organized interface for efficient workflow
Installation & Usage
Add the indicator to your chart
Open indicator settings to customize
For active trading: Enable 9, 21, and 50 EMAs (the recommended trading system)
Select appropriate MAs for your timeframe (use the EMA timeframe guide above)
Toggle MAs on/off based on your analysis needs
Adjust colors if desired to match your chart theme
Modify lengths and sources as needed for your strategy
⚠️ IMPORTANT DISCLAIMER
EDUCATIONAL AND INFORMATIONAL PURPOSES ONLY
This indicator and its accompanying documentation are provided for educational and informational purposes only. The content does not constitute financial advice, investment advice, trading advice, or any other sort of advice, and you should not treat any of the indicator's content as such.
NO GUARANTEE OF RESULTS
Past performance is not indicative of future results. The strategies, techniques, and concepts discussed herein are provided "as is" without any warranty of any kind. Trading and investing in financial markets involves substantial risk of loss and is not suitable for every investor.
RISK ACKNOWLEDGMENT
You can lose money trading: Trading stocks, forex, futures, options, cryptocurrencies, and other financial instruments carries a high level of risk and may not be suitable for all investors. You may sustain a total loss of your investment.
No guaranteed profits: The use of moving averages or any technical indicator does not guarantee profitable trades. Markets can remain irrational longer than you can remain solvent.
Lagging indicators: All moving averages are lagging indicators based on historical price data and may not predict future price movements.
False signals: Moving averages can produce false signals, especially in choppy, sideways, or low-volume market conditions.
YOUR RESPONSIBILITY
Do your own research: Before making any trading or investment decision, you should conduct your own research and due diligence.
Consult professionals: Consider seeking advice from qualified financial advisors, certified public accountants, or licensed professionals before making financial decisions.
Risk management: Always use proper risk management, including stop-losses, position sizing, and diversification.
Demo trading: Test any strategy on a demo account before risking real capital.
Understand the markets: Ensure you fully understand the markets you're trading and the risks involved.
PERSONAL TRADING DECISIONS
All trading decisions are made at your own discretion and at your own risk. You are solely responsible for all trading decisions you make. The strategies mentioned (including the 9/21/50 EMA system) are examples only and should not be followed blindly without proper testing and risk assessment.
MARKET CONDITIONS VARY
Market conditions change constantly. What works in one market condition may not work in another. Trending strategies (like the ones discussed) typically perform poorly in ranging markets. Adapt your approach based on current market conditions.
USE AT YOUR OWN RISK
By using this indicator, you acknowledge that you have read this disclaimer and agree to be bound by its terms. If you do not agree with any part of this disclaimer, do not use this indicator. 지표

지표
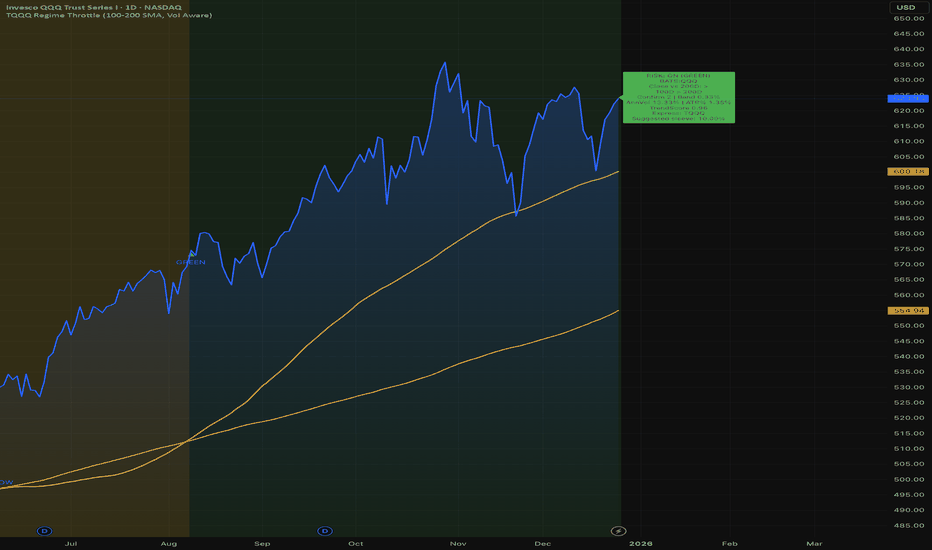
MA 8-13-21-55-89-144-233MA 8-13-21-55-89-144-233 — Multi-Layer Trend & Momentum Framework
This indicator is designed for traders who want to read market structure, trend direction, and momentum at a glance using a clean and professional multi-moving average setup.
Why These Periods?
The periods 8, 13, 21, 55, 89, 144, 233 are:
Fibonacci-based
Commonly used by professional and institutional traders
Highly effective for separating momentum, pullbacks, and macro trend
This structure allows you to track short-term speed, medium-term trend, and long-term market bias on a single chart.
How to Use
Trend Direction
Price above MA 55 / 89 / 144 / 233 → bullish market structure
Price below them → bearish market structure
Momentum & Entries
MA 8 – 13 – 21
Short-term momentum and aggressive entry zones
MA 21 – 55
Healthy pullback and continuation areas within a trend
Trend Strength
Well-aligned and expanding MAs → strong trend
Compressed MAs → ranging or indecisive market
Who Is This For?
Intraday traders
Swing traders
Price Action + MA traders
Traders who prefer structure over clutter
Important Note
This indicator does not generate buy/sell signals by itself.
Best results are achieved when combined with:
Candlestick patterns
Support & resistance
Pure price action
Clean chart. Clear structure. Multi-timeframe awareness.
Know where the trend is, where momentum shifts, and when the market is compressing — all in one view. 지표

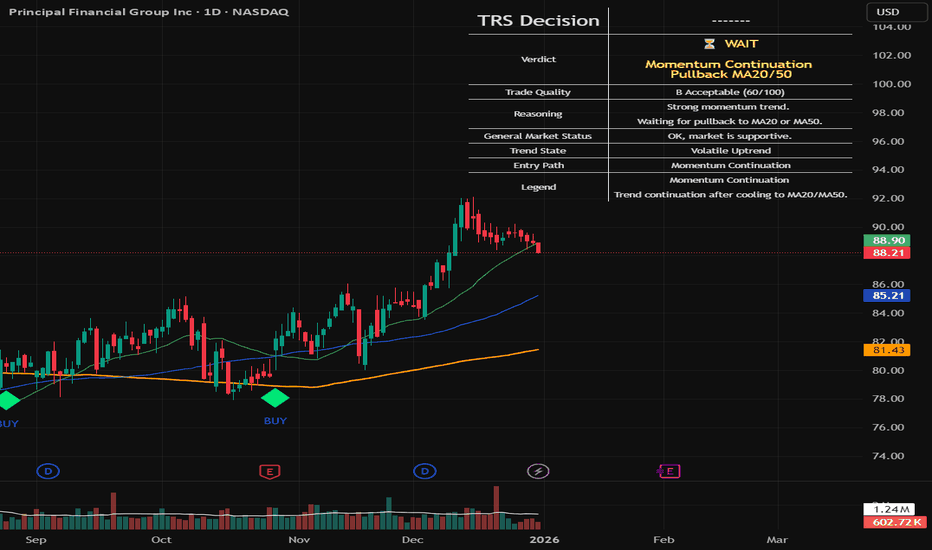
TRS (Trend Readiness System)TRS – Trend Readiness System
TRS (Trend Readiness System) is a trend-aligned trading framework designed to help you identify stocks that are becoming ready for entry , not just those already breaking out.
Instead of producing noisy buy/sell signals, TRS evaluates trend quality, pullback structure, momentum rebuilding, and market context , and converts them into clear scores, states, and timing awareness — both on the chart and inside the TradingView Screener.
---
Core Philosophy
Strong trends don’t start at the breakout — they start when conditions quietly align.
TRS focuses on:
• Primary trend alignment
• Healthy pullbacks above long-term support
• Early momentum recovery
• Market regime confirmation
• Entry timing (fresh vs late)
---
What TRS Measures
1. Setup Score (Trend Quality)
Answers the question: “Is this stock structurally worth watching?”
Based on:
• Price position relative to MA150
• Long-term trend direction
• Higher-low structure
• Distance from MA150 (overextension control)
• Market regime (bullish / bearish)
---
2. Entry Score (Timing Quality)
Answers the question: “Is the timing right — or still early?”
Based on:
• Short and mid-term moving averages
• Pullback behavior
• Momentum stabilization
• Volume confirmation
---
3. General Score
A combined readiness score used for ranking in the TradingView Screener:
General Score = Setup Score + Entry Score
---
Entry State Tracking (Key Feature)
TRS tracks the full entry lifecycle , not just signals:
• Valid Entry
• Pending Entry (almost ready)
• Bars Since Valid Entry
• Entry Window (Fresh / Expired)
• Entry Still Valid (Yes / No)
This helps avoid chasing late or already-played setups.
---
Market Regime Filter
Signals automatically adapt to overall market conditions:
• Market trend confirmation (e.g. SPY / QQQ)
• Reduced false signals during weak markets
• Clear explanation when setups are blocked
---
Visual Dashboard (Optional)
The on-chart dashboard can display:
• General Score
• Market state
• Setup quality
• Entry status
• Entry window
• Bars since entry
• Blocking reason (if any)
You can switch between:
• Minimal mode – essential info only
• Full table mode – detailed diagnostics
---
Screener Integration
TRS exposes clean numeric outputs for the TradingView Pine Screener:
• Setup Score
• Entry Score
• General Score
• Pending Entry (1 / 0)
• Valid Entry (1 / 0)
• Bars Since Valid Entry
• Market Bullish (1 / 0)
Example Screener Filters:
• Setup Score ≥ 50
• Pending Entry = 1
• Bars Since Valid Entry ≤ 3
• Market Bullish = 1
---
How to Use TRS (Daily Routine)
Step 1 – Scan
• Look for high Setup Score
• Prefer Pending Entry = 1
Step 2 – Review
• Confirm pullback quality
• Check MA150 support
• Observe momentum rebuilding
Step 3 – Act
• Enter only on Valid Entry
• Avoid expired entry windows
• Skip setups blocked by market regime
---
What TRS Is NOT
• Not a breakout chaser
• Not a day-trading system
• Not signal spam
TRS is a decision-support system for swing and position traders who value structure, context, and timing.
---
Best Used On
• Daily timeframe (1D)
• Liquid stocks & ETFs
• Trend-following strategies
• Portfolio-level screening
---
지표
지표

지표

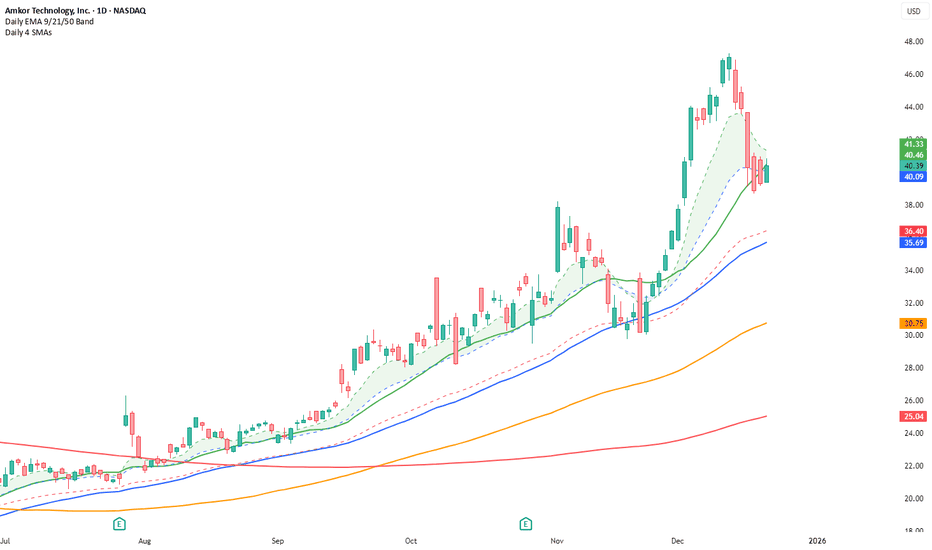
Daily SMA 20/50/100/200Simple Moving Averages indicator displaying four commonly used trend lines on the price chart. Plots the 20, 50, 100, and 200 period SMAs to help identify short-, medium-, and long-term trend direction, dynamic support and resistance, and overall market structure. Color-coded for clarity: 20 SMA in green, 50 SMA in blue, 100 SMA in orange, and 200 SMA in red, with uniform line thickness for clean visual consistency. 지표

Daily SMA 20/50/100/200Simple Moving Averages indicator displaying four commonly used trend lines on the price chart. Plots the 20, 50, 100, and 200 period SMAs to help identify short-, medium-, and long-term trend direction, dynamic support and resistance, and overall market structure. Color-coded for clarity: 20 SMA in green, 50 SMA in blue, 100 SMA in orange, and 200 SMA in red, with uniform line thickness for clean visual consistency. 지표
Daily SMA 20/50/100/200Simple Moving Averages indicator displaying four commonly used trend lines on the price chart. Plots the 20, 50, 100, and 200 period SMAs to help identify short-, medium-, and long-term trend direction, dynamic support and resistance, and overall market structure. Color-coded for clarity: 20 SMA in green, 50 SMA in blue, 100 SMA in orange, and 200 SMA in red, with uniform line thickness for clean visual consistency. 지표

지표

지표

지표

Trinity Ultimate 10 MA Ribbons)I got tired of trying to find a multi MA ribbon that could also color change and allow different types, if it exists then I could not find it... So here it is...
The **Trinity Ultimate 10 MA Ribbon** is a highly customizable, professional-grade moving average ribbon that combines extreme flexibility with beautiful visual feedback. Designed for traders who want full control without sacrificing clarity, it allows you to build a ribbon using up to ten completely independent moving averages — each with its own length, type, color, thickness, and visibility setting — while automatically coloring both the lines and the fills according to bullish or bearish conditions.
### Key Features
- Ten fully independent moving averages that can be mixed and matched exactly as you want.
- Each MA has its own selectable type: EMA (default), SMA, WMA, HMA, RMA, VWMA, or ALMA — perfect for combining fast EMAs with a slow HMA or a classic 200-period SMA.
- Every single MA line automatically changes color in real time: bright green when price is above the MA (bullish) and red when price is below the MA (bearish), making trend strength instantly visible across all timeframes.
- Smart, reactive ribbon fills that appear only between consecutive enabled MAs. Turn any MA on or off and the fills instantly adjust — no gaps, no broken bands, no manual rework.
- Nine layered fills with individually adjustable transparency (default is gradually increasing transparency from the fastest to the slowest MA), creating a smooth, depth-like ribbon effect that looks stunning on any chart background.
- Fill color itself is dynamic: green for bullish candles (close > open) and red for bearish candles, or you can customize both colors to any shade you prefer.
- Full control over every visual element: base colors, line thickness (1–10), lengths, and show/hide toggles for each of the ten MAs.
- Clean and lightweight code that compiles instantly in Pine Script v5 and works on all markets and timeframes without lag.
In short, this is the most flexible and visually informative moving-average ribbon available on TradingView today. Whether you want a classic 9-EMA ribbon, a Guppy-style multiple-timeframe setup, a hybrid EMA/HMA mix, or just three or four key levels, the indicator adapts perfectly while always telling you at a glance where the bulls and bears are in control. 지표

ShooterViz Lazy Trader EMA SystemShooterViz Lazy Trader EMA System - Complete User Guide
What This Script Does
This is a position scaling indicator that tells you exactly when to enter, add to, and exit trades using a simplified 5-EMA system. It removes the guesswork and decision fatigue from trading by giving you clear visual signals.
The Core Concept
3 entry signals that build your position from 20% → 50% → 100%
2 exit signals that scale you out at 50% → 50% (complete exit)
1 higher timeframe filter that keeps you on the right side of the trend
No Fibonacci calculations, no RSI divergence, no multi-indicator confusion. Just EMAs and price action.
What You'll See On Your Chart
1. Colored EMA Lines
Blue Lines (Entry Zone):
3 EMA (lightest blue) - Early reversal detector
5 EMA (darker blue) - Confirmation line
Green Lines (Add Zone):
21 EMA (bright green) - First add location
34 EMA (lighter green) - Final add location
Red Lines (Exit Zone):
89 EMA (lighter red) - First exit trigger
144 EMA (darker red) - Final exit trigger
Orange Lines (Hyper Frame - optional):
Hyper 21 EMA (from higher timeframe) - Trend direction
Hyper 34 EMA (from higher timeframe) - Bias confirmation
2. Triangle Signals
Green Triangles (Below Price) = BUY/ADD:
Lime triangle with "20%" = Entry 1: Price reclaimed 3→5 EMA (starter position)
Green triangle with "30%" = Entry 2: Price bounced off 21 EMA (first add)
Teal triangle with "50%" = Entry 3: Price broke out from 34 EMA compression (final add)
Red Triangles (Above Price) = SELL:
Orange triangle with "50% OFF" = Exit 1: Price broke below 89 EMA (take half off)
Red triangle with "EXIT ALL" = Exit 2: Price broke below 144 EMA (close remaining position)
3. Background Color (Trend Bias)
Light green background = Hyper frame EMAs trending up (bias LONG)
Light red background = Hyper frame EMAs trending down (bias SHORT)
Gray background = Neutral/choppy (be cautious)
4. Info Table (Top Right Corner)
A live status dashboard showing:
Which entry signals are currently active (✓ or —)
Which exit signals are currently active (⚠ or ⛔)
Current hyper frame bias (🟢 LONG / 🔴 SHORT / ⚪ NEUTRAL)
Which timeframe you're using for hyper frame filtering
How to Install and Set Up
Step 1: Add the Script to TradingView
Open TradingView
Click "Pine Editor" at the bottom of the screen
Copy the entire script code
Paste it into the Pine Editor
Click "Add to Chart"
Step 2: Configure Your Settings
Click the gear icon ⚙️ next to "LazyEMA" in your indicators list.
Critical Settings to Configure:
Hyper Frame Selection (Most Important!)
Location: "Hyper Frame (Pick ONE)" section
Setting: "Timeframe"
What to choose:
Trading 15min or 1H charts? → Use "240" (4-hour)
Trading 4H or Daily charts? → Use "D" (Daily)
Trading Daily or Weekly charts? → Use "W" (Weekly)
Why this matters: This filter keeps you aligned with the bigger trend. Only take longs when this timeframe is green, shorts when it's red.
MA Type (Optional, default is fine)
Location: "MA Config" section
Default: EMA (recommended)
Options: EMA, SMA, WMA, HMA, RMA, VWMA
Most traders should stick with EMA
Visual Toggles (Customize your view)
Entry Zone: Turn individual EMAs on/off (3, 5, 21, 34)
Exit Zone: Turn individual EMAs on/off (89, 144)
Hyper Frame: Toggle the higher timeframe EMAs on/off
Step 3: Clean Up Your Chart
Turn OFF these if visible:
Volume bars (they clutter the view)
Any other indicators you have loaded
Grid lines (optional, but cleaner)
Keep ONLY:
Price candles
Your ShooterViz Lazy Trader EMA System
Maybe support/resistance levels if you manually draw them
How to Trade With This Script
The Basic Workflow
Before the Market Opens:
Check the background color and info table bias
Green background? Look for LONG setups only
Red background? Look for SHORT setups only
Gray background? Stay flat or trade small
During the Trading Session:
LONGS (When hyper frame is bullish):
Wait for Entry 1 signal:
Lime triangle appears with "20%"
Price has reclaimed the 5 EMA after dipping to 3 EMA
Action: Enter 20% of your intended position
Stop loss: Place below the 5 EMA or recent swing low
Wait for Entry 2 signal:
Green triangle appears with "30%"
Price pulled back to 21 EMA and bounced
Action: Add 30% more (you're now at 50% total)
Move stop: Trail it up to below 21 EMA
Wait for Entry 3 signal:
Teal triangle appears with "50%"
Price compressed at 34 EMA and broke out
Action: Add final 50% (you're now 100% loaded)
Move stop: Trail it up to below 34 EMA
Wait for Exit 1 signal:
Orange triangle appears with "50% OFF"
Price broke below 89 EMA
Action: Exit 50% of your position immediately
Move stop on rest: Trail to 89 EMA or lock in profits
Wait for Exit 2 signal:
Red triangle appears with "EXIT ALL"
Price broke below 144 EMA
Action: Exit remaining 50% (you're now flat)
Or: Stop gets hit at 89 EMA (same result)
SHORTS (When hyper frame is bearish):
Same process, but inverted
Triangles appear above price instead of below
Look for breakdowns below EMAs instead of bounces off them
Exit when price reclaims 89 and 144 EMAs
Real-World Example Walkthrough
Setup: Trading ES (S&P 500 Futures) on 1H Chart
Chart Configuration:
Timeframe: 1 Hour
Hyper Frame: 240 (4-hour)
Ticker: ES
Pre-Market Check:
Background is light green
Info table shows "🟢 LONG" for Hyper Bias
Decision: Only look for long entries today
9:30 AM - Market Opens
Price dips and touches 3 EMA
Watch for: Reclaim of 5 EMA
9:45 AM - Entry 1 Triggers
Lime triangle appears below bar
Price closed above 5 EMA at $4,550
Action taken:
Enter long 20% position (2 contracts if targeting 10 total)
Stop loss at $4,545 (below 5 EMA)
Risk: $10 per contract × 2 = $20 risk
10:30 AM - Entry 2 Triggers
Price rallied to $4,565, pulls back
Green triangle appears at 21 EMA ($4,555)
Action taken:
Add 30% (3 more contracts, now have 5 total)
Move stop to $4,550 (below 21 EMA)
Current P/L: +$25 ($5 gain on original 2 contracts, break-even on new 3)
11:15 AM - Entry 3 Triggers
Price consolidates at 34 EMA around $4,560
Teal triangle appears as price breaks to $4,568
Action taken:
Add final 50% (5 more contracts, now have 10 total)
Move stop to $4,555 (below 34 EMA)
Current P/L: +$70
1:00 PM - Price Extends
Price rallies to $4,595 (on track)
89 EMA is at $4,575
No action yet, let it run
2:15 PM - Exit 1 Triggers
Price pulls back from $4,600
Orange triangle appears as price breaks below 89 EMA at $4,580
Action taken:
Exit 50% (5 contracts closed at $4,580)
Keep 5 contracts with stop at 89 EMA ($4,575)
Banked: +$150 average gain on closed 5 contracts
2:45 PM - Exit 2 Triggers
Price continues down
Red triangle appears as price breaks 144 EMA at $4,570
Action taken:
Exit remaining 5 contracts at $4,570
Banked: +$100 on remaining 5 contracts
Final Results:
Total gain: $250 on the trade
Initial risk: $50 (if stopped out at Entry 1)
Risk/Reward: 5:1
Time in trade: ~5 hours
Common Questions
"What if I miss Entry 1? Can I still take Entry 2?"
Yes! Each entry is independent. If you miss the 3→5 reclaim, wait for the 21 EMA bounce. You'll start with a 30% position instead of 20%, but that's fine.
Rule: Never chase. Wait for the next EMA setup.
"What if multiple entry signals trigger at the same bar?"
Rare, but possible. If you see both Entry 1 and Entry 2 trigger together:
Take Entry 1 first (20%)
If the next bar confirms Entry 2 is still valid, add 30%
When in doubt, scale in gradually
"The hyper frame is green but I'm seeing short signals?"
Don't take them. The hyper frame is your bias filter. If it says "go long," ignore short setups. They're usually lower probability and will get stopped out.
"Can I use this for swing trading overnight?"
Absolutely. Just switch your hyper frame:
If you're on Daily charts, use Weekly hyper frame
If you're on 4H charts, use Daily hyper frame
Adjust position sizes for overnight risk
"What if the signal appears right at market close?"
Don't chase it. Wait for the next bar (next day) to confirm. Signals that appear in the last 5 minutes are often noise.
"How do I set up alerts?"
Right-click on the chart
Select "Add Alert"
Choose "LazyEMA" from the condition dropdown
Select which signal you want alerts for:
Entry 1: 3→5 Reclaim
Entry 2: 21 EMA Add
Entry 3: 34 EMA Breakout
Exit 1: 89 EMA Break
Exit 2: 144 EMA Break
Click "Create"
Pro tip: Set up all 5 alerts so you never miss a signal.
Position Sizing Guide see
swingtradenotes.substack.com
Critical Rule: Know your total risk BEFORE you take Entry 1. Don't wing it.
Customization Tips
For Day Traders (Scalpers)
Use 5min or 15min charts
Hyper frame: 1H or 4H
Expect 2-4 setups per day
Tighter stops (0.5% risk per entry)
For Swing Traders
Use 4H or Daily charts
Hyper frame: Daily or Weekly
Expect 1-2 setups per week
Wider stops (1-2% risk per entry)
For Position Traders
Use Daily or Weekly charts
Hyper frame: Weekly or Monthly
Expect 1-2 setups per month
Widest stops (2-3% risk per entry)
The "Don't Be Stupid" Checklist
Before taking ANY signal from this script, ask:
✅ Is the hyper frame bias pointing in my direction?
✅ Is the signal clean (not at a weird time or during news)?
✅ Do I know my stop loss level?
✅ Do I know my position size?
✅ Can I afford to lose if this trade fails?
If you answered "no" to ANY of these, skip the trade.
Troubleshooting
"I'm not seeing any signals"
Possible causes:
The "Show Lazy Trader System" toggle is off (turn it on)
Your chart timeframe is too high (try 1H or 4H)
Market is in a tight range (EMAs are compressed)
You need to refresh the chart
"Too many signals, getting whipsawed"
Fixes:
Increase your chart timeframe (go from 15m to 1H)
Switch to a less volatile ticker
Only trade when hyper frame bias is STRONG (not neutral)
Add a minimum bar count between signals
"The info table is covering my price action"
Fix:
Edit the script
Find the line: table.new(position.top_right, ...
Change position.top_right to position.bottom_right or position.top_left
"Signals appear then disappear"
This is normal (repainting). Some signals (especially compression breakouts) can disappear if the next bar reverses. This is why you:
Wait for bar close before acting
Use alerts that only fire on confirmed bars
Don't chase signals mid-bar
Final Thoughts
This script is a decision-making tool, not a crystal ball. It shows you high-probability setups based on EMA dynamics and trend structure. You still need to:
Manage your risk
Choose your position size
Stick to the rules
Accept losses when they happen
The system works when YOU work the system.
Print this guide, tape it next to your monitor, and follow it religiously for 20 trades before making ANY changes.
Good luck, and stay lazy (the smart way).
지표