Quad Stochastic Divergence Toolkit# Quad Stochastic Divergence Toolkit
## Short Description
A four-stochastic divergence toolkit designed to streamline the identification of bullish and bearish stochastic divergences across multiple stochastic speeds.
Inspired by concepts taught in Day Trading Rock Star's Quad Rotation Stochastic Divergence methodology.
---
# Full Description
## Quad Stochastic Divergence Toolkit
The **Quad Stochastic Divergence Toolkit** is a visual trading indicator designed to make it easier to monitor divergence across four stochastic oscillators simultaneously.
The indicator was created to streamline the process of identifying potential bullish and bearish stochastic divergences when using a multi-stochastic approach.
It is inspired by concepts I learned from **Day Trading Rock Star and the Quad Rotation Stochastic Divergence methodology**.
This is an independently developed TradingView tool and is **not an official Day Trading Rock Star indicator, product, or publication**.
### What the Indicator Shows
The indicator displays four independently configured stochastic oscillators in one pane.
Each stochastic can identify two types of regular divergence:
**Bullish / Long Divergence**
Price makes a **lower low** while the corresponding stochastic makes a **higher low**.
This can indicate that downside momentum is weakening even though price has continued lower.
**Bearish / Short Divergence**
Price makes a **higher high** while the corresponding stochastic makes a **lower high**.
This can indicate that upside momentum is weakening even though price has continued higher.
The indicator is intended as a visual analysis tool. A divergence is not, by itself, a trade entry or exit signal.
---
## Four Stochastic Speeds
The toolkit contains four stochastic oscillators with separate settings.
The default configuration uses:
**Stochastic 1**
Length: 9
K Smoothing: 1
D Smoothing: 3
**Stochastic 2**
Length: 14
K Smoothing: 1
D Smoothing: 3
**Stochastic 3**
Length: 40
K Smoothing: 1
D Smoothing: 4
**Stochastic 4**
Length: 60
K Smoothing: 1
D Smoothing: 10
Each oscillator is vertically offset so all four can be viewed clearly within the same indicator pane.
Users can modify the stochastic settings if they prefer a different configuration.
---
## Independent Long and Short Divergence Settings
One of the main purposes of this toolkit is to allow bullish and bearish divergence detection to be tuned independently.
Each stochastic contains two divergence detection groups:
**Div A** — shorter/smaller pivot structure
**Div B** — longer/larger pivot structure
For both Div A and Div B, bullish and bearish divergences have separate pivot settings.
For example:
Long Left A
Long Right A
Short Left A
Short Right A
This allows the user to use different pivot sensitivity for long and short divergences rather than forcing both directions to use identical settings.
The same independent controls are available for all four stochastic oscillators.
---
## Divergence Display
Bullish divergence lines are displayed in green/lime by default.
Bearish divergence lines are displayed in red/maroon by default.
Both the price divergence and the corresponding stochastic divergence are drawn so the relationship between price and momentum can be visually compared.
Div A and Div B can also use different:
* Colors
* Line widths
* Line styles
* Pivot sensitivities
This helps distinguish shorter-term divergence structures from larger ones.
---
## Value Labels
Each stochastic has a current-value label displayed near the right side of the oscillator.
The user can independently control:
* Whether the label is shown
* How many bars to the right of the current bar it appears
* The number/text color of the label
This helps keep the current stochastic readings visible without requiring the labels to sit directly on the most recent candle.
---
## Important: Pivot Confirmation
Divergences in this indicator are based on **confirmed pivot highs and pivot lows**.
A pivot cannot be confirmed until the selected number of **Right** bars has occurred.
For example, if a divergence uses a Right setting of 3, the pivot is not known until three bars after the actual pivot bar.
Once confirmed, the divergence line is drawn back to the originating pivot.
Therefore, a historical divergence line appearing on an earlier candle **does not mean the divergence was known on that candle in real time**.
The actual confirmation occurs only after the required right-side bars have completed.
Increasing the Right setting generally produces more selective pivot structures but also increases the amount of time required before a divergence can be confirmed.
---
## How I Use the Toolkit
The purpose of the indicator is to quickly see whether momentum across multiple stochastic speeds is diverging from price.
Rather than treating every divergence as a trade signal, I use the toolkit as a way of identifying areas that may deserve additional attention.
Possible additional considerations include:
* Market structure
* Support and resistance
* Trend direction
* Higher-timeframe context
* Price action
* Volume
* Session timing
* Risk/reward
* Other confirmation methods used in the trader's own process
Different traders may interpret stochastic divergence differently, so the indicator intentionally provides extensive configuration options rather than prescribing a single trading method.
---
## Customization
Each stochastic can be independently configured, including:
* Enable/disable oscillator
* Stochastic length
* K smoothing
* D smoothing
* Vertical offset
* Stochastic line color
* Value label visibility
* Value label horizontal offset
* Value label number color
* Bullish divergence enable/disable
* Bearish divergence enable/disable
* Independent Long Left/Right pivot settings
* Independent Short Left/Right pivot settings
* Div A settings
* Div B settings
* Divergence line colors
* Divergence line widths
* Divergence line styles
This makes it possible to use the indicator as a starting framework and then adapt it to a trader's own divergence methodology.
---
## Attribution
This indicator was independently developed as a tool to help streamline concepts I learned from **Day Trading Rock Star**, particularly the **Quad Rotation Stochastic Divergence** approach.
Credit for those educational concepts belongs to Day Trading Rock Star.
This TradingView implementation is my own tool for visualizing and organizing stochastic divergence and is not presented as an official Day Trading Rock Star product, indicator, endorsement, or publication.
Users interested in the original trading methodology should refer to Day Trading Rock Star's own educational material for his explanation and application of the strategy.
---
## Disclaimer
This indicator is provided for educational and analytical purposes only.
Divergence does not guarantee a market reversal and should not be interpreted as a prediction of future price movement.
Historical examples are not evidence of future performance.
The indicator does not provide investment advice, financial advice, or individualized trading recommendations.
Trading involves risk. Users are responsible for their own trading decisions, position sizing, risk management, and evaluation of any trading methodology.
# Release Notes — Version 1.0
**Quad Stochastic Divergence Toolkit — Initial Release**
Version 1.0 includes:
* Four independently configurable stochastic oscillators
* Vertically stacked stochastic display
* Bullish regular divergence detection
* Bearish regular divergence detection
* Separate Div A and Div B pivot structures
* Independent Long Left/Right pivot settings
* Independent Short Left/Right pivot settings
* Separate bullish and bearish divergence styling
* Price-chart divergence lines
* Stochastic-pane divergence lines
* Adjustable stochastic value-label positioning
* Selectable hover-label number colors
* Independent controls for all four stochastic oscillators 지표

지표

StackLight MTF | MTF Momentum Stack + Stochastic ConfluenceThe strategy only fires a signal when three timeframes of your choosing — fast, medium, and slow — all agree on direction. Each timeframe is scored bullish, bearish, or neutral using either RSI or EMA slope, and displayed as a live 3-light traffic signal in the corner of your chart. Green means go, red means no — and when all three lights match, the strategy arms itself for entry.
Once the stack is aligned, entries are triggered by a stochastic %K/%D crossover on your chart timeframe, confirmed by a linreg-smoothed stochastic on your slowest timeframe — so you're not just trading a momentum cross in isolation, you're trading one that's backed by higher-timeframe agreement.
Risk is handled with ATR-based stops and targets, and position size adjusts automatically so every trade risks a fixed percentage of your account — no more, no less — regardless of how wide or tight the current stop distance is. An optional "stack flip" exit closes trades early if the multi-timeframe alignment breaks down before your stop is hit, cutting losers faster than a static stop alone.
Features
3-light traffic signal table — instant visual read of alignment across your fast/medium/slow timeframes
Dual momentum modes — RSI (with adjustable neutral band to reduce flip-flopping) or EMA slope
Linreg-smoothed MTF stochastic — filters out the staircase artifact from pulling higher-timeframe data
Bias label — STRONG BULL / BULL LEAN / NEUTRAL / BEAR LEAN / STRONG BEAR at a glance
Background tint + bar coloring — full-chart visual confirmation, not just the indicator pane
Risk-based position sizing — fixed % equity risk per trade, auto-scaled to current ATR
ATR stop/target + stack-flip early exit — two independent exit mechanisms
Built-in alert conditions for long/short signals — ready for automation
Long-only, short-only, or both — directional bias control in one input
전략

TRADLEWARE-Gaussian Channel + StochRSI ETH
Gaussian Channel + Stochastic RSI ETH
This strategy combines a fast Gaussian Channel with a Stochastic RSI filter and a 200-day SMA bull-market gate, aimed at catching trend continuation while sitting out confirmed downtrends.
How it works
The Gaussian Channel is a smoothed price envelope built with an IIR (infinite impulse response) filter — a mathematically elegant alternative to a simple moving average. It applies a bell-curve weighting across recent bars, producing smooth, low-lag output. The channel is formed by adding and subtracting a filtered measure of true range (volatility) around the central filter line.
The channel turns green when the filter is rising (uptrend) and red when it is falling (downtrend). A separate 200-day simple moving average acts as a bull/bear regime switch: the strategy only trades when price is above it.
Entry
A long position is opened when all five conditions are true simultaneously:
The channel is green (filter rising — uptrend confirmed)
Price closes above the upper band (breakout above the channel; an optional buffer above the band can require more room, but testing found this counterproductive — see Parameters)
Stochastic RSI %K is either above 80 (strong momentum confirming the breakout) or below 25 (oversold dip within the uptrend)
Price is above the 200-day SMA (bull regime — can be disabled)
The signal bar itself closes above its own open — a bullish candle (can be disabled)
The bullish-candle check filters out breakout bars that clear the upper band intrabar but still close weak — a common precursor to an immediate whipsaw exit on the next bar.
The 200-day SMA gate exists specifically to block breakout entries that fire during bear-market bounces — dead-cat rallies that look like trend resumption on the channel and oscillator alone but occur underneath a still-falling long-term average.
Exit
The position is closed when either:
Price closes back below the upper band (breakout has failed or the trend is cooling), or
The channel reverses from green to red (trend direction has flipped)
An optional stop-loss (on by default) is placed at the lower band and trails as the channel moves, providing a floor on losses if price drops sharply through both the upper and lower bands in the same move. The regime gate only blocks new entries — it does not force an exit on its own if price falls back below the 200-SMA mid-trade.
Parameters
Poles: 4 (filter smoothness — higher = smoother but more lag)
Sampling Period: 89 (faster channel than the baseline version, reacts sooner to trend changes)
True Range Multiplier: 1.5 (controls channel width)
Stochastic RSI overbought threshold: 80
Stochastic RSI oversold threshold: 25 (a parameter sweep found a stable plateau from 22-28; 25 sits at its center rather than its single best value)
200-SMA regime gate: on by default, can be disabled; length is adjustable
Bullish entry candle requirement: on by default, can be disabled
Entry breakout buffer: 0% (off) by default; tested at multiple levels above 0% and found to reduce returns at every level, so left disabled
Stop-loss at lower band: on by default, can be disabled
Start/End date range inputs let you restrict the backtest window without editing code
Costs modelled
0.1% commission per side, 3 ticks slippage, fills at next bar's open.
Intended assets and timeframe
Daily bars. Designed and validated on ETH/USDT. Likely applicable to other trending crypto assets; not validated on equities .
Known limitations
Underperforms in choppy or ranging markets — the upper band breakout condition generates whipsaws when price oscillates without directional conviction. The regime gate is a trade-off: it blocks bear-bounce false starts, but it also means the strategy can miss the first leg of a genuine new uptrend until price reclaims the 200-day SMA. The filter requires several hundred bars of history to fully converge; results on very short histories may differ from the validated backtest. The strategy trades infrequently (around 28 trades on the validated window), so treat any single backtest run as a small sample rather than a statistically strong result.
Credit
The Gaussian Channel filter is from the open-source "Gaussian Channel (DW)" indicator by DonovanWall. This script reuses that filter and adds the Stochastic RSI entry filter, the 200-day SMA regime gate, exit rules, stop-loss, and full strategy order management on top of it.
전략

TRADLEWARE-Gaussian Channel + StochRSI BTC
TRADLEWARE - Gaussian Channel + Stochastic RSI
This strategy combines a Gaussian Channel with a Stochastic RSI filter to capture momentum continuation in trending markets on the daily timeframe.
How it works
The Gaussian Channel is a smoothed price envelope built with an IIR (infinite impulse response) filter — a mathematically elegant alternative to a simple moving average. Instead of weighting recent bars linearly, the Gaussian filter applies a bell-curve weighting that produces very smooth, low-lag output. The channel is formed by adding and subtracting a filtered measure of true range (volatility) around the central filter line.
The channel turns green when the filter is rising (uptrend) and red when it is falling (downtrend).
Entry
A long position is opened when all three conditions are true simultaneously:
The channel is green (filter rising — uptrend confirmed)
Price closes above the upper band (breakout above the channel)
Stochastic RSI %K is either above 80 (strong momentum confirming the breakout) or below 15 (oversold dip within the uptrend)
The dual Stochastic RSI threshold captures two different entry scenarios: a momentum breakout and a pullback-and-recover within an ongoing trend.
Exit
The position is closed when either:
Price closes back below the upper band (breakout has failed or the trend is cooling), or
The channel reverses from green to red (trend direction has flipped)
An optional stop-loss (on by default) is placed at the lower band and trails as the channel moves, providing a floor on losses if price drops sharply through both the upper and lower bands in the same move.
Parameters
Poles: 4 (filter smoothness — higher = smoother but more lag)
Sampling Period: 144 (slow channel, suited to daily trends)
True Range Multiplier: 1.414 (controls channel width)
Stochastic RSI overbought threshold: 80
Stochastic RSI oversold threshold: 15
Stop-loss at lower band: on by default, can be disabled
Start/End date range inputs let you restrict the backtest window without editing code
Costs modelled
0.1% commission per side, 3 ticks slippage, fills at next bar's open.
Intended assets and timeframe
Daily bars. Designed and validated on BTC/USDT. Likely applicable to other trending crypto assets; not validated on equities .
Known limitations
Underperforms in choppy or ranging markets — the upper band breakout condition generates whipsaws when price oscillates without directional conviction. The filter requires several hundred bars of history to fully converge; results on very short histories may differ from the validated backtest. The strategy trades infrequently (around 30 trades from 2018 to present on BTC/USDT), so treat any single backtest run as a small sample rather than a statistically strong result.
Credit
The Gaussian Channel filter is from the open-source "Gaussian Channel (DW)" indicator by DonovanWall. This script reuses that filter and adds the Stochastic RSI entry filter, exit rules, stop-loss, and full strategy order management on top of it.
전략

SMI + Bollinger Bands## SMI + Bollinger Bands
SMI + Bollinger Bands is an overlay indicator that projects the Stochastic Momentum Index directly into the price space defined by Bollinger Bands.
Traditional SMI indicators are displayed in a separate oscillator pane. This script instead transforms the SMI value into a price-relative flow line, allowing momentum, volatility, and price structure to be viewed together on the main chart.
### Core concept
The indicator calculates two related systems:
1. A standard Bollinger Band structure based on a configurable moving average and standard deviation.
2. A double-smoothed Stochastic Momentum Index calculated from the relationship between the closing price and its recent high-low range.
The SMI is then normalized using the selected SMI Threshold and projected around the Bollinger basis:
* An SMI value equal to the positive threshold aligns with the primary upper Bollinger Band.
* An SMI value equal to the negative threshold aligns with the primary lower Bollinger Band.
* Values between the thresholds appear inside the primary Bollinger range.
* Momentum exceeding the threshold can extend beyond the primary bands and into the optional extended-band zones.
This projection makes it possible to compare momentum behavior directly with current price and volatility rather than interpreting an oscillator in a separate pane.
### Plotted elements
**Bollinger basis**
The center line of the Bollinger structure. The moving-average type can be selected from SMA, EMA, SMMA/RMA, WMA, or VWMA.
**Primary Bollinger Bands**
The upper and lower volatility boundaries calculated from the selected standard-deviation multiplier.
**Extended Bollinger Bands**
Optional outer volatility zones using a separately configurable standard-deviation multiplier. These areas can help visualize unusually extended price or momentum conditions.
**SMI Flow**
The yellow line represents the projected Stochastic Momentum Index. Its position shows where momentum currently sits relative to the Bollinger structure.
**SMI Flow-Base**
The white line is an EMA-smoothed version of the projected SMI Flow. It provides a slower reference line that can be used to observe momentum direction, compression, expansion, and crossings.
### Inputs
**Bollinger Band settings**
* Length: Lookback period used for the Bollinger basis and standard deviation.
* Basis MA Type: Moving-average calculation used for the basis.
* Source: Price source used for the Bollinger calculations.
* StdDev: Multiplier used for the primary Bollinger Bands.
* Extended StdDev: Multiplier used for the optional outer bands.
* Use Extended Bands: Enables or disables the extended volatility zones.
**SMI settings**
* %K Length: Lookback period used to determine the recent high-low momentum range.
* %D Length: Double-EMA smoothing applied during the SMI calculation.
* EMA Length: Smoothing applied to the projected SMI Flow-Base line.
* SMI Threshold: Defines which positive and negative SMI values align with the primary upper and lower Bollinger Bands.
### General interpretation
The indicator is intended as a visual analysis framework rather than a standalone entry system.
Traders may use it to study:
* Momentum changes relative to volatility.
* SMI Flow and Flow-Base crossings.
* Momentum expansion beyond the primary bands.
* Momentum rejection from extended zones.
* Divergence between price movement and projected momentum.
* Compression around the Bollinger basis.
* Confluence with trend, structure, volume, support, resistance, or other analysis.
A movement outside a band does not automatically indicate a reversal. Strong trends can remain extended, and crossings can occur repeatedly during sideways or volatile conditions. Market context and risk management remain necessary.
### Calculation behavior
This script does not use future data, lookahead calculations, or higher-timeframe requests. Values on the active candle may continue changing as the candle’s high, low, and close update. Historical values are finalized after their respective candles close.
### Disclaimer
This indicator is provided for research, education, and chart analysis. It does not provide guaranteed trade signals, financial advice, or predictions of future market performance. Users are responsible for independently evaluating all trading decisions and managing their own risk.
지표

지표

Stochastic + RSI in oneStochastic + RSI Confluence Signal is a combined momentum oscillator that integrates the Stochastic Oscillator and Relative Strength Index (RSI) into one panel.
The indicator is designed to help traders identify potential exhaustion zones and moments when both momentum tools indicate similar market conditions.
Logic:
• Stochastic measures the position of the current closing price relative to the recent high-low range.
• RSI measures the strength and speed of price movements.
The default settings are based on the traditional parameters:
• Stochastic: K Period 5, D Period 3, Slowing 3
• RSI: Period 14
Potential bearish conditions:
• Stochastic reversal from an overbought area
• RSI above the overbought level
Potential bullish conditions:
• Stochastic reversal from an oversold area
• RSI below the oversold level
This indicator is intended as a confirmation tool and should not be used as a standalone trading system. Market context, trend direction, price action, and risk management should always be considered.
Users can adjust all parameters according to their trading style, timeframe, and market conditions.
--------------------------------------------------------------------------------
Stochastic + RSI Confluence Signal to połączony oscylator momentum, który integruje Oscylator Stochastic oraz Relative Strength Index (RSI) w jednym panelu.
Wskaźnik został zaprojektowany, aby pomagać traderom identyfikować potencjalne strefy wyczerpania ruchu oraz momenty, w których oba narzędzia momentum wskazują podobne warunki rynkowe.
Logika działania:
• Stochastic mierzy położenie aktualnego zamknięcia ceny względem ostatniego zakresu pomiędzy najwyższym High i najniższym Low.
• RSI mierzy siłę oraz dynamikę ruchów cenowych.
Domyślne ustawienia wykorzystują klasyczne parametry:
• Stochastic: K Period 5, D Period 3, Slowing 3
• RSI: Period 14
Potencjalne warunki spadkowe:
• Odwrócenie Stochastic ze strefy wykupienia
• RSI powyżej poziomu wykupienia
Potencjalne warunki wzrostowe:
• Odwrócenie Stochastic ze strefy wyprzedania
• RSI poniżej poziomu wyprzedania
Wskaźnik jest przeznaczony jako narzędzie potwierdzające i nie powinien być używany jako samodzielny system transakcyjny. Należy zawsze uwzględniać kontekst rynku, kierunek trendu, zachowanie ceny oraz zarządzanie ryzykiem.
Użytkownik może dostosować wszystkie parametry do własnego stylu handlu, interwału czasowego oraz warunków rynkowych. 지표

지표

지표
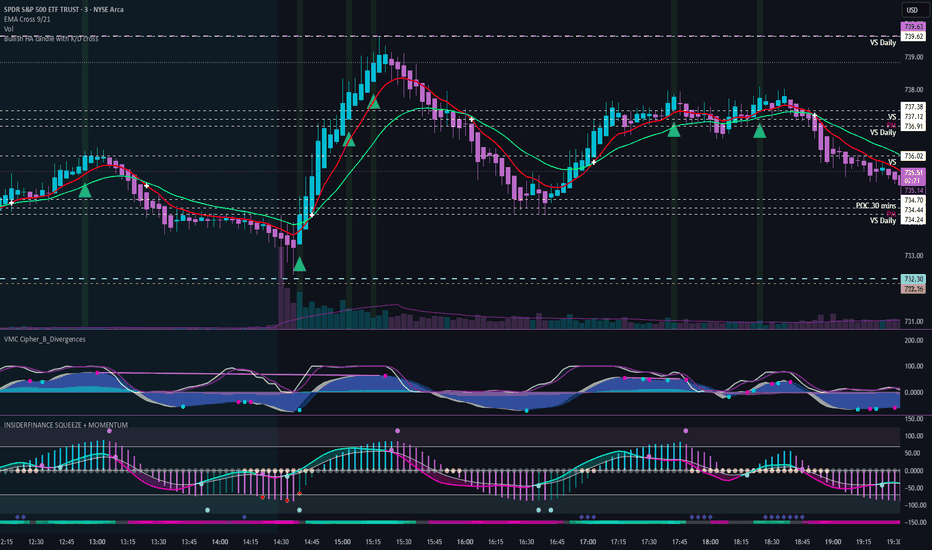
Zero Lag CVD, RSI & Stochastic Divergence (All-in-One) [D4A]Zero Lag CVD, RSI, Stochastic Divergence
Overview
Zero-Lag Divergence indicator is designed to identify bullish and bearish divergences as they happen, without relying on traditional pivot confirmation delays. By comparing price action with output of CVD, RSI and Stochastic across two independent detection periods, the indicator helps traders spot potential trend exhaustion and reversal opportunities earlier than conventional divergence tools.
How is this indicator different from other similar tools?
- Provides real-time non-repainting divergence signals for CVD, RSI and Stochastic in one convenient script
- Provides instant and separate divergence signals for one of the three oscillators (CVD, RSI, Stochastic), combination of two oscillators or combination of all three (Agreement Mode), thus marking double or triple confirmation of discrepancy between the price, momentum and volume, signalling potentially important reversal zone.
- To maximize probability of validity of the signal, the user can configure overbought and oversold conditions for both momentum oscillators (RSI & Stochastic) to filter only the strongest signals.
- To keep chart clutter under control the tool combines divergence labels into one common label in Agreement Mode
- The indicator tracks divergence simultaneously using two different and configurable periods (short- and long-term divergence) thus allowing to track shorter and longer periods for possible divergences while using only one timeframe
- Displays all signals directly on the chart - no need for additional panel below or above the chart
- All three oscillators can be independently configured, eg. signal length, smoothing, overbought and oversold levels.
Bullish Divergence Logic
Occurs when price forms a lower low while oscillator forms a higher low, suggesting weakening bearish momentum (volume) and the possibility of an upward reversal.
Bearish Divergence Logic
Occurs when price forms a higher high while oscillator forms a lower high, indicating weakening bullish momentum (volume) and the potential for a downward move.
Why Zero-Lag?
Most divergence indicators require future candle confirmation before displaying a signal. This indicator prioritizes immediacy by highlighting potential divergences as they form, allowing traders to react sooner to developing momentum shifts.
While this approach can generate earlier opportunities, it may also create false signals and market noise. For best results, consider combining divergence signals with trend analysis, support and resistance levels, volume studies, or additional confirmation tools.
Notes
* Signals are non-repainting once generated.
* Earlier detection may result in more frequent signals compared to traditional pivot-confirmed divergence indicators.
* Suitable for stocks, forex, cryptocurrencies, indices, and other liquid markets.
* Can be used on any timeframe, from intraday trading to higher-timeframe swing analysis.
SETTINGS
- Zero-Lag Divergence - enable the display of signals
- Mode - select for which oscillator should divergence signals be plotted:
CVD - Cumulative Volume Delta
RSI - Relative Strength Index
Stochastic - Momentum oscillator
Agreement - two or three indicators agree at the same time (same candle)
- Minimum Agreement - how many indicators should agree at the same time: Any Two or Any Three
- Cumulative Volume Delta Length
- RSI Length, OB (overbought) level , OS (oversold) level. OB and OS levels can be used to select more extreme zones to find divergence (stronger signals).
- Stochastic: %K and Smoothing settings, as well as OB and OS settings (work similar to RSI logic)
- Show Labels - show labels on the chart
- Bullish Label - can be set and color coded for different indicators
- Bearish Label - can be set and color coded for different indicators
- All Oscillators Agree - displays label when all three oscillators generate divergence signals at the same time
- RSI + Stochastic - displays label when both RSI and Stochastic agree at the same time
- CVD + Stochastic - displays label when both CVD and Stochastic agree at the same time
- CVD + RSI - displays label when both CVD and RSI agree at the same time
- RSI Divergence Label only if RSI >=OB or RSI <= OS - display the label only when RSI divergence signals are detected at user-defined overbought or oversold levels
- Stochastic Divergence Label only if Stochastic >=OB or Stochastic <= OS - display the label only when Stochastic divergence signals are detected at user-defined overbought or oversold levels
- Show Lines - draw lines between divergence points.
- Short Period - define the 1st period for which divergence is detected
- Long Period - define the 2nd period for which divergence is detected
- Distance Multiplier & ATR - used to position the labels at specific distance from divergence point
What is CVD?
CVD measures the cumulative difference between buying and selling volume. A rising CVD indicates more buying pressure, while a falling CVD indicates more selling pressure. Divergence occurs when the price action contradicts the CVD's direction, suggesting a potential shift in momentum or trend reversal.
What is RSI?
The relative strength index (RSI) is a momentum indicator used to measures the speed and magnitude of a asset's recent price changes to detect overbought or oversold conditions.
What is Stochastic?
Trading View definition: Stochastic Oscillator (STOCH) is a range bound momentum oscillator. The Stochastic indicator is designed to display the location of the close compared to the high/low range over a user defined number of periods. Typically, the Stochastic Oscillator is used for three things; Identifying overbought and oversold levels, spotting divergences and also identifying bull and bear set ups or signals.
-----------------
Disclaimer
The content provided in this script is for educational and informational purposes only. It does not constitute financial advice, investment recommendations, or a solicitation to buy or sell any financial instruments. I will not accept liability for any loss or damage, including without limitation any loss of profit, which may arise directly or indirectly from the use of or reliance on such information.
All investments involve risk, and the past performance of a security, industry, sector, market, financial product, trading strategy, backtest, or individual's trading does not guarantee future results or returns. Investors are fully responsible for any investment decisions they make. Such decisions should be based solely on an evaluation of their financial circumstances, investment objectives, risk tolerance, and liquidity needs.
지표

Hybrid OscillatorHybrid Oscillator
Hybrid Oscillator is a visual oscillator designed to read momentum pressure, overbought conditions, oversold conditions, oscillator crosses, extreme zones and directional fading inside a separate chart pane.
the indicator combines a selected oscillator engine with a smoothed wave, a secondary cross line, gradient zones, level dots and alert conditions.
the goal is to help traders understand when momentum is expanding, when it is reaching an extreme area, when it is cooling down, and when the main oscillator line crosses its reference line.
this tool is not a trading strategy. it does not place trades, does not guarantee reversals and does not predict future price movement. it is a technical analysis tool for market context, momentum reading and visual confirmation.
main concept
the oscillator moves between 0 and 100.
values near the upper zone show stronger upside pressure or overbought conditions.
values near the lower zone show stronger downside pressure or oversold conditions.
the main oscillator line is the active momentum wave.
the real cross line is a smoother reference line.
when the main oscillator crosses above the real cross line, momentum may be recovering or shifting upward.
when the main oscillator crosses below the real cross line, momentum may be weakening or shifting downward.
what the indicator displays
main oscillator line
real cross line
upper and lower gradient zones
overbought level
oversold level
extreme overbought level
extreme oversold level
mid upper level
mid lower level
top extreme dots
bottom extreme dots
real cross dots
level lines
alert conditions
oscillator engines
the script includes several oscillator calculation modes.
rsi
uses relative strength index behavior.
this mode is useful for reading classic momentum strength and overbought or oversold behavior.
stochastic
uses stochastic positioning.
this mode focuses on where price is closing compared to its recent high and low range.
hybrid rsi plus stochastic
uses rsi first, then applies a stochastic calculation to the rsi behavior.
this mode focuses on momentum position inside the rsi range and gives a more reactive exhaustion style.
cci normalized
uses commodity channel index behavior and normalizes it into a 0 to 100 style range.
this mode can be useful for reading broader deviation and momentum pressure.
how the real cross line works
the real cross line is a smoothed version of the active oscillator.
it is not a separate oscillator type. it follows the selected engine.
if rsi mode is selected, the cross line follows the rsi-based oscillator.
if stochastic mode is selected, the cross line follows the stochastic-based oscillator.
if hybrid mode is selected, the cross line follows the hybrid oscillator.
if cci normalized mode is selected, the cross line follows the normalized cci oscillator.
the cross dots are based on the actual intersection between the main oscillator and the real cross line.
orange cross dots show an upward cross.
magenta cross dots show a downward cross.
input guide
source
selects the price source used by the oscillator.
common choices are close, hl2, hlc3 or ohlc4.
close is simple and reactive.
hlc3 is smoother because it includes high, low and close.
length
controls the base oscillator calculation period.
a lower value makes the oscillator faster and more sensitive.
a higher value makes the oscillator smoother and slower.
smoothing
controls the smoothing applied to the final oscillator.
a lower value reacts faster.
a higher value reduces noise but adds more delay.
oscillator type
selects the calculation engine.
rsi is classic momentum.
stochastic is range position.
hybrid rsi plus stochastic is a more sensitive momentum range model.
cci normalized is a deviation-based momentum model.
extreme overbought
sets the upper extreme zone.
when the oscillator reaches this area, upside momentum is considered stretched.
overbought
sets the main upper warning level.
crossing this level can mark a strong bullish extension.
mid upper
sets the upper midline reference.
this can be used to detect smaller upward crosses around the upper balance area.
mid lower
sets the lower midline reference.
this can be used to detect smaller downward crosses around the lower balance area.
oversold
sets the main lower warning level.
crossing this level can mark a strong bearish extension.
extreme oversold
sets the lower extreme zone.
when the oscillator reaches this area, downside momentum is considered stretched.
enable gradient fills
turns the upper and lower visual gradient zones on or off.
when enabled, the oscillator pane becomes easier to read visually.
gradient layers
controls the number of visual layers used for the gradient style.
more layers create a smoother visual feel.
show level cross dots
shows or hides the dots created by cross conditions and extreme conditions.
show real cross line
shows or hides the smoother cross reference line.
this line is useful when you want to see exactly where the oscillator cross dots come from.
show level lines
shows or hides the horizontal reference lines.
these lines help identify overbought, oversold, extreme and midpoint areas.
oscillator line width
controls the thickness of the main oscillator line.
higher values make the oscillator more visible.
lower values keep the chart cleaner.
how to read the dots
top extreme dots
these appear when the oscillator is inside the extreme overbought zone.
they indicate strong upside extension.
they do not mean price must reverse immediately.
bottom extreme dots
these appear when the oscillator is inside the extreme oversold zone.
they indicate strong downside extension.
they do not mean price must reverse immediately.
orange cross dots
these appear when the main oscillator crosses above the real cross line.
they can show a possible upward momentum shift.
magenta cross dots
these appear when the main oscillator crosses below the real cross line.
they can show a possible downward momentum shift.
important note about dots
cross dots are not automatic buy or sell signals.
they show technical events inside the oscillator.
always confirm with trend, support and resistance, candle close, volume and risk management.
alerts
the script includes alert conditions for:
cross above the real cross line
cross below the real cross line
cross above overbought
cross below oversold
cross above extreme overbought
cross below extreme oversold
recommended beginner alert use
start with real cross up and real cross down.
use overbought and oversold alerts only as context.
use extreme alerts as exhaustion warnings, not direct trade signals.
avoid activating every alert at once if you want a clean workflow.
beginner tutorial
step 1: start with the default oscillator type
begin with hybrid rsi plus stochastic.
this mode gives a balanced view between momentum and range behavior.
step 2: keep the default levels
use the default overbought, oversold and extreme levels first.
do not change too many settings before understanding the oscillator behavior.
step 3: enable the real cross line
turn on the real cross line to see where cross dots come from.
when the oscillator crosses above the line, upward momentum may be improving.
when the oscillator crosses below the line, momentum may be weakening.
step 4: read the zones
above overbought, the market is showing strong upside momentum.
below oversold, the market is showing strong downside momentum.
inside the middle area, the market is more balanced.
step 5: read extremes carefully
extreme overbought can show strong bullish pressure.
extreme oversold can show strong bearish pressure.
an extreme does not guarantee a reversal.
strong markets can stay extreme longer than expected.
step 6: confirm with price action
before using any oscillator event, check the main chart.
look for:
trend direction
support and resistance
market structure
candle close
volume reaction
higher timeframe context
risk to reward
step 7: keep the chart clean
do not use every signal as an entry.
focus on the main oscillator, real cross line, extreme zones and a few important dots.
example 1: upward cross from the lower zone
the oscillator is near the oversold area.
then it crosses above the real cross line.
an orange dot appears at the real cross.
this can suggest that downside momentum is cooling and upward pressure may be starting.
a beginner should wait for price confirmation, such as a higher low, bullish candle close or break of short-term resistance.
example 2: downward cross from the upper zone
the oscillator is near the overbought area.
then it crosses below the real cross line.
a magenta dot appears at the real cross.
this can suggest that upside momentum is weakening.
a beginner should wait for price confirmation, such as rejection, lower high or break of short-term support.
example 3: extreme overbought continuation
the oscillator reaches the extreme overbought zone.
top extreme dots appear.
this means momentum is very strong to the upside.
it does not mean a sell signal is confirmed.
in a strong trend, the oscillator can remain high while price continues moving upward.
example 4: extreme oversold continuation
the oscillator reaches the extreme oversold zone.
bottom extreme dots appear.
this means momentum is very strong to the downside.
it does not mean a buy signal is confirmed.
in a strong downtrend, the oscillator can remain low while price continues moving downward.
example 5: using the cross line for timing
price is near support.
the oscillator is low.
the oscillator crosses above the real cross line.
an orange dot appears.
this can be used as an early momentum recovery warning, but the trader should still wait for price structure confirmation before making a decision.
example 6: using overbought as context
price is in an uptrend.
the oscillator crosses above the overbought level.
this confirms strong bullish pressure.
instead of shorting immediately, a beginner can watch for continuation or wait for a later loss of momentum.
best use cases
momentum reading
overbought and oversold context
detecting oscillator cross events
watching exhaustion zones
supporting reversal analysis
supporting trend continuation analysis
building alert-based watchlists
confirming price action with momentum context
recommended beginner setup
oscillator type: hybrid rsi plus stochastic
length: 14
smoothing: 3
show real cross line: on
show level cross dots: on
show level lines: on
enable gradient fills: on
use cross dots as warnings
use extreme dots as context
confirm every idea on the price chart
practical workflow
first, identify the current trend on the main chart.
second, check whether the oscillator is near the upper, middle or lower zone.
third, watch the real cross line.
fourth, note any orange or magenta cross dot.
fifth, check whether price confirms the oscillator event.
sixth, define invalidation and risk before any trade idea.
seventh, avoid taking signals against a strong trend without extra confirmation.
limitations
the oscillator is based on historical price data.
signals can appear late during fast moves.
extreme zones can stay extreme during strong trends.
cross dots are momentum events, not guaranteed reversals.
the tool should not be used alone.
risk note
this indicator is designed for technical analysis and educational market study. it does not provide financial advice, investment advice or guaranteed trading signals. all dots, levels, crosses, alerts and visual zones are references that require independent confirmation and proper risk management.
지표

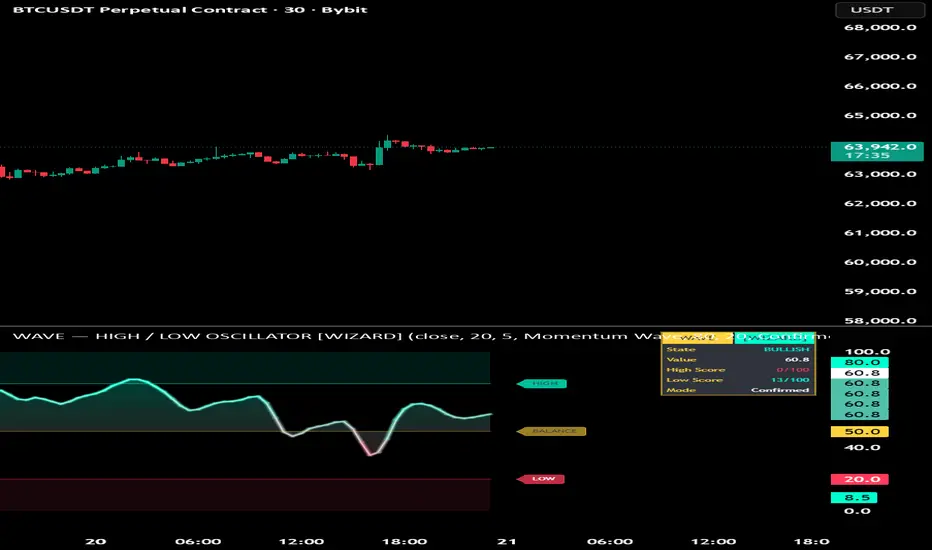
Wave Oscillatorwave high low detector pro
wave high low detector is a bounded oscillator designed to help identify potential local high and low areas using momentum, rsi behavior, pivot confirmation, candle rejection, divergence, atr exhaustion, structure breaks, cooldown logic and quality scoring.
the oscillator moves between 0 and 100.
a value near 100 means price is trading close to the upper part of its recent range or showing strong upside momentum.
a value near 0 means price is trading close to the lower part of its recent range or showing strong downside momentum.
the script does not predict the future and does not guarantee market tops or bottoms. it is a technical analysis tool that marks possible early and confirmed high or low references. every signal should be confirmed with price action, market structure, volume, trend context and risk management.
main idea
the indicator separates high and low detection into two signal types:
early high and early low
confirmed high and confirmed low
early signals are faster and more reactive. they appear when the oscillator leaves an extreme zone and the selected filters agree.
confirmed signals are slower but more selective. they use pivot confirmation and additional context to validate a stronger high or low reference.
this design allows the trader to choose between speed and confirmation.
what the indicator shows
wave oscillator
high zone
low zone
balance zone
early high markers
early low markers
confirmed high markers
confirmed low markers
quality score labels
bull and bear gradient fill
optional glow
right-side zone labels
dashboard with state, value, score and mode
separate alerts for early and confirmed signals
how high and low detection works
an early high appears when the oscillator leaves the upper zone after being stretched upward.
an early low appears when the oscillator leaves the lower zone after being stretched downward.
a confirmed high appears only when a pivot high is confirmed and the score is strong enough.
a confirmed low appears only when a pivot low is confirmed and the score is strong enough.
confirmed signals are placed back on the pivot location, so they naturally appear with a delay. this is normal because pivots need future bars to confirm the local high or low.
quality score
the score rates the quality of a potential high or low from 0 to 100.
the score can include:
extreme oscillator condition
super extreme oscillator condition
oscillator slope reversal
wick rejection
atr exhaustion
divergence
structure break
pivot confirmation
a higher score means more conditions agree. a lower score means the setup is weaker or less complete.
the score is not a trade signal by itself. it is only a filter that helps compare the quality of different high and low references.
input guide
engine
source
selects the price source used by the rsi engine.
common choices are close, open, high, low, hl2, hlc3 or ohlc4.
length sensitivity
controls how many bars are used by the oscillator engine.
lower values make the wave faster and more reactive.
higher values make the wave smoother and slower.
smoothing
smooths the oscillator.
higher values reduce noise but add delay.
lower values react faster but may produce more signals.
engine
selects the oscillator calculation method.
momentum wave
uses a stochastic-style high and low range calculation. this is the most direct mode for high and low detection.
rsi
uses a smoothed rsi. this mode reads momentum exhaustion rather than pure range position.
blend
combines rsi and range position. this gives a balanced reading between momentum and high or low range behavior.
levels
overbought high zone
sets the upper zone where price is considered stretched toward the high area.
default logic usually works around 80.
oversold low zone
sets the lower zone where price is considered stretched toward the low area.
default logic usually works around 20.
show midline
shows or hides the 50 balance line.
above 50, the oscillator is generally stronger.
below 50, the oscillator is generally weaker.
high low detector
detection mode
controls the signal strictness.
fast
more reactive. it allows earlier signals with fewer confirmations.
balanced
uses a middle approach between speed and confirmation.
confirmed
stricter and slower. it requires stronger confirmation and higher score quality.
show early high low
shows or hides early high and early low markers.
show confirmed high low
shows or hides confirmed high and confirmed low markers.
balanced minimum score
sets the minimum score used in balanced mode.
higher values reduce signals.
lower values increase signals.
pivot left bars
sets how many bars to the left are used to confirm a pivot.
higher values make pivots more important but slower.
pivot right bars
sets how many bars to the right are required to confirm a pivot.
higher values make confirmed signals more reliable but delayed.
cooldown between signals
sets the minimum number of bars between repeated signals of the same type.
this helps reduce signal spam.
show quality score labels
shows or hides score labels near early and confirmed markers.
optional filters
use divergence in score
adds divergence logic to the quality score.
bearish divergence can strengthen a confirmed high.
bullish divergence can strengthen a confirmed low.
wick rejection filter
requires a rejection wick before accepting signals.
for highs, the script looks for upper wick rejection.
for lows, the script looks for lower wick rejection.
min wick percent of candle
sets the minimum wick size needed for the wick rejection filter.
higher values make the filter stricter.
lower values allow more signals.
atr exhaustion filter
requires price to be extended away from a moving average by an atr-based distance.
this helps focus on stronger exhaustion moves.
atr length
sets the atr calculation length.
atr exhaustion multiplier
sets how far price must extend from the average before the atr exhaustion filter confirms.
structure break filter
requires a short structure break to confirm the signal.
for highs, price should break below recent structure.
for lows, price should break above recent structure.
structure break lookback
sets how many bars are used to define the recent structure level.
visuals
glow
turns the glow effect around the wave on or off.
glow intensity
controls the strength of the glow.
bull bear gradient fill
fills the area between the wave and the midline with a bull or bear gradient.
fill transparency
controls how visible the gradient fill is.
higher transparency makes the fill lighter.
lower transparency makes the fill stronger.
tint high low zones
adds a faint background tint to the high and low areas.
color theme
selects the visual color style.
wizard
default bright cyan and red style.
ice
cool blue theme.
inferno
warm orange and red theme.
toxic
green and purple style.
markers
show high low markers
turns all markers on or off.
marker labels
selects the marker text style.
high low
uses early high, early low, confirmed high and confirmed low style labels.
buy sell
uses early buy, early sell, confirmed buy and confirmed sell style labels.
these labels are visual references only, not automatic entries.
show zone labels right
shows high, low and balance labels on the right side of the oscillator.
dashboard
show dashboard
shows or hides the dashboard.
position
selects the dashboard location.
the dashboard displays:
current state
current oscillator value
high score
low score
detection mode
signal types
early high
an early high appears when the wave leaves the high zone and the high score passes the selected requirements.
this means upside pressure may be weakening.
it is not a guaranteed top.
early low
an early low appears when the wave leaves the low zone and the low score passes the selected requirements.
this means downside pressure may be weakening.
it is not a guaranteed bottom.
confirmed high
a confirmed high appears when a pivot high is confirmed and the score is strong enough.
this signal is more selective but appears later.
confirmed low
a confirmed low appears when a pivot low is confirmed and the score is strong enough.
this signal is more selective but appears later.
how to use the alerts
the script includes separate alert conditions:
early high
early low
confirmed high
confirmed low
any early high or low
any confirmed high or low
for fast monitoring, use early alerts.
for cleaner monitoring, use confirmed alerts.
for fewer alerts, use only any confirmed high or low.
recommended anti-spam setup:
use confirmed signals only
increase cooldown between signals
use balanced or confirmed mode
keep pivot right bars at 3 or higher
increase the minimum score if there are too many signals
recommended beginner alert setup:
start with any confirmed high or low
use balanced mode
set cooldown between signals to 8 or more
keep score labels enabled
avoid using every alert condition at the same time
beginner tutorial
step 1: start with balanced mode
balanced mode is the best starting point because it avoids being too fast or too strict.
step 2: keep the default high and low zones
use 80 for the high zone and 20 for the low zone.
this gives a clean first reading.
step 3: watch the wave position
when the wave is above 80, price is stretched toward the high area.
when the wave is below 20, price is stretched toward the low area.
when the wave is around 50, the market is more balanced.
step 4: understand early signals
early signals are warnings.
early high means a possible local top area may be forming.
early low means a possible local bottom area may be forming.
do not enter a trade only because an early signal appears.
step 5: understand confirmed signals
confirmed signals are more selective.
confirmed high means a pivot high has been validated.
confirmed low means a pivot low has been validated.
these signals are slower because the script waits for confirmation.
step 6: read the score
a score near 50 is weaker.
a score near 65 is more acceptable.
a score above 75 is stronger.
a score above 85 means several filters agree.
step 7: confirm on the price chart
before using any signal, check:
trend direction
support and resistance
market structure
candle close
volume reaction
risk to reward
stop loss location
step 8: avoid overloading the chart
do not turn on every filter at once at the beginning.
start with:
balanced mode
wick rejection filter on
divergence in score on
atr exhaustion filter off
structure break filter off
cooldown enabled
after understanding the tool, activate atr exhaustion or structure break if you want stricter signals.
example 1: early high
price pushes upward and the wave moves above the high zone.
then the wave crosses back below the high zone.
an early high appears.
this means the upward push may be losing strength.
a beginner should wait for price rejection or a lower high before considering a short idea.
example 2: confirmed high
price forms a local high.
a few bars later, the pivot is confirmed.
the indicator prints confirmed high at the pivot location.
this is a stronger reference than an early high, but it appears later.
example 3: early low
price drops and the wave moves below the low zone.
then the wave crosses back above the low zone.
an early low appears.
this means downside pressure may be weakening.
a beginner should wait for support reaction or a higher low before considering a long idea.
example 4: confirmed low
price forms a local low.
a few bars later, the pivot is confirmed.
the indicator prints confirmed low at the pivot location.
this is a stronger reference than an early low, but it appears later.
example 5: using cooldown
if the market is volatile, the wave can create several signals close together.
cooldown prevents repeated signals from appearing too often.
higher cooldown values create a cleaner chart.
lower cooldown values create more frequent signals.
best use cases
spotting potential local highs
spotting potential local lows
detecting exhaustion zones
finding momentum fade areas
confirming high and low references with pivots
filtering noisy oscillator signals
building alerts for reversal watchlists
supporting discretionary trading decisions
important notes
early signals are faster but less confirmed.
confirmed signals are more selective but delayed.
pivot-based confirmation cannot appear instantly.
score is a filter, not a prediction.
buy and sell labels are only visual naming options.
the indicator should be combined with price action, structure, volume and risk management.
risk note
this indicator is for technical analysis and educational market study only. it does not provide financial advice, investment advice or guaranteed trading signals. all signals, markers, scores and alerts are references that require independent confirmation and proper risk management.
지표

전략

Adaptive Stochastic with Colored Lines and ZonesAdaptive Stochastic with Colored Lines and Zones
"Adaptive Stochastic with Colored Lines and Zones" is an enhanced Stochastic Oscillator designed to improve trend visualization and market momentum analysis through dynamic color changes and clearly defined overbought/oversold zones.
The indicator automatically adjusts the color of the main Stochastic line according to prevailing market conditions:
**Blue** indicates bullish momentum and strengthening upward pressure.
**Red** indicates bearish momentum and increasing downward pressure.
This visual feedback helps traders quickly assess market direction without adding additional trend-following tools to the chart.
Overbought and Oversold Zones
The indicator highlights key momentum extremes:
* **Above 80** – Strong Overbought Zone
* **Below 20** – Strong Oversold Zone
These areas can help identify periods of extended market movement, potential pullbacks, or possible reversal conditions when combined with price action and other forms of technical analysis.
Applications
* Trend identification
* Momentum analysis
* Confirmation of market direction
* Detection of overbought and oversold conditions
* Support for entry and exit timing
Suitable Markets
The indicator can be used across multiple asset classes, including Forex, Cryptocurrencies, Stocks, Indices, and Futures, and is compatible with various trading styles ranging from intraday trading to longer-term trend analysis.
Notes
As with any technical indicator, Adaptive Stochastic with Colored Lines and Zones should be used as part of a broader trading strategy and not as a standalone signal generator. Combining momentum readings with market structure, support and resistance levels, and risk management techniques may improve decision-making.
지표

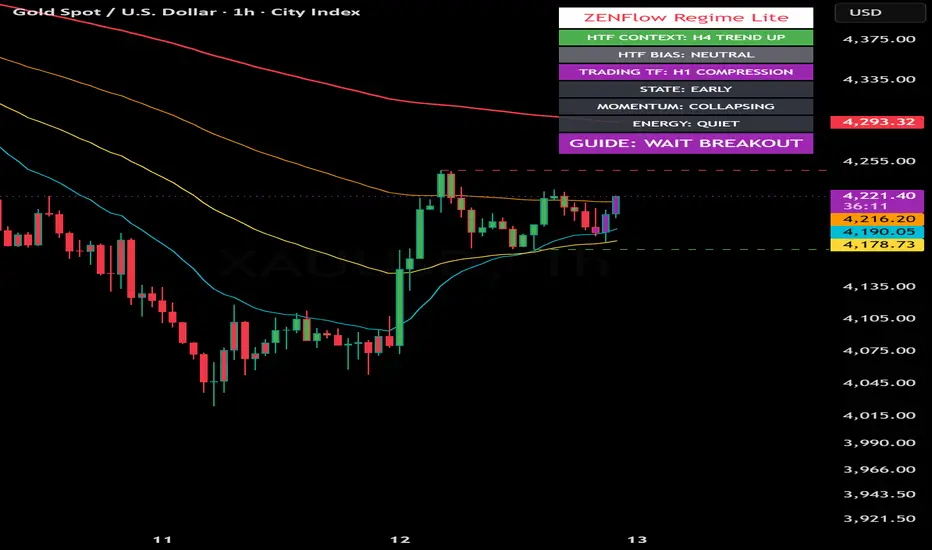
ZENFlow Regime Lite | Market Context GuideZENFlow Regime Lite | Market Context Guide
ZENFlow Regime Lite is an open-source market regime and context-reading indicator designed to help traders understand the current market environment before looking for trade setups.
The main idea behind this script is simple:
Read the market first.
Then decide whether the market is trending, ranging, compressing, or unclear.
This Lite version is designed as a beginner-friendly market context guide. It does not provide direct entry, stop-loss, or take-profit levels. Instead, it helps users identify the broader condition of the market so they can make more informed decisions using their own trading method.
Core Concept
Many traders start by asking:
Should I buy?
Should I sell?
Where is the entry?
ZENFlow Regime Lite starts from a different question:
What kind of market are we in right now?
The indicator uses a multi-timeframe context approach. It reads the current chart timeframe together with a higher timeframe context to help classify the market into broad conditions such as trend, range, compression, chop, or breakout-watch environments.
What This Indicator Shows
HTF Context
The higher timeframe context helps users understand the broader market environment.
Examples:
• Trend Up
• Trend Down
• Range
• Compression
• Chop
HTF Bias
The bias row summarizes whether the higher timeframe favors long, short, range mode, breakout watch, or neutral conditions.
Examples:
• Long Bias
• Short Bias
• Range Mode
• Wait Breakout
• Neutral
Trading Timeframe Regime
The script also reads the current chart timeframe to show whether the trading timeframe is trending, ranging, compressing, or choppy.
Market State
The state classification helps users understand the phase of the move.
Examples:
• Early
• Healthy
• Mature
• Exhaustion
Momentum
Momentum is based on directional pressure and DI gap behavior.
Examples:
• Rising
• Strong
• Fading
• Collapsing
Energy
Energy is based on ATR behavior compared with its baseline.
Examples:
• Quiet
• Normal
• Expanding
• Extreme
Guide
The Guide row provides a broad market-reading suggestion.
Examples:
• Follow Long Bias
• Follow Short Bias
• Avoid Chase
• Range Market
• Wait Breakout
• Wait
The Guide is not an entry signal. It is a market-context summary.
Calculation Logic
ZENFlow Regime Lite combines several market components:
• ADX and DI
Used to detect trend strength and directional pressure.
• Bollinger Band Width
Used to identify range and compression conditions.
• ATR and ATR Baseline
Used to measure volatility and market energy.
• Stochastic
Used as part of state and exhaustion interpretation.
• Multi-Timeframe Context
Used to compare the current chart timeframe with a higher timeframe environment.
The purpose of combining these components is to avoid reading price action from a single signal only. The script is designed to provide a broader context before trade planning.
How to Use
Start with HTF Context
Check whether the higher timeframe is trending, ranging, compressing, or choppy.
Read HTF Bias
Use this to understand whether the broader environment favors long, short, range, breakout watch, or neutral behavior.
Check the Trading Timeframe
Compare the current chart timeframe with the higher timeframe. Alignment between both timeframes usually provides a cleaner reading.
Read State, Momentum, and Energy
These rows help determine whether the current move is still developing, healthy, late, or losing strength.
Use the Guide row carefully
The Guide row is only a broad context suggestion. It should not be treated as an automatic buy or sell instruction.
Suggested Interpretation
A stronger long-side context may appear when:
• HTF Bias favors Long
• Trading timeframe is also Trend Up
• State is Early or Healthy
• Momentum is Rising or Strong
• Energy is Normal or Expanding
A stronger short-side context may appear when:
• HTF Bias favors Short
• Trading timeframe is also Trend Down
• State is Early or Healthy
• Momentum is Rising or Strong
• Energy is Normal or Expanding
A caution condition may appear when:
• State is Mature or Exhaustion
• Momentum is Fading or Collapsing
• Energy is Extreme
• The market is in Range, Compression, or Chop
• Price has already moved too far and the Guide shows Avoid Chase
What This Lite Version Does Not Include
This Lite version is intentionally limited to broad market-regime reading.
It does not include:
• Final Plan
• Action row
• ZSS setup events
• CHoCH / BOS engine
• Liquidity target engine
• Entry / Stop-loss / Take-profit planner
• Tactical reversal layer
• Trade execution system
This keeps the script simple, educational, and suitable for users who want to learn how to read market context first.
Alerts
The script includes broad context alerts such as:
• Follow Long Bias
• Follow Short Bias
• Avoid Chase
• Range Market
• Wait Breakout
• Wait
These alerts are designed to notify users when the market context changes. They are not standalone trade signals.
Recommended Use
ZENFlow Regime Lite can be used as:
• A market-regime dashboard
• A trend/range/compression context reader
• A top-down market filter
• A learning tool for reading market condition
• A companion to a trader’s own entry method
Limitations
This indicator does not predict future price movement.
It does not guarantee profitable trades.
It does not replace risk management.
It should not be used as a standalone trading system.
Market behavior can change quickly, especially during news events, low-liquidity periods, or highly volatile conditions.
All trading decisions remain the responsibility of the user.
Educational Use Only
This script is intended for educational and analytical use only.
It is not financial advice.
──────────────────── 지표

지표
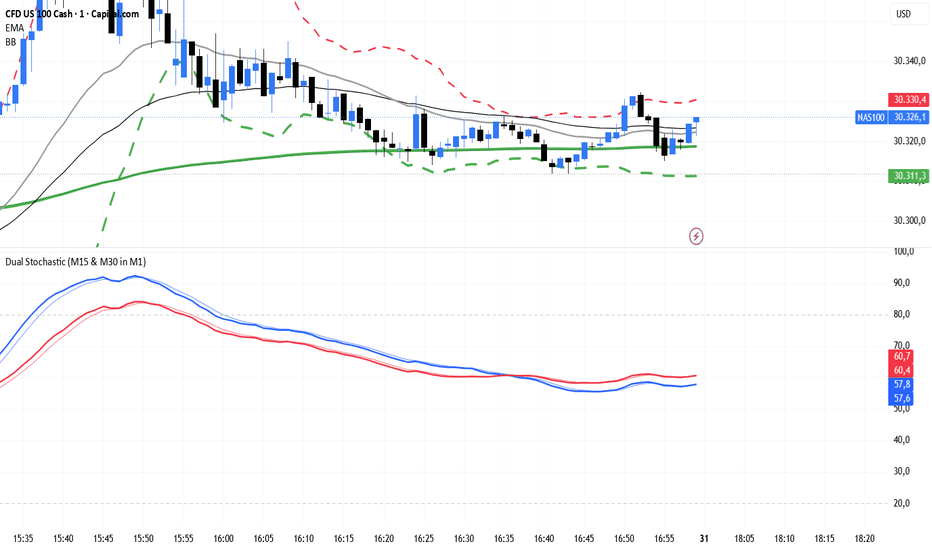
Smart Stochastic Prosmart stochastic pro is a momentum oscillator built to read stochastic structure, buying and selling pressure, and multi-timeframe bias in one clean panel.
the script is designed for traders who want a visual way to track when the market is stretched, when pressure starts to shift, and when a reversal setup becomes more interesting. it does not predict price and it should not be used alone. it is meant to support analysis together with price action, market structure, support and resistance, volume, and risk management.
what the script does
smart stochastic pro uses a smoothed stochastic engine to create rounded %k and %d curves. the goal is to reduce visual noise while keeping the oscillator responsive enough for intraday and swing analysis.
the script includes:
* a smoothed stochastic %k and %d
* extreme overbought and oversold zones
* buying and selling pressure based on candle position and volume
* optional mtf calculation modes
* reversal detection after extreme zones
* optional candle coloring
* a compact dashboard
* visual pressure zones and signal labels
how to use it
add the script to a normal candlestick chart. for the clearest reading, start with the default settings and use a liquid market such as major crypto pairs, forex pairs, indices, or large-cap stocks.
the oscillator moves between 0 and 100.
basic reading:
* above 80 means price is in an overbought area
* below 20 means price is in an oversold area
* above 90 means extreme overbought
* below 10 means extreme oversold
* the 50 line is the neutral zone
* %k above %d shows bullish momentum
* %k below %d shows bearish momentum
the script works best when you do not take every cross. the main idea is to wait for a strong area first, then look for a confirmed shift.
beginner workflow
1. start on the chart mode
use:
calculation / visual mode: chart
this uses the current chart timeframe and is the easiest mode to understand.
2. wait for an extreme zone
for bullish setups, watch for %k to move into the extreme oversold area.
for bearish setups, watch for %k to move into the extreme overbought area.
this arms the setup. it does not mean enter immediately.
3. wait for confirmation
a bullish reversal becomes more interesting when:
* %k crosses above %d
* the oscillator starts rising
* buying pressure improves
* the signal appears after an oversold expansion
a bearish reversal becomes more interesting when:
* %k crosses below %d
* the oscillator starts falling
* selling pressure improves
* the signal appears after an overbought expansion
4. check the pressure
the pressure background and ribbons help show whether buyers or sellers are gaining control.
green pressure means buying is stronger.
red pressure means selling is stronger.
neutral pressure means the market may still be undecided.
5. use the dashboard
the dashboard summarizes:
* active mode
* current bias
* mtf bias
* slope
* oscillator zone
* buying or selling pressure
* %k and %d values
* signal strength
* armed state
for beginners, the most useful dashboard rows are state, zone, pressure, and armed.
recommended settings
for beginners:
* calculation / visual mode: chart
* require explosion first: true
* minimum confluence strength: 2
* hide mid-range noise: true
* show pressure: true
* show dashboard: true
* candle color: off at first
for cleaner signals:
* require explosion first: true
* minimum confluence strength: 3
* hide mid-range noise: true
* mtf bias filters signals: true
for faster signals:
* require explosion first: false
* minimum confluence strength: 2
* hide mid-range noise: true
for multi-timeframe use:
mtf strict shows the oscillator calculated directly from the selected higher timeframe.
mtf bias keeps the chart oscillator smoother while using the higher timeframe as a directional filter.
a simple setup is:
* chart timeframe: 5m or 15m
* mtf timeframe: 1h
* mtf bias filters signals: true
where to use it
the script can be used on:
* crypto
* forex
* indices
* stocks
* futures
it is usually cleaner on markets with good liquidity and enough volume. low-volume markets can create noisy pressure readings and weaker signal quality.
timeframes
for scalping, try 1m to 5m, but expect more noise.
for intraday trading, 5m to 30m is usually easier to read.
for swing trading, 1h to 4h gives slower but cleaner signals.
how not to use it
do not buy only because the oscillator is oversold.
do not sell only because the oscillator is overbought.
do not use one signal without checking market structure.
do not use it as a guaranteed entry system.
do not ignore risk management.
best practice
use the script as a timing and confirmation tool.
a stronger bullish setup usually has:
* price near support or after a liquidity sweep
* %k coming from oversold or extreme oversold
* buying pressure improving
* bullish signal strength at least 2 or 3
* mtf bias not fighting the trade
a stronger bearish setup usually has:
* price near resistance or after a failed breakout
* %k coming from overbought or extreme overbought
* selling pressure improving
* bearish signal strength at least 2 or 3
* mtf bias not fighting the trade
alerts
alerts are available for:
* bullish reversal after extreme oversold
* bearish reversal after extreme overbought
* extreme oversold
* extreme overbought
* pressure flip bullish
* pressure flip bearish
use alerts as reminders to check the chart, not as automatic trade entries.
notes
this script is an analysis tool. it does not guarantee results. all signals should be reviewed with price action, trend context, volatility, and personal risk rules before making a trade decision.
지표

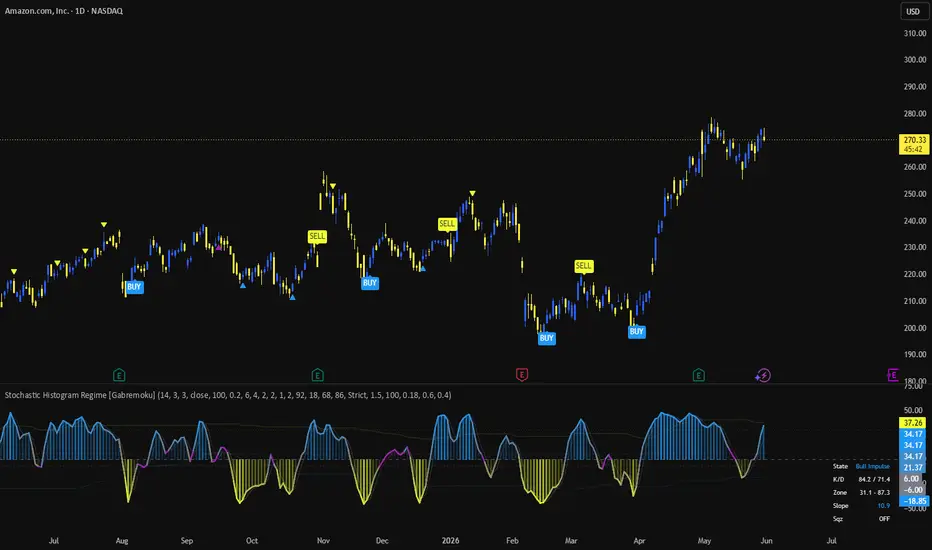
Stochastic Histogram Regime [Gabremoku]Stochastic Histogram Regime is a refined Stochastic-based momentum oscillator that transforms classic %K / %D logic into a mid-centered histogram regime model with adaptive zones, squeeze detection, and sequential BUY/SELL signaling.
Instead of using the traditional 0–100 Stochastic layout alone, this script recenters the oscillator around its midline and highlights:
momentum expansion and recovery phases
adaptive extreme zones
K/D compression regimes
sequential crossover signals
squeeze-aware signal styling
a compact live dashboard
The Stochastic Oscillator measures where the current close sits relative to its recent price range, and its two core lines — %K and %D — are commonly used to spot momentum shifts, overbought/oversold conditions, and crossover signals.
What it shows
📊 Mid-centered stochastic histogram — instead of plotting Stochastic only in its standard form, the script centers the histogram around the 50 level so bullish and bearish pressure become easier to compare visually.
📈 %K line and ghost %D line — the main momentum line stays visually dominant, while %D acts as a softer confirmation layer.
🎯 Adaptive zones — rather than relying only on static 80/20 thresholds, the script calculates percentile-based extreme zones from recent Stochastic behavior. Traditional Stochastic readings above 80 are often considered overbought and readings below 20 oversold, but adaptive thresholds can better reflect changing market behavior.
🗜️ Combined squeeze regime — the script measures both:
compression around the midline
compression between %K and %D
This creates a composite squeeze state that helps identify low-momentum contraction phases before expansion.
🚦 Sequential BUY/SELL state machine — primary signals are filtered through K/D crossover logic, slope confirmation, and optional extreme-zone requirements.
🔺 Follow-up triangles — repeated same-direction confirmations after the first primary signal can be shown as lighter continuation markers.
🪧 Minimal dashboard — displays state, K/D values, adaptive zone range, slope, and squeeze status.
Core logic
The script is built around the idea that the Stochastic Oscillator is not just an overbought/oversold tool, but a momentum regime detector.
Classic Stochastic compares the latest close to the recent high-low range and is typically interpreted through:
%K and %D crossovers
movement around 80/20 zones
and changes in momentum before price fully reacts
Your script extends that by:
recentering the oscillator around 50
using histogram structure for directional emphasis
adapting extreme zones to recent behavior
and combining crossover quality with slope and squeeze context
This makes it more structured than a standard Stochastic display.
State model
The indicator classifies momentum into five readable states:
Bull Impulse
Bull Recovery
Bear Impulse
Bear Recovery
Neutral
This adds nuance to the usual Stochastic reading because it separates:
strong directional continuation
weaker recovery phases
and non-directional compression
In practice:
Bull Impulse suggests K is above D, above the mid-neutral area, and still rising
Bear Impulse suggests K is below D, below the mid-neutral area, and still falling
recovery states identify improving momentum before full expansion
Signal logic
The script uses a filtered signal engine based on %K / %D crossovers, which are among the most common Stochastic signals.
Primary BUY and SELL signals can be filtered by:
extreme zone location
K slope confirmation
signal mode: Aggressive, Balanced, or Strict
This helps reduce the classic problem of noisy Stochastic crossovers in sideways conditions. Stochastic crossovers are useful, but they generally become more meaningful when combined with trend or momentum context rather than taken in isolation.
How to read it
A practical reading method is:
Use the histogram around the midline to read directional pressure.
Use adaptive zones to identify statistically stretched momentum.
Use %K / %D crossovers for trigger logic.
Use the squeeze state to identify contraction before expansion.
Treat follow-up triangles as continuation confirmation, not as fresh primary entries.
In general:
positive histogram with rising K = improving bullish momentum
negative histogram with falling K = improving bearish momentum
squeeze ON = compressed momentum regime
BUY/SELL labels = primary filtered crossover signals
Features
✅ Mid-centered stochastic histogram
✅ %K and ghost %D structure
✅ Percentile-based adaptive extreme zones
✅ Neutral zone around the 50 midline
✅ Composite squeeze detection
✅ Sequential BUY / SELL state machine
✅ Optional follow-up continuation markers
✅ Overlay and pane signal display options
✅ Minimal live dashboard
✅ Alert conditions for BUY, SELL, and squeeze state
Notes
This indicator is designed to improve the readability of Stochastic momentum structure, especially in transitions between compression, recovery, and impulse phases. Like all Stochastic-based tools, it can produce noisy signals in choppy markets, and overbought/oversold readings should generally be interpreted as momentum context rather than automatic reversal calls.
Author: Gabremoku
Pine Script v6 지표

지표

Swing from stochastic with alertStochastic ZigZag — How It Works
This indicator uses the Stochastic %K (9,3,3) to identify and confirm Swing Highs and Swing Lows on the price chart, then connects them with a ZigZag line.
Swing Detection Logic
When %K crosses below 20 → enters "seeking Low" mode, tracking the lowest price. Once %K crosses above 80, that lowest point is confirmed as a Swing Low (SL)
When %K crosses above 80 → enters "seeking High" mode, tracking the highest price. Once %K crosses below 20, that highest point is confirmed as a Swing High (SH)
If the same swing type repeats before the opposite appears, only the more extreme value is kept
Visual Output
ZigZag line connecting alternating SH and SL points (customizable color, width, style)
Tiny SH / SL labels at each confirmed swing point
Dashed horizontal level lines extending right from each confirmed SH and SL (last 3 of each shown); a level line ends at the bar where price closes through it
지표

지표

Dynamic Time Warped Stochastic. Arc-Lenght Stochastic Oscillator𝐓𝐇𝐄 𝐀𝐑𝐂-𝐊𝐈𝐍𝐄𝐌𝐀𝐓𝐈𝐂 𝐎𝐒𝐂𝐈𝐋𝐋𝐀𝐓𝐎𝐑: 𝐁𝐞𝐲𝐨𝐧𝐝 𝐂𝐡𝐫𝐨𝐧𝐨𝐥𝐨𝐠𝐢𝐜𝐚𝐥 𝐓𝐢𝐦𝐞OverviewFor decades, the standard approach to measuring market momentum has relied on a fatal flaw: chronological time. Traditional oscillators force a rigid, fixed lookback window onto an environment that is fundamentally non-linear. When volatility compresses, chronological indicators generate false signals from microscopic chop. When volatility expands, they lag.This tool abandons chronological time. Instead, it processes market structure through a topological lens, measuring the actual path traversed by price action rather than the arbitrary ticking of a clock. It is an exploration of market kinematics designed to filter out spurious noise and identify true regime shifts.Under the Hood: The Mechanics of Topological Data AnalysisThis is not a smoothed RSI or a standard stochastic oscillator. The underlying engine operates on principles derived from digital signal processing and econophysics.Time-Dilated Lookback: Instead of a fixed N-period lookback, the calculation matrix expands and contracts dynamically. It measures the geometric arc-length (ds) of the price vector. During tight, sideways consolidation, the window stretches to absorb the noise. During explosive expansion, the window shrinks, snapping to the current regime with near-zero lag.Kinematic Tokenization: The script analyzes the primary and secondary derivatives of price to understand the velocity and acceleration of the order flow, separating true institutional displacement from retail trap-moves.Advanced Signal Processing: To present this data cleanly, the raw kinematic output is passed through a multi-pole Gaussian filtration system and a non-linear bounding transform. This creates a hyper-responsive oscillator that maps purely between +1 and -1 remaining completely flat during untradeable chop and only oscillating when true structural momentum is present.
How to Use This Tool
This indicator does not predict the future. It categorizes the present.Regime Identification: Observe the boundaries. When the oscillator is pinned at the extremes, the market is in a dominant, unidirectional regime. Divergence against Time: Because the tool operates outside of chronological time, standard divergences (price making a higher high while the oscillator makes a lower high) carry significantly higher structural weight than those found on traditional indicators.Confluence: Use this as a confirming layer. It is designed to validate structural market shifts, identifying when a swept level or a break in market structure has the underlying mathematical velocity to sustain a new trend.DisclaimerThis script is published strictly for educational and analytical purposes. It is a mathematical exploration of market topology and signal processing. It does not constitute financial advice, nor does it guarantee profitable trades. Past performance of mathematical models does not guarantee future market behavior. Always use strict risk management. 지표