지표

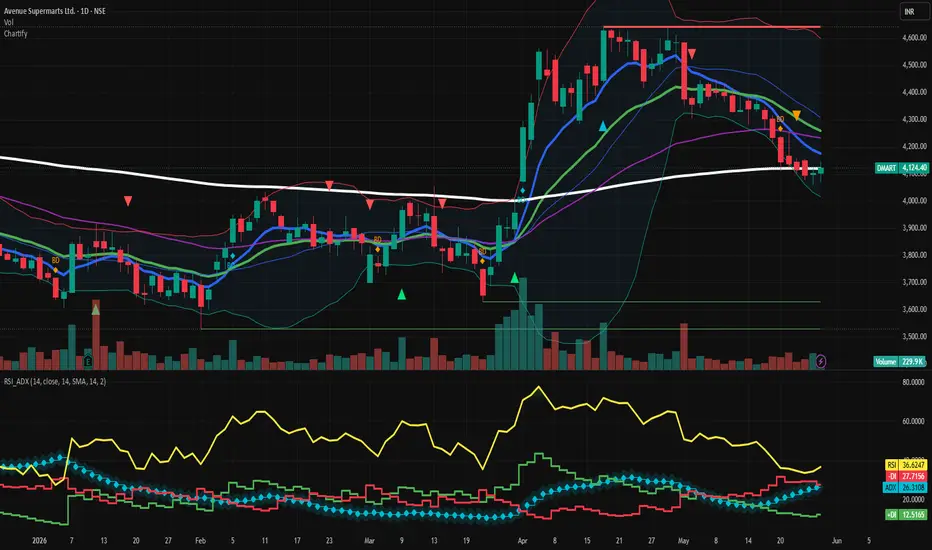
STWP Market MatrixOverview
STWP Market Matrix is a multi-factor market dashboard designed to consolidate several commonly used technical concepts into a single visual framework.
Most technical indicators focus on one aspect of market analysis, such as trend, volume, volatility, or support and resistance. STWP Market Matrix combines these factors into a structured dashboard so traders can evaluate market conditions from multiple perspectives without switching between several indicators.
The objective is not to generate buy or sell signals, but to provide a quick and organized view of trend direction, participation, relative strength, volatility conditions, and key market reference levels.
________________________________________
Why This Indicator?
Market decisions are often influenced by multiple factors rather than a single indicator. A stock may show a bullish trend but weak participation, strong volume but poor relative strength, or favorable structure while trading below key reference levels.
STWP Market Matrix brings together:
• Trend Analysis (EMA Structure)
• VWAP Positioning
• Buyer vs Seller Participation
• Volume Assessment
• Market Structure Analysis
• Multi-Timeframe Confirmation
• Relative Strength vs NIFTY
• Daily Volume Context
• Pivot Reference Levels
• Volatility Assessment
into one dashboard to help users evaluate these conditions simultaneously.
________________________________________
Dashboard Components
Trend
Trend is determined using Fast and Slow Exponential Moving Averages (EMA).
Bullish: Fast EMA above Slow EMA
Bearish: Fast EMA below Slow EMA
This provides a simple directional bias.
________________________________________
VWAP
Displays whether price is trading above or below the Volume Weighted Average Price (VWAP).
VWAP is commonly used by traders to assess intraday strength and market positioning.
________________________________________
Buyers & Sellers
These metrics evaluate the balance between bullish and bearish candle pressure.
The goal is to provide a simple visual indication of whether buyers or sellers currently have greater influence on price movement.
________________________________________
Volume
Current volume is compared against average volume to identify participation levels.
Higher-than-average volume may indicate stronger market participation, while lower volume may suggest reduced activity.
________________________________________
Market State
The indicator classifies market conditions into:
Breakout
Breakdown
Range
based on recent price structure and historical highs/lows.
________________________________________
Price Structure
Price structure evaluates whether the market is producing:
Higher Highs and Higher Lows
Lower Highs and Lower Lows
Sideways Conditions
This provides additional context beyond simple trend analysis.
________________________________________
Multi-Timeframe Alignment
The dashboard evaluates whether higher timeframe EMA conditions support the current chart timeframe.
This helps identify whether trends are aligned across multiple timeframes.
________________________________________
Relative Strength (RS)
Relative Strength compares the selected symbol against the NIFTY Index.
Possible interpretations:
Outperforming
Underperforming
This helps identify whether a symbol is displaying relative leadership or weakness compared to the broader market.
________________________________________
Daily Volume
Daily volume is compared against its historical average to provide additional participation context.
________________________________________
Pivot Reference Framework
The dashboard includes classic pivot calculations based on the previous trading session's:
High
Low
Close
Displayed levels include:
Pivot
R1 to R5
S1 to S5
These levels are intended as objective reference zones that may help identify potential areas of support, resistance, reaction, or expansion.
The levels are not intended as price targets or predictions.
________________________________________
STWP Matrix Panel
Grade
A composite score derived from:
Trend Alignment
VWAP Position
Volume Participation
Relative Strength
Multi-Timeframe Confirmation
Grades range from D to A+.
Higher grades indicate stronger alignment among the evaluated factors.
________________________________________
Flow
Flow evaluates participation bias using candle position and volume behavior.
Possible states:
Accumulation
Distribution
Balanced
________________________________________
Energy
Energy evaluates volatility conditions using:
Bollinger Band Width
Average True Range (ATR)
Possible states:
Building
Normal
Exploding
This can help identify periods of contraction and expansion.
________________________________________
Risk
Risk provides a simplified assessment of current market conditions using momentum and volatility characteristics.
Possible states:
Low
Medium
High
________________________________________
Opportunity
Opportunity summarizes overall market conditions based on the dashboard's underlying factors.
Possible states:
Excellent
Good
Average
Avoid
This metric is intended to provide context and should not be interpreted as a trading recommendation.
________________________________________
Suggested Workflow
A possible workflow for using the dashboard:
Review Trend and VWAP alignment.
Evaluate Market State and Price Structure.
Check Relative Strength versus NIFTY.
Assess volume participation.
Review Pivot and Support/Resistance levels.
Evaluate Grade, Flow, Energy, Risk, and Opportunity readings.
Combine observations with personal analysis, trade planning, and risk management.
________________________________________
Limitations
The indicator relies entirely on historical price and volume data.
Pivot levels are reference zones and not guarantees of future market reactions.
Relative Strength readings may vary across instruments and timeframes.
Market conditions can change rapidly during periods of elevated volatility.
No technical indicator can predict future price movement with certainty.
The dashboard should be used as an analytical aid rather than a standalone decision-making system.
________________________________________
Disclaimer
This script is provided strictly for educational and informational purposes.
The indicator does not provide investment advice, research reports, trading recommendations, portfolio management services, or buy/sell calls.
All calculations are derived from historical price and volume data and are intended solely to assist technical analysis.
Users should conduct their own independent research, analysis, and risk assessment before making any trading or investment decisions.
Past performance does not guarantee future results. Financial markets involve risk, and losses may occur.
For users subject to SEBI regulations, this indicator should not be interpreted as a recommendation, solicitation, stock tip, investment advisory service, or research report.
Any trading or investment decision remains solely the responsibility of the user.
© Simple Trade With Patience (STWP)
지표

지표

지표

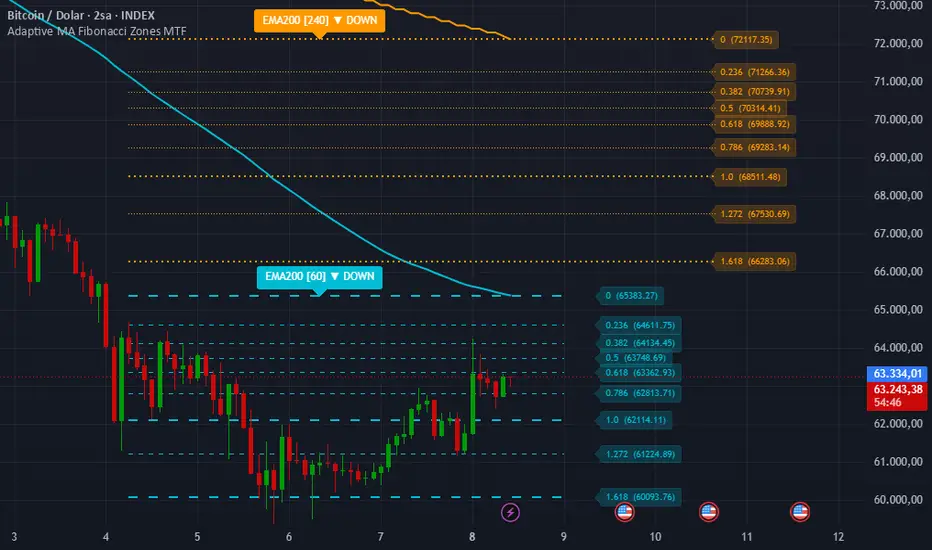
Adaptive MA Fibonacci Zones MTF# Adaptive MA Fibonacci Zones MTF
Adaptive MA Fibonacci Zones MTF is a multi-timeframe technical analysis tool that projects Fibonacci-based price levels around a selected moving average.
The indicator allows traders to choose from multiple moving average types, including EMA, SMA, WMA, SMMA, DEMA, TEMA, HMA, VWMA, ALMA, and KAMA. Two independent higher timeframes can be analyzed simultaneously, making it easier to compare trend structure and potential reaction zones across different market perspectives.
### Features
• Supports multiple moving average calculation methods
• Displays two configurable higher timeframes on a single chart
• Automatically generates Fibonacci-based projection levels around each moving average
• Dynamic bullish and bearish level calculation depending on price position relative to the selected moving average
• Optional Fibonacci level labels
• Visual trend direction labels for each timeframe
• Useful for identifying potential support, resistance, pullback, and expansion areas
### How It Works
The script calculates a selected moving average on two user-defined timeframes. A customizable percentage range is then applied around each moving average, and Fibonacci ratios are projected within that range. When price is above the moving average, levels are projected upward. When price is below the moving average, levels are projected downward.
### Notes
This indicator is designed as a visual analysis tool and should not be considered financial advice. Fibonacci levels and moving averages are analytical references that may be used alongside other forms of technical analysis and risk management techniques.
지표

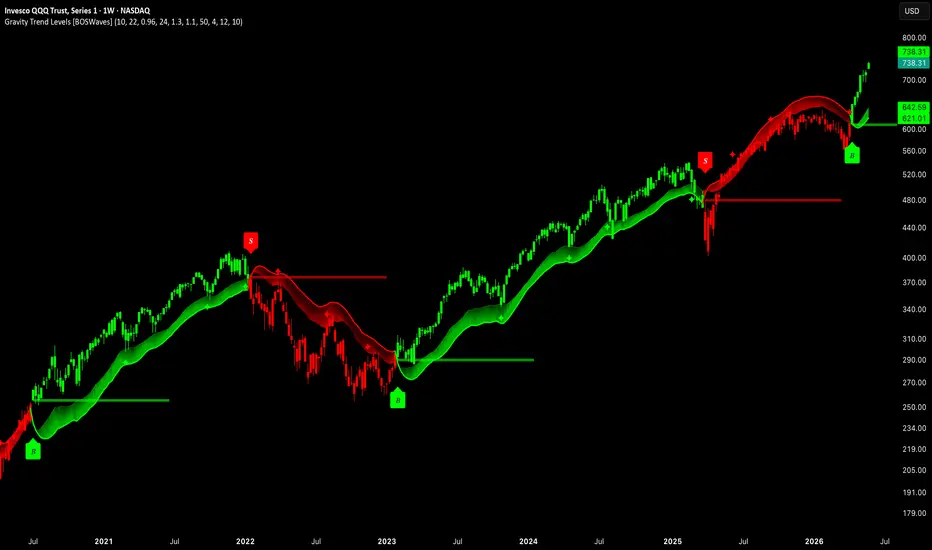
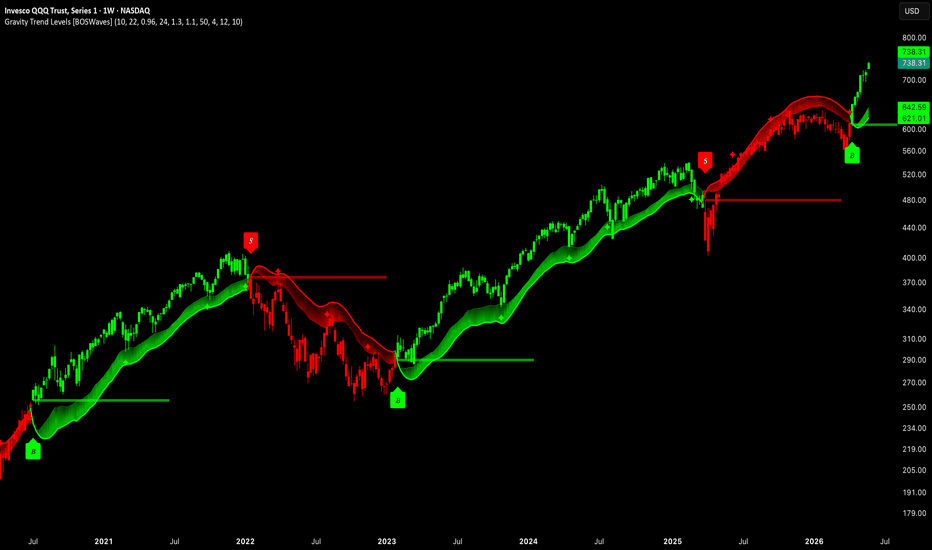
Gravity Trend Levels [BOSWaves]Gravity Trend Levels - Acceleration-Derived Gravity Modeling with Adaptive Cloud Trail and Fail Level Projection
Overview
Gravity Trend Levels is a momentum acceleration-based trend system that models directional gravity through the normalized rate of change of an EMA-derived velocity measurement, where cloud thickness, trail distance, and trend state are continuously adapted based on whether gravitational pull is building, sustained, or decaying rather than through fixed volatility multipliers or static band thresholds.
Instead of relying on conventional moving average crossovers or ATR-scaled bands that treat all market conditions identically, trend state and cloud positioning are determined by measuring price acceleration relative to MAD-normalized volatility, converting that acceleration into a gravity score that decays exponentially when momentum diminishes and drives adaptive band interpolation between configurable tight and wide trail distances.
This creates a trend framework where the cloud reflects genuine momentum dynamics rather than arbitrary indicator levels. The cloud tightens and hugs price during high gravity periods when acceleration is strong and directional pull is confirmed, expands during gravity decay when momentum is weakening, and generates gravity fail levels at the precise price points where trend state changed, marking the exact locations where prior gravitational force collapsed and direction reversed.
Price is therefore evaluated against a cloud that continuously updates its distance from price based on measured acceleration dynamics, producing a trail that reflects the actual pull state of the current trend rather than applying a uniform band regardless of momentum conditions.
Conceptual Framework
Gravity Trend Levels is founded on the principle that trend confidence should be measured through the acceleration characteristics of price momentum rather than through price position relative to fixed indicators, and that the distance between price and its trailing cloud boundary should dynamically reflect whether momentum is actively pulling price in the trend direction or losing gravitational force.
Traditional trend-following tools apply consistent band distances regardless of whether momentum is surging or stalling, producing identical visual representations for high-conviction and deteriorating trend conditions. This framework replaces uniform band geometry with an acceleration-driven gravity model where band distance shrinks under strong gravitational pull and expands as gravity decays, communicating trend health through cloud behavior rather than requiring separate momentum indicators for context.
Three core principles guide the design:
Gravitational pull should be derived from normalized price acceleration rather than from price position alone, ensuring that cloud behavior reflects actual momentum intensity rather than the mere direction of a smoothed average.
Cloud thickness and trail distance should adapt continuously to the measured pull state, contracting during strong gravity and expanding during decay to provide a visual representation of trend conviction at all times.
Gravity fail levels should be projected from the precise price points where trend state changed, marking the locations where gravitational force reversed as permanent structural references for future price interaction.
This shifts trend analysis from static band monitoring into continuous gravitational force measurement where cloud dynamics communicate momentum state and fail levels preserve the structural evidence of prior gravity collapses.
Theoretical Foundation
The indicator combines EMA-based trend baseline construction, MAD volatility measurement, velocity and acceleration derivation from baseline rate of change, gravity scoring with exponential decay, and adaptive trail interpolation that maps pull strength to band distance.
The trend baseline is calculated as an EMA of close over the configured length, providing a smoothed directional reference. Velocity measures the change in baseline over the gravity lookback period, and acceleration measures the bar-to-bar change in velocity. Acceleration is normalized by MAD to produce a dimensionless score that reflects momentum change intensity relative to current volatility. When normalized acceleration exceeds the minimum threshold, gravity is set proportionally to the acceleration reading and capped at a maximum value. When acceleration falls below the threshold, gravity decays multiplicatively by the configured decay rate each bar. Pull converts gravity to a normalized 0-1 range that drives trail multiplier interpolation between the minimum tight distance and the maximum wide distance.
Four internal systems operate in tandem:
Gravity Detection Engine : Derives velocity from EMA baseline change over the gravity lookback, calculates acceleration as the bar-to-bar velocity change, normalizes against MAD, and updates the gravity state either by setting it proportional to current acceleration or applying exponential decay when acceleration subsides.
Adaptive Trail Construction : Converts gravity to a normalized pull value and interpolates the trail multiplier between the configured minimum and maximum settings, scaling MAD to produce upper and lower band distances from the baseline that tighten with strong pull and widen with decay.
Gravity Cloud System : Constructs a one-sided cloud positioned below price in uptrends and above price in downtrends, with cloud thickness scaling proportionally to current pull strength through a separate MAD-scaled thickness calculation that produces a visually dynamic pull indicator.
Gravity Fail Level Engine : On each trend state switch, projects a horizontal line from the flip bar's low for bullish flips and high for bearish flips, extending forward for the configured projection length to mark the price level where prior gravitational force collapsed and direction changed.
This design allows the cloud and trail to respond continuously to gravity dynamics while fail levels accumulate as a historical record of structural gravity collapses.
How It Works
Gravity Trend Levels evaluates price through a sequence of acceleration-aware and gravity-driven processes:
Baseline Calculation : EMA smoothing of close over the configured trend length produces the directional reference from which velocity and acceleration are derived.
MAD Volatility Measurement : Mean Absolute Deviation over the configured length provides the adaptive volatility unit that normalizes acceleration and scales all band and cloud distances.
Velocity Derivation : The difference between the current baseline and the baseline a configurable number of bars ago provides the velocity reading that captures the rate of directional change in the smoothed trend.
Acceleration Calculation : The bar-to-bar change in velocity produces the acceleration reading, which captures whether directional momentum is intensifying or diminishing.
Gravity State Update : Normalized acceleration above the minimum threshold sets gravity proportionally to the acceleration magnitude scaled by eight and capped at two. Below the threshold, gravity decays by multiplying by the configured decay rate each bar.
Pull Normalization : Gravity is divided by 1.5 and capped at one to produce a normalized pull value that maps the full gravity range to a 0-1 scale for trail interpolation.
Trail Multiplier Interpolation : The pull value interpolates between the maximum trail distance at zero pull and the minimum trail distance at full pull, producing a continuously adapting multiplier that scales MAD into upper and lower band distances.
Trend State Logic : Price crossing above the upper band triggers bullish state. Price crossing below the lower band triggers bearish state. State persists until the opposing band is breached.
Cloud Construction : The active cloud positions at the lower band in uptrends and upper band in downtrends, with an inner boundary offset by a pull-scaled thickness producing a two-edge cloud whose depth visually reflects current gravitational pull.
Gravity Fail Level Projection : On each trend switch, a horizontal line is projected from the flip bar at the bar's low for bullish flips and high for bearish flips, extending forward for the configured projection length as a structural fail reference.
Retest Diamond Detection : After the configured signal buffer period from the most recent flip, price touching the cloud inner edge triggers a retest diamond marker with a configurable minimum bar cooldown between consecutive signals on the same side.
Together, these elements form a continuously updating gravity-driven trend system where cloud dynamics reveal pull strength, fail levels mark structural collapse points, and retest diamonds identify price interactions with the inner cloud boundary throughout the trend.
Interpretation
Gravity Trend Levels should be interpreted as a momentum-gravity conviction system with dynamically adaptive cloud geometry and structural fail level mapping:
Bullish Trend State (Green) : Established when price closes above the upper adaptive band, with the gravity cloud positioned below price reflecting the upward gravitational pull state.
Bearish Trend State (Red) : Established when price closes below the lower adaptive band, with the gravity cloud positioned above price reflecting the downward gravitational pull state.
Gravity Cloud : The one-sided filled zone between the outer and inner cloud boundaries reflects current pull strength through its thickness. A thick cloud indicates strong gravitational pull with high trend conviction. A thin cloud indicates gravity decay and diminishing directional force.
Cloud Outer Edge : The primary structural boundary of the gravity cloud, positioned at the active adaptive band and colored fully in the trend direction, representing the outer limit of the gravitational field.
Cloud Inner Edge : The pull-scaled inner boundary of the cloud, representing the nearer edge of the gravitational zone and the threshold for retest diamond detection.
Gravity Fail Levels : Horizontal lines projected from trend flip bars at the flip bar's low for bullish flips and high for bearish flips, marking the exact price level where prior gravitational force collapsed. These levels persist as structural references for the configured projection length.
𝑩 Buy Signals : Green labels appearing below the bar when trend state switches from bearish to bullish, marking the gravity flip bar where upward pull has been established.
𝑺 Sell Signals : Red labels appearing above the bar when trend state switches from bullish to bearish, marking the gravity flip bar where downward pull has been established.
✦ Retest Diamonds : Small star diamonds plotted below bars during bullish retests and above bars during bearish retests when price touches the cloud inner edge after the signal buffer period, identifying interactions with the gravitational boundary during the trend.
Colored Candles : Optional bar coloring reflects current trend state direction, providing continuous directional context independent of cloud proximity or signal generation. Note: The original chart candles must be disabled in chart settings for the trend-colored candles to display properly.
Cloud thickness dynamics, fail level locations, and retest diamond positioning collectively provide more information than trend direction alone.
Signal Logic & Visual Cues
Gravity Trend Levels presents two primary trend transition signals alongside continuous cloud retest monitoring:
Buy Signal (𝑩) : Green label appears when trend state switches from bearish to bullish via upper band crossover, indicating gravitational pull has reversed to the upside and a fail level is projected from the flip bar's low.
Sell Signal (𝑺) : Red label appears when trend state switches from bullish to bearish via lower band crossunder, indicating gravitational pull has reversed to the downside and a fail level is projected from the flip bar's high.
Retest diamond detection provides continuous secondary monitoring, marking price touches of the cloud inner edge throughout the established trend after the signal buffer period with per-side cooldown enforcement.
Alert generation covers bullish and bearish gravity trend flips and any retest diamond occurrence for systematic monitoring workflows.
Strategy Integration
Gravity Trend Levels fits within momentum-informed and adaptive trend-following approaches:
Gravity Flip Entries : Use trend state switches as primary entry triggers where gravitational acceleration has driven price through the adaptive band, entering in the flip direction with the projected fail level providing an immediate structural reference for invalidation.
Cloud Thickness Conviction Reading : Monitor cloud thickness as a real-time gravity strength gauge. A thick, prominent cloud indicates strong active pull supporting the trend. A thin, contracting cloud warns of gravitational decay and warrants reduced confidence in trend continuation.
Fail Level Framework : Use gravity fail levels as structural references for subsequent price interaction, monitoring whether price respects or violates the level where prior gravity collapsed to assess the structural significance of the most recent trend change.
Retest Diamond Re-entry : Treat cloud inner edge retests after the signal buffer period as potential continuation opportunities within the established trend, using the diamond signal as a lower-risk re-entry reference relative to the initial flip signal.
Cloud Proximity Risk Management : Use the outer cloud edge as a dynamic trailing reference for position management, maintaining directional bias while price remains beyond the cloud and reassessing when price approaches or enters the gravitational zone.
Multi-Timeframe Gravity Alignment : Apply higher-timeframe gravity trend state as a directional bias filter, engaging with lower-timeframe flip signals only when they align with the established higher-timeframe gravitational direction.
Technical Implementation Details
Core Engine : EMA baseline with MAD volatility measurement for adaptive scaling
Gravity Model : Velocity from baseline rate of change, acceleration from velocity change, MAD normalization, proportional gravity setting with exponential decay
Adaptive Trail : Pull-normalized interpolation between configurable minimum and maximum MAD multipliers
Cloud Construction : One-sided pull-scaled thickness fill between outer and inner boundaries with EMA smoothing on both edges
Fail Levels : Flip-triggered horizontal line projection from bar extreme at configurable length and width
Retest System : Inner cloud edge proximity detection with signal buffer and per-side cooldown enforcement
Visualization : Gravity cloud fill, fail level lines, trend flip labels, retest diamond markers, and optional trend candle coloring
Performance Profile : Optimized for real-time execution across all timeframes with stateful gravity variable maintaining continuous decay between acceleration events
Optimal Application Parameters
Timeframe Guidance:
1 - 5 min : Intraday gravity tracking for scalping with shorter trend length and gravity lookback for faster acceleration detection and responsive cloud behavior
15 - 60 min : Session-level trend identification with balanced gravity decay and moderate trail settings for reliable intraday directional framing
4H - Daily : Swing-level gravity trend mapping with longer trend length and higher decay rate for sustained gravitational pull persistence across multi-session moves
Suggested Baseline Configuration:
Trend Length : 14
Gravity Lookback : 19
Gravity Decay : 0.96
MAD Length : 24
Trail Min (Strong Pull) : 1.0
Trail Max (Weak Pull) : 1.0
Show Gravity Cloud : Enabled
Show Gravity Fail Levels : Enabled
Show Buy/Sell Signals : Enabled
Retest Diamonds : Enabled
Color Bars : Enabled (requires disabling original chart candles in chart settings)
These suggested parameters should be used as a baseline; their effectiveness depends on the instrument's momentum characteristics, volatility behavior, and preferred signal frequency, so fine-tuning is expected for optimal performance.
Parameter Calibration Notes
Use the following adjustments to refine behavior without altering the core logic:
Cloud too wide throughout : Decrease Trail Max to reduce band distance during low gravity periods, bringing the cloud closer to price during momentum decay phases.
Cloud too tight throughout : Increase Trail Max to allow greater band expansion during gravity decay, producing a more visually prominent cloud separation during low-conviction conditions.
Gravity builds too slowly : Decrease Gravity Lookback toward 5 for a shorter velocity measurement window that captures acceleration shifts more rapidly, producing faster gravity activation on momentum changes.
Gravity activates too frequently : Increase Gravity Lookback to smooth the velocity measurement across more bars, requiring more sustained directional change before acceleration registers as gravitational pull.
Gravity decays too quickly : Increase Gravity Decay toward 0.99 to sustain gravitational pull longer between acceleration events, maintaining cloud contraction for more bars after acceleration subsides.
Gravity lingers too long : Decrease Gravity Decay toward 0.80 for faster pull dissipation, allowing the cloud to expand more quickly when momentum weakens and reducing lag between gravity collapse and visual cloud response.
Too many retest diamonds : Increase Retest Cooldown to enforce greater bar separation between consecutive diamond markers, or increase Signal Buffer Period to delay retest detection further from each flip event.
Adjustments should be incremental and evaluated across multiple session types rather than isolated market conditions.
Performance Characteristics
High Effectiveness:
Trending markets with clear momentum phases where gravitational acceleration builds and sustains across multiple bars, producing thick, persistent clouds that visually confirm directional pull throughout the move
Instruments with consistent volatility behavior where MAD normalization accurately calibrates acceleration significance and cloud distance across varying market conditions
Momentum continuation strategies where cloud retest diamonds identify lower-risk re-entry points within established gravity trends after the initial flip signal
Structural reference frameworks where gravity fail levels provide meaningful historical markers at the exact price points where prior directional momentum collapsed
Reduced Effectiveness:
Choppy, low-momentum markets where acceleration readings oscillate without sustained directional pull, producing frequent gravity flips and thin clouds that fail to establish meaningful directional framing
Extremely volatile environments where individual bar acceleration spikes generate momentary gravity readings that decay before producing sustained cloud contraction or reliable trend state persistence
News-driven or gap-heavy instruments where instantaneous momentum changes trigger gravity activation and immediate flip signals without the gradual acceleration buildup the model is designed to detect
Consolidation and sideways conditions where velocity and acceleration remain near zero, preventing meaningful gravity generation and causing the cloud to remain in its expanded low-pull state without directional conviction
Mean-reversion dominant markets where band crossovers trigger frequent state changes that repeatedly project fail levels without the subsequent directional follow-through that validates their structural significance
Integration Guidelines
Confluence : Combine with BOSWaves order flow tools, volume analysis, or structural indicators to validate gravity flip signals with participation context before committing to directional positions
Cloud Thickness Monitoring : Track cloud thickness evolution throughout the trend as an ongoing gravity health assessment. Consistently thick clouds support continuation confidence while progressive thinning signals approaching decay and warrants defensive position management.
Fail Level Awareness : Monitor price behavior when it returns to prior gravity fail levels. These levels mark the exact prices where directional force previously collapsed, making them structurally meaningful references for future support, resistance, or reversal reactions.
Decay Anticipation : Use cloud thinning as an early warning of approaching gravity decay before a formal flip signal is generated. Thinning during an extended trend suggests acceleration is subsiding and the probability of a state change is increasing.
State Discipline : Maintain directional bias aligned with current gravity trend state until a confirmed band crossover flip occurs. Cloud retests and fail level interactions within an established trend do not constitute state changes and should be interpreted as continuation context rather than reversal signals.
Disclaimer
Gravity Trend Levels is a professional-grade momentum acceleration and trend conviction analysis tool. It uses acceleration-derived gravity modeling with adaptive cloud construction and structural fail level projection but does not predict future price movements. Results depend on market conditions, instrument momentum characteristics, parameter selection, and disciplined execution. BOSWaves recommends deploying this indicator within a broader analytical framework that incorporates order flow context, volume analysis, and comprehensive risk management. 지표
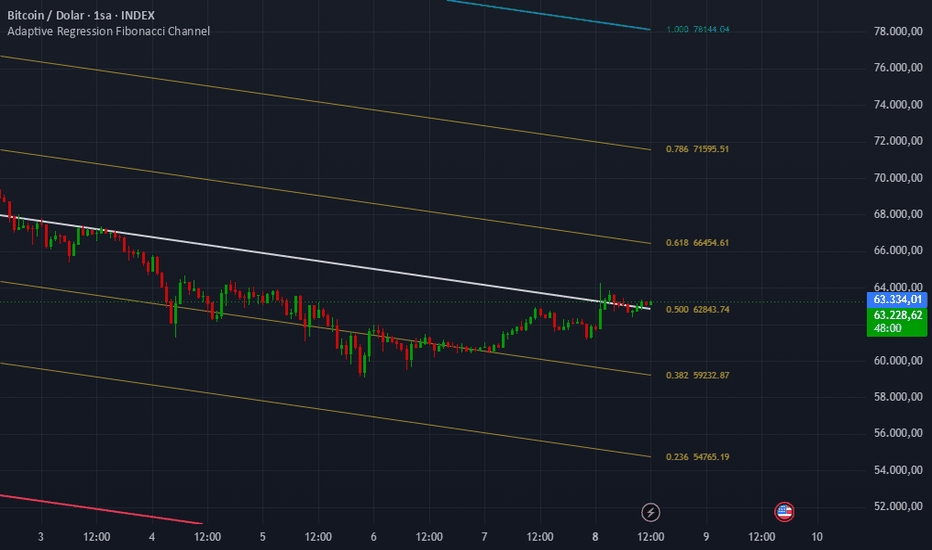
Adaptive Regression Fibonacci Channel# Adaptive Regression Fibonacci Channel
Adaptive Regression Fibonacci Channel is a trend analysis tool that combines Linear Regression with Fibonacci-based channel levels to create a dynamic framework for identifying support, resistance, pullback, and trend continuation zones.
Unlike traditional Fibonacci retracements that require manually selected swing highs and lows, this indicator automatically calculates a regression trend line and builds an adaptive channel around recent price action.
## Features
• Dynamic Linear Regression Trend Line
• Adaptive Upper and Lower Channel Boundaries
• Automatic Fibonacci Levels:
* 0.236
* 0.382
* 0.500
* 0.618
* 0.786
• Real-Time Volatility Adjustment
• Dynamic Support and Resistance Visualization
• Compatible with Any Market and Timeframe
## How It Works
The indicator calculates a Linear Regression line using the selected lookback period.
It then measures the maximum deviation between the regression line and recent price extremes to create an adaptive channel that reflects current market conditions.
Fibonacci levels are distributed proportionally between the upper and lower channel boundaries, providing additional reference zones that may act as potential support, resistance, or reaction areas.
## Typical Applications
• Trend Analysis
Monitor the position of price within the channel structure.
• Pullback Identification
Use intermediate Fibonacci levels to identify potential retracement areas during established trends.
• Support and Resistance Mapping
Dynamic Fibonacci bands can highlight areas where price may react.
• Market Structure Assessment
Evaluate whether price is trading near channel extremes or near its regression mean.
## Notes
This indicator is designed as an analytical tool and should be used alongside other forms of technical analysis and risk management techniques.
No indicator can predict future market movements with certainty.
## Keywords
Linear Regression, Fibonacci Channel, Fibonacci Bands, Trend Analysis, Dynamic Support Resistance, Adaptive Channel, Market Structure, Technical Analysis, Price Action, TradingView
Short Description:
Dynamic Fibonacci channel built around a Linear Regression trend. Automatically adapts to market structure and volatility to highlight potential support, resistance, pullback, and trend continuation zones. 지표
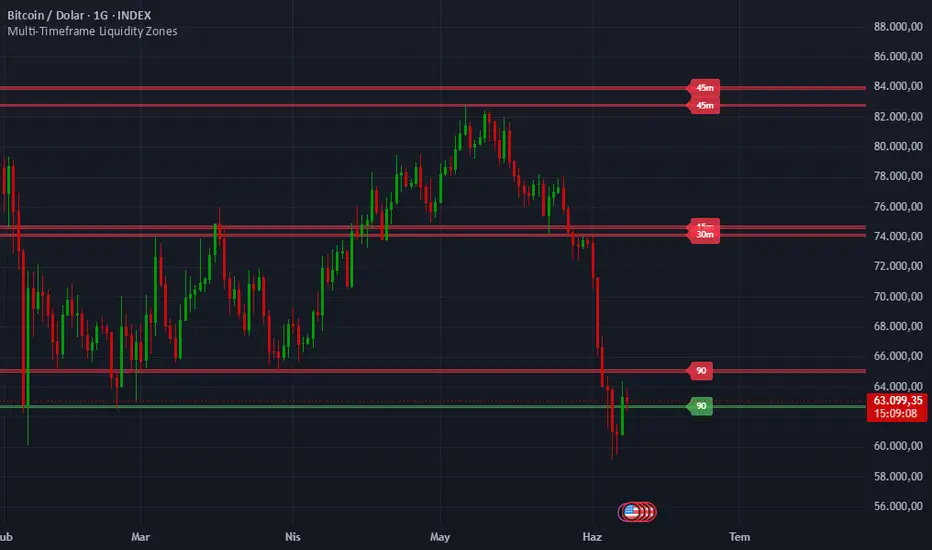
Multi-Timeframe Liquidity Zones# Multi-Timeframe Liquidity Zones
Multi-Timeframe Liquidity Zones automatically identifies and displays significant support and resistance areas derived from pivot structures across multiple timeframes.
Instead of relying on a single timeframe, the indicator combines pivot highs and pivot lows from up to four user-defined timeframes, helping traders identify key reaction zones where price may experience support, resistance, rejection, or liquidity sweeps.
The indicator intelligently filters nearby levels to reduce chart clutter and highlights only the most relevant zones. Each zone is labeled with its originating timeframe, making it easy to identify higher-timeframe confluence areas.
### Features
• Multi-timeframe support and resistance detection
• Up to four customizable timeframes
• Automatic level clustering and duplicate filtering
• Dynamic support and resistance zone visualization
• Timeframe labels for quick level identification
• Adjustable zone width
• Configurable number of displayed levels
• Clean and lightweight chart presentation
### How It Works
The indicator scans pivot highs and pivot lows from selected timeframes and converts them into price zones. Nearby levels are merged to eliminate redundancy and improve readability.
Resistance zones are displayed above the current market price, while support zones are displayed below it. This allows traders to quickly identify potential reversal areas, breakout levels, and liquidity pools.
### Best Used For
• Support and resistance trading
• Breakout confirmation
• Liquidity sweep analysis
• Market structure analysis
• Confluence-based trading strategies
• Multi-timeframe technical analysis
### Disclaimer
This indicator is intended for educational and analytical purposes only. No indicator can predict future market movements with certainty. Always use proper risk management and combine multiple forms of analysis before making trading decisions.
TradingView Short Description:
Identify high-probability support and resistance zones using pivot structures from multiple timeframes. The indicator filters overlapping levels, highlights key liquidity areas, and displays clean multi-timeframe confluence zones directly on the chart.
지표

지표

Price Density S&RPrice Density S&R
Price Density S&R is a price-action based support and resistance indicator designed to identify levels where market activity has repeatedly concentrated over a selected historical period.
Instead of relying on pivot points, oscillators, or volume-based calculations, the script analyzes historical price interactions and groups nearby price points into density zones. Areas that receive repeated interactions are considered potentially significant market levels and are displayed as dynamic support and resistance lines.
How It Works
The indicator scans historical candles within a user-defined lookback range and collects high, low, and closing prices.
Nearby prices are automatically clustered into zones using a configurable merge threshold. Every time price revisits a zone, the interaction count increases. Zones with the highest interaction frequency are prioritized and displayed on the chart.
The result is a map of price levels that have historically attracted repeated market attention.
Features
• Automatic support and resistance detection
• Price-density clustering algorithm
• Adjustable lookback period
• Customizable zone sensitivity
• Minimum touch-count filtering
• Dynamic level ranking based on interaction frequency
• Visual distinction between support and resistance zones
• Optional touch-count labels
• Lightweight and chart-friendly design
Settings
Lookback Bars:
Defines how many historical bars are analyzed.
Zone Merge Threshold:
Controls how aggressively nearby prices are grouped together.
Minimum Touch Count:
Filters out weaker levels with insufficient historical interactions.
Maximum Levels:
Limits the number of displayed support and resistance levels.
Interpretation
Levels with higher touch counts indicate areas where price has historically interacted more frequently. These zones may represent areas of market interest, potential reactions, consolidation, or previous balance between buyers and sellers.
As with all technical analysis tools, historical interactions do not guarantee future market behavior. The indicator should be used alongside broader market context, trend analysis, and risk management techniques.
Notes
This indicator is designed as a visual market-structure tool and does not generate buy or sell signals. It is intended to help traders identify historically active price regions that may be relevant during future market analysis. 지표

지표

ORB WindowsA clean, fully configurable Opening Range Breakout indicator with up to three simultaneous time windows. This script lets you define your own windows. Set them to whatever your session or strategy calls for.
Three configurable windows
Each window tracks its own high and low independently. Window 1 defaults to 5 minutes, Window 2 to 15 minutes, Window 3 to 60 minutes (hidden by default). Set any window to whatever range you want. Lines are visually differentiated: W1 is solid, W2 is dashed, W3 is dotted.
Break and confirm markers
Two signals per level, per window:
Small triangle — price ticked through the level (break)
Larger triangle — candle closed through the level (confirmation)
Filtering on close confirmation reduces noise from wicks and fakeouts.
Range label
When each window locks in, a label shows the high, low, and range size in both points and percentage. Useful for quickly assessing whether the ORB is tight or wide before deciding how to trade the break.
Formation window highlight
A subtle background color marks the W1 formation period so you can see exactly which candles built the range.
12 alert conditions
Four per window: break above, break below, close above, close below. Wire them up however your workflow calls for.
Settings
ORB Windows: set the duration (in minutes) for each of the three windows
Visibility: toggle each window, markers, range label, and formation highlight independently
Colors: fully customizable per window
Designed for intraday use. Works on any liquid instrument with a defined regular session. 지표

지표

Volume BreakoutVolume Breakout
Volume Breakout is an educational chart indicator designed to identify strong bullish volume candles, classify them by market context, and display structured setup reference levels with optional entry, stop-loss, and target lines.
This script is an indicator, not a strategy. It does not place trades, does not simulate orders, and does not provide backtested performance results. The signals and levels shown by the script are analytical references only and should not be interpreted as financial advice or automatic trade instructions.
What the indicator does
The indicator classifies bullish volume events into three main signal types:
1. REV — Reversal Volume Signal
REV is designed to identify an early bullish volume candle near a lower part of the recent price range, before full trend confirmation is present.
A REV signal requires:
* A bullish candle.
* Volume to be the highest within the selected volume lookback.
* Volume to be above the selected volume moving-average multiple.
* Candle body size to meet the selected minimum body percentage.
* RSI to be within the selected acceptable range.
* Price to be near the lower zone of the recent lookback range.
* The market not to be in the defined bullish EMA trend condition.
REV is intended to mark possible early reversal pressure. It is not a confirmed entry signal by itself.
2. VOL — Trend Volume Signal
VOL is designed to identify strong bullish volume candles when the market is already in a bullish trend condition.
A VOL signal uses the same raw volume-spike logic as REV, but it requires the trend condition to be bullish.
The trend condition is based on:
* Price above the fast EMA.
* Price above the slow EMA.
* Fast EMA above the slow EMA.
VOL is intended to show bullish volume participation inside an existing trend. It is not automatically a confirmed entry.
3. BUY — Confirmed Setup Signal
BUY is the most selective signal in the script.
A BUY signal requires:
* A valid VOL signal.
* Breakout confirmation, if enabled.
* Risk percentage to be within the selected maximum risk limit, if enabled.
* Candle range not to be overextended relative to ATR, if enabled.
* Cooldown period since the previous BUY signal to be satisfied.
The BUY label marks a confirmed setup according to the script’s rules. It does not guarantee continuation or profitability.
Core logic
The script starts by identifying a raw bullish volume spike. A raw volume spike requires a bullish candle with strong volume, strong body size, and RSI inside the selected range.
After that, the script classifies the candle based on context:
* If the candle appears near the lower part of the recent range and the EMA trend is not yet bullish, it can become a REV signal.
* If the candle appears while the EMA trend is already bullish, it can become a VOL signal.
* If a VOL signal also satisfies breakout, risk, ATR, and cooldown filters, it can become a BUY signal.
This layered structure is intended to separate early reversal pressure, trend-volume participation, and confirmed breakout-style setups.
Entry, stop, and target reference levels
When a BUY signal appears, the script stores and displays the latest setup levels:
* Entry reference: the high of the BUY candle.
* Stop-loss reference: the low of the BUY candle.
* Target reference: entry plus the selected risk-reward multiple.
These levels are visual references only. They are not orders and are not strategy backtest calculations.
Risk and reward display
The script calculates the risk percentage from the BUY candle high to the BUY candle low.
If the risk filter is enabled, BUY signals are allowed only when this risk percentage is below the selected maximum risk percentage.
The dashboard also displays the last recorded risk and reward percentages for the most recent BUY setup.
Breakout confirmation
When enabled, the breakout filter requires price to close above the highest high of the selected breakout lookback period.
This is intended to reduce signals that occur before price has cleared nearby resistance, but it can also reduce the number of signals.
ATR extension filter
When enabled, the ATR filter blocks BUY signals if the candle range is too large compared with ATR.
This is intended to avoid overextended candles where the distance between the entry reference and stop reference may be too wide.
Cooldown filter
The cooldown setting requires a minimum number of bars between BUY signals.
This is intended to reduce repeated BUY labels during clustered volume activity.
Dashboard
The dashboard summarizes the current setup context, including:
* Trend status.
* RSI value.
* Whether REV is active.
* Whether VOL is active.
* Whether breakout confirmation is satisfied.
* Whether risk is acceptable.
* Last BUY entry reference.
* Last BUY stop-loss and target references.
* Last risk and reward percentages.
* Last BUY age in bars.
The Last BUY Age row helps identify whether the most recent BUY setup is still fresh according to the selected Fresh BUY Max Age Bars setting.
Visual elements
The indicator can display:
* REV labels.
* VOL labels.
* BUY labels.
* Optional fast and slow EMA lines.
* Latest BUY entry, stop-loss, and target reference lines.
* Optional volume label on the last BUY candle.
* Optional box around the latest BUY candle.
* Dashboard panel.
Alerts
The script includes alert conditions for:
* REV Signal.
* VOL Signal.
* BUY Confirmed.
Alerts are informational only. They should not be treated as automatic trade instructions.
Inputs
Volume Settings
* Volume Lookback: number of bars used to check whether volume is the highest in the recent window.
* Volume MA Length: moving average length for volume comparison.
* Min Volume x Average: required volume multiple above average volume.
Candle Strength
* Min Body Size %: minimum candle body size relative to the full candle range.
Trend Settings
* Fast EMA: fast EMA used for bullish trend confirmation.
* Slow EMA: slow EMA used for bullish trend confirmation.
RSI Settings
* RSI Length: RSI calculation length.
* Min RSI For REV / VOL: minimum RSI value allowed for volume signals.
* Max RSI For REV / VOL: maximum RSI value allowed for volume signals.
Signal Control
* Cooldown Bars For BUY: minimum number of bars required between BUY signals.
* Risk Reward: multiplier used for the target reference level.
* Fresh BUY Max Age Bars: number of bars used to classify the latest BUY as fresh.
REV Reversal Volume Settings
* Use REV Reversal Volume Signal: enables or disables REV signals.
* REV Low Lookback: lookback range used to define the lower price zone.
* REV Near Low Zone %: controls how close price must be to the lower part of the recent range.
Breakout Confirmation
* Use Breakout Confirmation For BUY: requires price to break above the selected lookback high.
* Breakout Lookback: number of bars used for breakout confirmation.
Risk Filter
* Use Max Risk % Filter For BUY: enables or disables the maximum risk filter.
* Max Risk %: maximum allowed risk between the BUY candle high and low.
ATR Filter
* Avoid Over-Extended Candles For BUY: enables or disables the ATR extension filter.
* ATR Length: ATR calculation length.
* Max Candle Range x ATR: maximum allowed candle range relative to ATR.
Display Settings
* Show REV Signals.
* Show VOL Signals.
* Show BUY Confirmed Signals.
* Show Last BUY Entry / SL / TP.
* Show Dashboard.
* Show Box On Last BUY Candle.
* Show EMAs.
* Show Last BUY Volume Label.
How to use it
A practical workflow is:
1. Use REV to identify early bullish volume activity near the lower part of a recent range.
2. Use VOL to identify strong bullish volume participation inside an established bullish EMA trend.
3. Use BUY as the most selective setup marker after breakout, risk, ATR, and cooldown filters are satisfied.
4. Review the displayed entry, stop, and target reference levels.
5. Check the dashboard to confirm whether the setup is fresh and whether risk conditions are acceptable.
6. Confirm any setup with your own market structure, liquidity levels, higher-timeframe trend, and risk management.
Important limitations
This indicator does not predict future price movement.
A REV, VOL, or BUY signal does not guarantee continuation, reversal, or profitability.
The entry, stop-loss, and target lines are reference levels only.
Volume signals can be less reliable on illiquid symbols, abnormal news candles, pre-market data, or instruments with inconsistent volume data.
Breakout filters can still produce false breakouts.
ATR filters can block some valid moves and allow some weak moves depending on volatility conditions.
EMA trend filters are lagging by nature.
Users should test the indicator across multiple symbols, timeframes, and market conditions before using it in any decision-making process.
Recommended use
Volume Breakout is used as a structured volume-and-breakout analysis tool. It is designed to help traders organize volume spikes, trend context, breakout confirmation, and risk-reference levels in one chart view.
지표

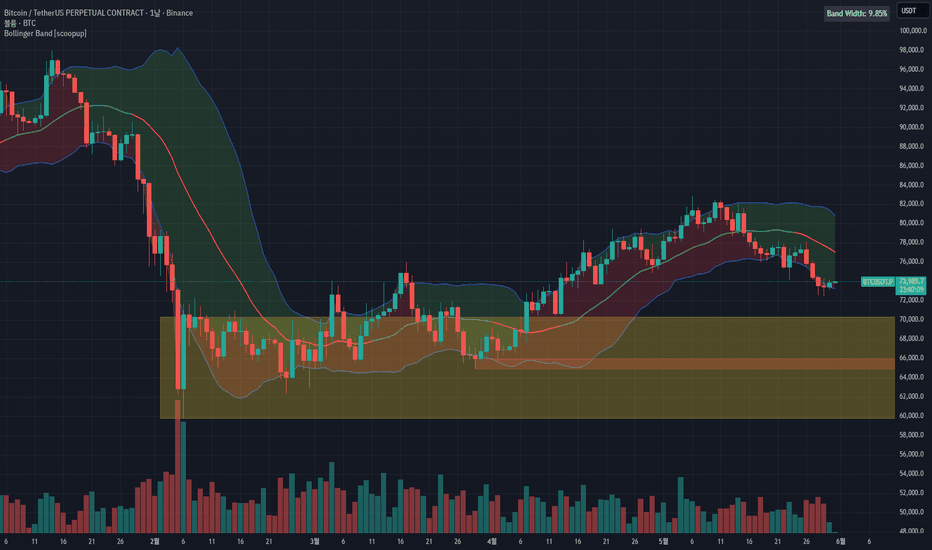
Bollinger Band [scoopup]Overview
A Bollinger Bands–based indicator that shows trend direction (up/down) through the basis line color, displays band width (volatility) as a percentage, and marks the most recent meaningful lows (demand zones) on the weekly and daily timeframes as boxes. It lets you view statistical volatility and the real low zones where buying previously stepped in — all on a single chart.
Default settings are Length 21 and StdDev 1.618, based on the Fibonacci number (21) and the golden ratio (1.618).
Components
1. Bollinger Bands (Upper / Basis / Lower)
Defaults: Length 21, StdDev 1.618
Upper band, basis (middle), and lower band. The bands widen and narrow with volatility.
2. Basis Line Trend Color (Daily-based)
The color of the middle basis line indicates trend direction.
Logic: over a set lookback, it compares the cumulative size of the "close-to-lower" area (red) versus the "upper-to-close" area (green).
Red area dominant → uptrend → basis line GREEN
Green area dominant → downtrend → basis line RED
The longer the close stays near the lower band (larger red area), the more it is read as base-building before a move higher.
This color is always calculated from Daily data, regardless of the chart timeframe. Whether you view it on the 15m, 1h, or 4h chart, the daily trend color stays consistent.
3. Fill
Upper band ↔ close: semi-transparent green
Close ↔ lower band: semi-transparent red
Lets you quickly read where the close sits within the bands.
4. Band Width (%)
Formula: (Upper − Lower) / Basis × 100
Displays the current band width in a corner table as Band Width: X.XX%.
Lower = volatility contraction (squeeze) → often precedes a large move; higher = volatility expansion.
The Data Window also shows band width % and band width (price difference), including on historical bars.
5. Recent Lows
Weekly recent low = yellow box / Daily recent low = red box
Shows only the most recent pivot (swing) low that sits below the current close. (Lows above the close are skipped; if the latest low is above the close, the prior low is used instead.)
Box height spans the low ↔ the close at that point, and extends to the right to show a still-valid support/demand zone.
How to Read It
Basis green + close near the lower band → watch for a potential bounce after base-building.
Basis red + close near the upper band → watch for overextension/pullback risk.
Band Width % contracting (squeeze) → watch for an upcoming volatility expansion.
Recent low boxes (yellow/red) act as first support candidates on a pullback. A close below the box signals support failure.
Key Settings
Bollinger Bands: Source, Length (default 21), StdDev (default 1.618), Band Color / Width / Style
Basis Line: Show Basis, Basis Width, Ratio Length, Up / Down Color
Fill: Show Fill, Upper / Lower Fill Transparency
Band Width: Show Band Width %, Table Position, Text Size
Recent Lows: weekly/daily toggles, Pivot Length, Box Color
Tips
This is a supporting tool for reading trend direction + volatility + support zones together, not a standalone trade signal.
Reliability increases when the daily trend color and a recent low box line up in the same area.
Adjust StdDev and Ratio Length to fit each instrument's volatility.
Disclaimer
This indicator is for reference only and does not guarantee trading profits. All trading decisions and responsibility rest solely with the user. 지표
지표

Smart-Limited Bar Support & Resistance + Trend Lines# Smart-Limited Bar Support & Resistance + Trend Lines
## Overview
Smart-Limited Bar S/R + Trend lines is a market structure indicator designed to automatically identify key support and resistance levels while drawing dynamic trend lines based on price action structure.
Unlike traditional indicators that rely solely on moving averages or lagging calculations, this tool focuses on actual market structure by tracking swing highs, swing lows, higher lows, and lower highs.
The indicator is designed to help traders quickly visualize:
- Current support and resistance levels
- Trend line-based support
- Trend line-based resistance
- Structural swing points
- Potential breakout areas
---
## Features
### Dynamic Support and Resistance
The indicator continuously monitors a user-defined look back period and identifies:
- Highest High (Resistance)
- Lowest Low (Support)
By default, the script uses the last 20 bars.
When a new high or low is established within the look back window, the support or resistance level is automatically updated.
When price breaks a support or resistance level, the horizontal line stops extending, allowing traders to clearly see where the level was invalidated.
---
### Structural Swing Detection
The indicator uses pivot-based market structure analysis to identify significant turning points.
A swing high is confirmed when price forms a local peak.
A swing low is confirmed when price forms a local bottom.
Users can adjust the Pivot Strength setting to control the sensitivity of swing detection.
Higher values:
- Fewer swings
- Stronger structure
- Cleaner trend lines
Lower values:
- More swings
- Faster reaction
- Increased sensitivity
---
### Resistance Trend Lines (Lower High Structure)
The indicator automatically identifies Lower High formations.
When a new confirmed swing high is lower than the previous swing high, a resistance trend line is drawn.
This helps traders identify:
- Downtrends
- Descending resistance
- Potential breakout zones
The trendline updates automatically as new lower highs form.
---
### Support Trend lines (Higher Low Structure)
The indicator automatically identifies Higher Low formations.
When a new confirmed swing low is higher than the previous swing low, a support trendline is drawn.
This helps traders identify:
- Uptrends
- Rising support
- Potential continuation zones
The trend line updates automatically as new higher lows form.
---
### Historical Validation
Before displaying a trend line, the indicator evaluates whether the line has already been violated by price action during the swing confirmation period.
This prevents the display of structurally invalid trend lines and improves chart clarity.
---
### Swing Point Visualization
Optional swing markers can be displayed on the chart.
Red markers:
- Confirmed Swing Highs
Green markers:
- Confirmed Swing Lows
These markers help traders visually inspect market structure and understand how trend lines are generated.
---
## Inputs
### Pivot Strength
Controls swing detection sensitivity.
Default: 10
Higher values create stronger, less frequent swing points.
---
### Support/Resistance Look back
Number of bars used to calculate support and resistance.
Default: 20
---
### Minimum Bars Between Swings
Filters nearby pivots to reduce noise.
Default: 10
---
### Show Swing Points
Displays or hides swing markers.
Default: Enabled
---
## Best Use Cases
This indicator is particularly useful for:
- Price Action Trading
- Swing Trading
- Trend Following
- Market Structure Analysis
- Breakout Trading
- Support and Resistance Trading
It can be applied to:
- Stocks
- Indexes
- Futures
- Forex
- Cryptocurrency
and works across all timeframes.
---
## Trading Notes
This indicator is intended to assist with market structure analysis and should not be considered a standalone trading system.
For best results, combine it with:
- Volume analysis
- Risk management
- Trend confirmation
- Multi-timeframe analysis
Always use proper position sizing and stop-loss management when trading live markets.
## Disclaimer
This indicator is provided for educational and informational purposes only. It is not financial, investment, or trading advice.
The indicator is designed to assist with market structure analysis by identifying support, resistance, swing points, and trendlines. No indicator can guarantee future market performance or profitable trading results.
Trading and investing involve substantial risk, including the potential loss of capital. Users should perform their own research, apply proper risk management, and consult a qualified financial professional before making investment decisions.
Use this indicator at your own risk. 지표

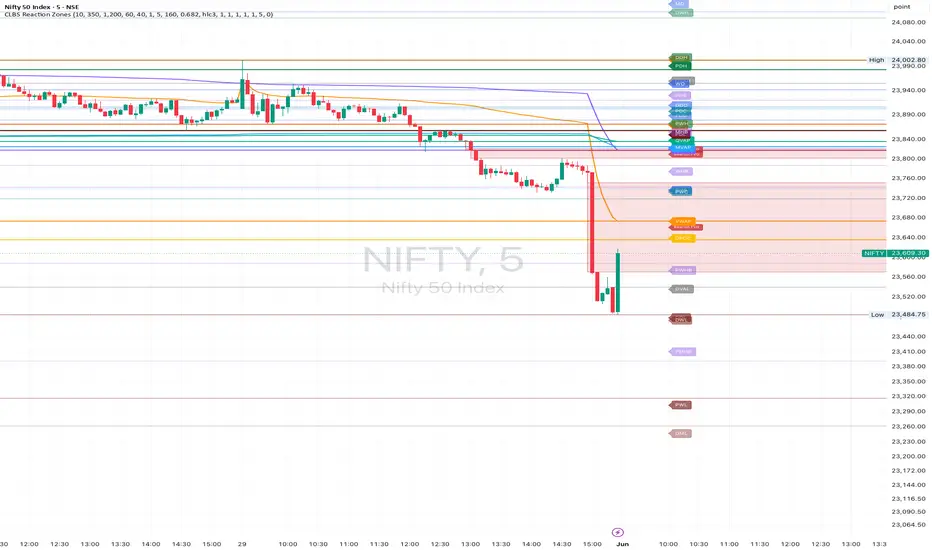
CLBS Reaction ZonesCLBS Reaction Zones is an educational market-structure indicator designed to map important reaction areas on the chart.
CLBS stands for Context, Levels, Behavior and Strategy.
This script combines multiple market reference concepts into one structured visual map. The purpose is not to generate buy or sell signals, but to help traders observe where price may react, accept, reject, rotate or expand.
Main components:
• Developing day levels
• Previous day levels
• Developing week levels
• Previous week levels
• Developing month levels
• Previous month levels
• Initial Balance High and Initial Balance Low
• Initial Balance range projection
• Developing day Point of Control, Value Area High and Value Area Low
• Daily, Weekly, Monthly, Quarterly and Yearly VWAP
• Optional VWAP bands
• Fair Value Gap zones using three-candle imbalance logic
VWAP logic:
The VWAP hierarchy uses anchored VWAP calculations for different periods. Daily VWAP resets at the start of each new day. Weekly VWAP resets at the start of each new week. Monthly VWAP resets at the start of each new month. Quarterly VWAP resets every three months. Yearly VWAP resets at the start of each new year.
VWAP is calculated using cumulative price multiplied by volume divided by cumulative volume for the selected period.
Value area logic:
The developing day value area uses a simple volume distribution model. Price is divided into buckets, volume is accumulated inside those buckets, and the highest-volume bucket becomes the developing Point of Control. Value Area High and Value Area Low are calculated around the Point of Control using the selected value area percentage.
Fair Value Gap logic:
Fair Value Gap zones are based on a three-candle imbalance model. A bullish gap is detected when the high from two candles back is below the current low. A bearish gap is detected when the low from two candles back is above the current high. Filled gaps can be removed automatically.
How to use:
Use this indicator as a market reading map. Watch how price behaves around VWAP, Initial Balance, previous session references, value area levels and fair value gaps. Reaction, acceptance and rejection around these levels can help traders build context.
This script is for educational and analytical use only. It does not provide financial advice, investment advice, trading recommendations, buy signals or sell signals. Traders should use their own analysis, risk management and decision-making.
지표

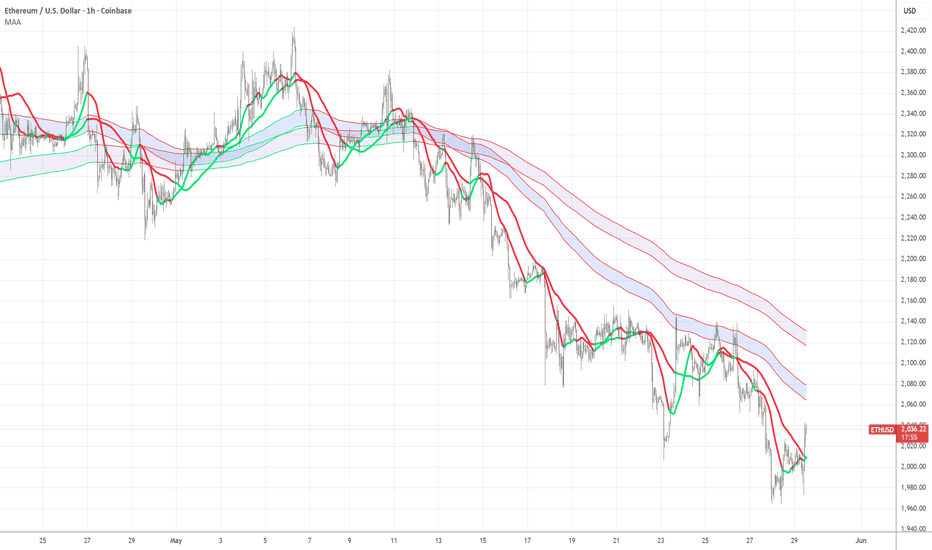
Moving Average Architect (MAA)Moving Average Architect (MAA) is a highly customizable moving average framework designed to help traders build, visualize, and analyze moving averages their way.
Create simple moving average layouts, high/low moving average zones, dynamic support and resistance bands, long-term trend structures, or fully custom moving average stacks.
Whether you prefer a single EMA, layered moving average ribbons, or multi-timeframe-style moving average zones, MAA gives you the flexibility to design the chart structure that best fits your trading style.
The example image demonstrates one possible Moving Average Architect setup using:
20 EMA and 50 EMA with Price Relative Coloring enabled
200 EMA High / Low zone
400 EMA High / Low zone
The short-term moving averages automatically change color based on whether price is above or below them, while the 200 and 400 EMA bands create dynamic support and resistance zones that can help visualize longer-term trend structure and areas of market reaction.
How To Use
Turn on any combination of up to 10 moving averages. For each MA you can configure:
Moving Average Type (SMA, EMA, SMMA/RMA, WMA, VWMA)
Price Source (Open, High, Low, Close, etc.)
Length
Color
Thickness
Line Style (TradingView Style tab)
Create Moving Average Lines or Zones. Enable shading between adjacent moving averages. Examples:
200 EMA High and 200 EMA Low with shading enabled between the high/low MA. Creates a dynamic moving average zone often used as support or resistance.
20 EMA Close and 50 EMA Close. Creates a short-term trend structure.
Enable Price Relative Coloring. Optionally color moving averages based on price position. This can make trend alignment and market structure easier to identify at a glance.
Above MA = Bullish Color
Below MA = Bearish Color
Key Trading Concepts
Moving averages are among the most widely used technical analysis tools.
Price above rising moving averages often suggests an uptrend.
Price below falling moving averages often suggests a downtrend.
Some traders find zones more useful than individual moving averages because markets often respect regions rather than exact prices.
Features
Up to 10 fully configurable moving averages
SMA, EMA, SMMA/RMA, WMA, and VWMA support
Configurable source selection
Dynamic moving average zones
Custom zone shading
Price-relative coloring
Adjustable line thickness
Adjustable line style
Overlay chart support
TradingView native alerts
Designed for trend, structure, and confluence analysis
지표
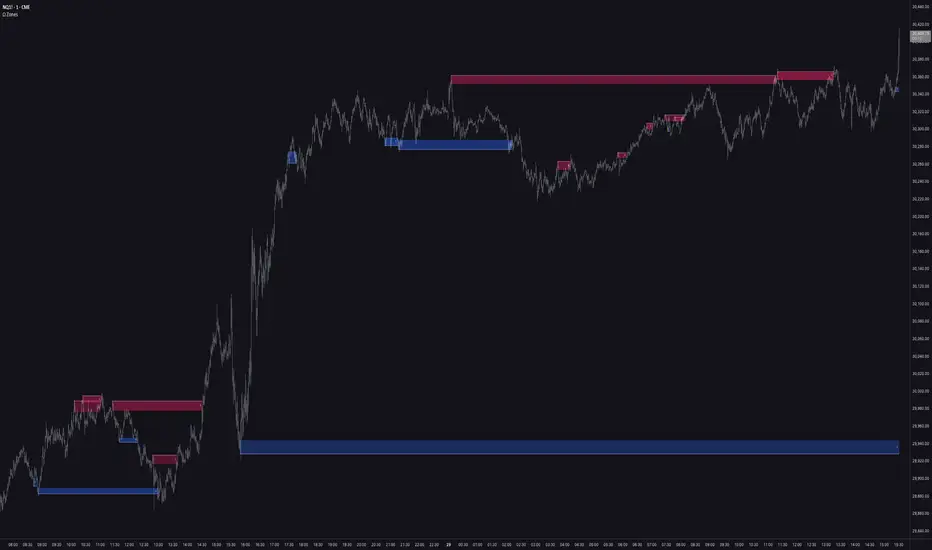
Omega Zones [OmegaTools]Omega Zones
Overview
Omega Zones is a supply and demand mapping tool that automatically detects, scores, and manages institutional order-block zones directly on the price chart. Rather than treating every swing as equally significant, it identifies the specific candles where meaningful order flow originated, grades each one on a multi-factor confidence scale, and then tracks its entire lifecycle — from untouched, to tested, to broken. The result is a clean, self-maintaining map of the price levels where supply and demand are most likely to react, with the strongest zones visually emphasized and weaker noise filtered out.
The indicator runs as an overlay on any symbol and any timeframe.
How It Works
Every zone is anchored to a confirmation window whose length you control through the Confidence Bars input. This is the central design idea of the tool: a zone is only registered once price has had a defined number of bars to validate the move away from its origin. A short window plots zones earlier and closer to real time; a longer window demands more confirmation before committing a level to the chart. This lets you tune the trade-off between recency and reliability instead of being locked into a fixed lookahead.
Within that window, Omega Zones detects order blocks through two independent structural pathways :
Swing reversal — a confirmed swing high or low (built from an asymmetric pivot: a longer window on the left, the confirmation window on the right) where price subsequently reclaims back through the pivot's extreme and thrusts away with conviction. The zone is anchored to the true origin candle — the last opposite-colored candle before the move — rather than naively to the pivot bar itself.
Trend pause — a compact base candle bracketed by directional momentum on both sides (the classic rally-base-rally and drop-base-drop structures). A tight bullish pause inside an advance becomes demand; a tight bearish pause inside a decline becomes supply. The momentum leg leaving the base is measured across the full confirmation window, so longer windows require sustained follow-through.
The Confidence Score
What separates a high-probability zone from a marginal one is not whether it formed, but how it formed. Each detected zone is graded on a composite strength score that aggregates several orthogonal pieces of evidence:
Displacement — how forcefully price left the zone, measured in volatility-adjusted (ATR) units, with additional credit awarded for exceptionally strong departures.
Volume conviction — the volume on the origin candle expressed as a standardized z-score against its recent distribution, scored on a graduated scale so that progressively heavier participation earns progressively more confidence. This is the most heavily weighted dimension of the score, reflecting that genuine order blocks are footprinted by abnormal volume.
Fair value gap — whether the origin produced a three-candle imbalance, a signature of aggressive, one-sided execution.
Liquidity sweep — whether the origin candle ran a prior high or low before closing back inside, capturing stop-hunt and absorption behavior.
The combined score drives two things: the zone must clear the minimum confidence set by the Filter input to be drawn at all, and the opacity of each zone scales with its score, so stronger levels appear bolder and weaker ones fade into the background. Each box is also labeled with its numeric strength for quick reference.
Adaptive Zone Geometry
When the origin candle is dominated by a rejection wick, Omega Zones intelligently narrows the zone to the candle's body rather than its full range — marking where the orders actually sit instead of the rejection tail. When the candle is more balanced, the full high-to-low range is used. This produces tighter, more precise zones and cleaner retest behavior.
Zone Lifecycle Management
Each zone carries a live state that the tool tracks bar by bar:
Virgin — untested; price has not yet entered the zone.
Touched — price has tapped the zone and reacted, but has not closed through it.
Broken — price has decisively closed beyond the zone, invalidating it.
Active zones extend forward automatically until they are broken. How spent zones are handled is governed by the Remove Old Orderblocs setting, giving you full control over chart cleanliness:
No — every zone is preserved indefinitely.
Only Broken — zones are removed the moment they are broken.
Only Virgin — only untouched zones remain on the chart; once a zone is tapped it is retained briefly, then cleared, isolating the fresh, unmitigated levels.
Yes — the most aggressive housekeeping, removing zones on break and retiring stale levels by age.
Settings
Confidence Bars — the confirmation window; lower values plot zones sooner and closer to price, higher values require more validation.
Filter — minimum confidence score required to display a zone (Permissive, Normal, or Strict), letting you choose between coverage and selectivity.
Remove Old Orderblocs — the lifecycle housekeeping mode described above.
Lines — choose which boundary lines to draw: the proximal edge, the distal edge, both, or none.
Areas — whether zone boxes extend dynamically to the current bar, stay fixed at their origin, or are hidden.
Bullish / Bearish Colors — fully customizable color scheme applied across boxes, edge lines, and labels.
How To Use It
Treat the zones as decision-support context rather than standalone signals. The boldest boxes mark the levels with the most order-flow evidence behind them and deserve the most attention. Reactions at virgin zones — those being tested for the first time — are generally the highest-quality opportunities, which is precisely what the Only Virgin housekeeping mode is built to surface. Demand zones are natural areas to look for long setups and supply zones for short setups, ideally in alignment with your higher-timeframe bias and confirmed by your own entry method. Raise the Filter to Strict and lengthen Confidence Bars when you want only the most validated levels; loosen both when you want fuller coverage of developing structure.
Notes
Zones are confirmed using completed pivots and a defined confirmation window, so they finalize after that window elapses; this is intentional confirmation logic, not repainting. The tool combines dual-path detection, a graduated multi-factor confidence model weighted toward volume, adaptive body-versus-range geometry, and a full three-state lifecycle with multiple housekeeping modes into a single self-maintaining framework.
Disclaimer
This indicator is provided for informational and educational purposes only and does not constitute financial advice. Trading carries substantial risk, and the past behavior of any tool or market is not indicative of future results. Always perform your own analysis and manage risk accordingly. 지표

ICT/SMC Institutional Intelligence -- Dual Detection [IID]ICT/SMC Institutional Intelligence — Dual Detection
An integrated ICT/SMC structural analysis system built around two independent verdict engines — Continuation and Reversal — that score the same market in parallel and surface what the price action is doing, where the market structure stands, and whether continuation or reversal pressure is building. The system describes conditions. It does not issue buy or sell instructions.
---
█ What Makes It Different
Dual independent verdict engines.
Continuation and Reversal score simultaneously, against the same chart, with configurable conflict resolution — Show Both , Dominant Wins , or CONFLICT Flag — so traders see when both pressures are real, when one is dominant, and when the two are fighting.
-
Multi-factor confluence engine across three categories.
A composite confluence score grouped into Zone , Reference , and Timing buckets, so traders can see what kind of confluence is present, not just how much.
-
Real-time Intelligence Briefing.
A three-column briefing — STATE / OBSERVED / TRACKING — that translates the engine readings into plain structural language and tracks live events like pending sweep confirmations as they unfold.
---
█ Key Capabilities
The system includes BUT NOT LIMITED TOO:
Dual verdict engines
(Continuation and Reversal) scoring INACTIVE → EARLY → FORMING → BUILDING → CONFIRMED, with timeframe-aware multipliers and modifier handling for consolidation, lunch dead-zone, NY overlap, and active sweeps.
-
Structure detection
including Break of Structure ( BOS ), Change of Character ( CHoCH ), and Market Structure Shift ( MSS ) across configurable timeframes, with validation-event freshness gating.
-
Zone management
for Order Blocks (OB) , Fair Value Gaps (FVG) , Breaker Blocks (BB) , Balanced Price Range (BPR) , and Inverted FVG (iFVG) — each treated as dynamic support and resistance with full lifecycle tracking (formation, mitigation, inversion, aging, pruning).
-
Liquidity tracking
including liquidity pool detection, liquidity sweep identification, and a sweep-reclaim confirmation-window finite-state machine that distinguishes a wick raid from a confirmed reclaim with follow-through.
-
Multi-factor confluence scoring
across Zone , Reference , and Timing categories, with configurable STRONG / STANDARD / WEAK tier thresholds.
-
Five structural phases —
Expansion, Pullback, Consolidation, Continuation, Reversal — classified at chart-timeframe speed, each with its own optional alert.
-
Multi-timeframe market-structure grid
showing structure, swing position, zone presence, and trend per row. Rows hidden from the dashboard still compute for scoring.
-
Premium / Discount labelling and Optimal Trade Entry (OTE) zone detection (21–38% discount, 62–79% premium) from the active swing range.
-
Kill-zone awareness
for Asian, London, NY AM, and NY PM sessions, with a lunch dead-zone modifier and asset-class-aware gating.
-
Three-EMA trend system and anchored VWAP (Daily / Weekly / Session / Monday anchors) with previous-anchor reference.
-
Session reference levels
including previous-day high, previous-day low, and midnight open.
-
Impulse classification
with displacement and absorption recognition, volume-climax exhaustion detection (opt-in), and an order-flow bias layer.
-
SMT divergence
against up to two correlated tickers, with configurable inverse-correlation logic.
-
Intelligence Briefing
delivering STATE / OBSERVED / TRACKING context on every confirmed bar.
-
Comprehensive alert system
with alert conditions across three categories, individually toggleable, gated by bar close.
-
Multi-asset support
with asset-class-aware behaviour for forex, crypto, equity-like instruments, and other classes.
! (dashboard-overview.png)
(Screenshot: Full IID Dual dashboard on BTCUSDT during a Pullback phase — Market State verdict band, three-column Intelligence Briefing, multi-timeframe market structure grid, VWAP anchoring, confluence scoring, chart-timeframe intelligence, and Market Context with MAG / IMP / LIQ / BIAS)
---
█ Who It's For
Whether you follow ICT methodology , trade Smart Money Concepts (SMC) setups, or work in pure price action analysis, IID Dual is built to give you structural context without prescribing entries. It is designed for traders who want to read the market, not be told what to do — practitioners who already have an entry framework and want a measured, transparent map of the conditions around their setup.
---
█ How It Works — The System
The system reads the chart in layers: structural events, zone behaviour, liquidity dynamics, confluence, and live tracking — all feeding two parallel verdict engines that score the picture in tandem. The architecture is integrative, not modular-in-isolation. Each layer feeds the next:
Structure detection runs first. Manual pivot logic with an ATR filter generates swing highs and lows, which produce BOS, CHoCH, and MSS validation events. These events have freshness windows — stale structure does not count toward the verdict.
Zone management tracks every reactive level the structure produces. Order Blocks, Fair Value Gaps, Breaker Blocks, BPRs, and inverted FVGs are created, aged, tested, mitigated, and pruned. The system knows which zones are active, which have been touched, and which have inverted.
Liquidity tracking maintains equal-high and equal-low pools and watches for sweeps. When a sweep occurs, a confirmation-window finite-state machine arms, then progresses through reclaim and follow-through — distinguishing a real institutional rotation from a stop-hunt that fails to confirm.
The Intelligence Briefing surfaces what matters from this stream in plain language: what state the system reads, what structural evidence supports it, and what live events are being tracked right now.
The confluence engine measures alignment by counting the active factors across Zone, Reference, and Timing categories, then classifying the percentage into STRONG, STANDARD, or WEAK tiers.
Both verdict engines score this picture in parallel. The Continuation engine combines higher-timeframe bias, confluence, kill-zone alignment, impulse, liquidity-path clearance, volume, and structural bonuses.
The Reversal engine requires hard gates — fresh CHoCH/MSS/BB-retest against bias, plus a prior validated sweep — before it allows a score, then composes its tier from validation age, sweep quality, confluence, impulse, volume, FVG, equal-highs/lows, kill-zone, and SMT divergence.
Conflict routing decides what the trader sees when both engines are active: both sides displayed, the configured dominant engine wins, or an explicit CONFLICT flag is raised.
The trader decides.
! (engine-continuation-breakdown.png)
(Screenshot: Continuation engine on EUR/USD 15M during a bullish trending move — FORMING ▲ BULL 54%, with full component breakdown visible: BIAS 1 + CON 16 + KZ 5 + IMP 6 + LIQ 0 + B8 = 54%, driven by CON; Reversal independently inactive)
! (engine-reversal-breakdown.png)
(Screenshot: Reversal engine on US30 15M after a confirmed CHoCH event — CONFIRMED ▼ BEAR 74%, with full component breakdown visible: VAL 25 + SWP 20 + CON 8 + IMP 7 + KZ 0 + E5 = 74% (CHoCH); Continuation independently EARLY ▲ BULL 22%)
---
█ The Dashboard
The dashboard is a structured top-to-bottom readout, with seven bands designed to be read in order:
Market State
(top) — both engine tiers and percentages plus the central market-state classification
Intelligence Briefing —
STATE / OBSERVED / TRACKING in three cards
Multi-timeframe structure grid —
one row per configured timeframe with TF, swing position, structure pattern, OB up/down, BB, FVG, and trend
VWAP row —
current anchor distance and previous anchor reference
Confluence —
tier summary plus factor breakdown by Zone, Reference, and Timing
Chart Timeframe Intelligence —
volume, swing percentile, volatility, session, and kill-zone status
Market Context —
MAG (nearest magnet), IMP (impulse history), LIQ (sweep status), and BIAS (multi-timeframe consensus)
Every row is individually toggleable. The dashboard position and background opacity are configurable. Critically, structure grid rows hidden from view still compute for scoring — traders can simplify what they look at without losing analytical depth.
! (dashboard-annotated-walkthrough.png)
(Screenshot: Annotated walkthrough of every dashboard band — Market State, Intelligence Briefing, multi-timeframe Structure Grid, VWAP, Confluence, Chart Timeframe Intelligence, and Market Context — each labelled in reading order)
! (structure-grid-closeup.png)
(Screenshot: Per-timeframe structure grid showing one row per configured timeframe with swing position, structure pattern, order block and FVG presence, breaker blocks, and trend — multi-timeframe discount and sweep alignment visible vertically down the columns)
---
█ The Intelligence Briefing
No other ICT/SMC indicator delivers this layer — a three-column briefing that translates the engine readings into plain structural language, telling the trader what the system reads, what evidence it sees, and what events it's tracking right now.
STATE classifies the current market condition —
Continuation phase, Reversal phase, Consolidation, Expansion, Pullback, or DUAL STAND-DOWN when neither engine is sufficiently active — and identifies which engine is dominant when both are scoring.
OBSERVED
describes the structural evidence the system has registered around the current state, expressed in ICT/SMC vocabulary rather than raw values.
TRACKING
is the live monitor. When a liquidity sweep arms the confirmation window, TRACKING shows the pending event, the countdown to the confirmation deadline, and the active kill-zone context. When no event is pending, it shows the directional narrative or stays quiet — silence is information too.
The briefing updates on the last confirmed bar so traders read a stable, non-flickering snapshot of what the system understands about this moment in the chart.
! (intelligence-briefing-closeup.png)
(Screenshot: Intelligence Briefing close-up — STATE classifies the current market reading, OBSERVED describes the structural evidence in ICT/SMC vocabulary, TRACKING reports live events including pending sweep confirmations and active kill-zone context)
---
█ Setup & Configuration
The defaults work out of the box, but a few inputs are worth knowing about — they determine which timeframes the indicator reads from, how its multi-TF grid is structured, and how patient the indicator is when classifying impulse and structure. The three subsections below cover each in turn. All three are independent — changing one does not change the others.
█ Context & Validation Timeframes
The indicator's primary anchor points are two timeframe inputs. Context timeframe (bias) sets the higher TF the indicator reads bias from. Validation timeframe (confirmation) sets the TF where structural events (BOS, CHoCH, MSS) need to confirm before the engines treat them as valid.
The defaults are 1 hour Context and 15 minutes Validation. These match a Day Trader's typical workflow — a higher-TF bias view paired with a lower-TF confirmation window. Scalpers will usually want lower values for both (15m Context / 1m Validation is common). Swing traders running H4 or daily charts will want higher values (4h Context / 1h Validation, or higher).
The two inputs work together but are independent. Changing Context doesn't change Validation; changing either doesn't affect the Trader Type setting or the Structure Grid configuration. Pick the pair that matches the structural read you actually trade — the indicator does the rest.
! (setup-context-validation.png)
(Screenshot: Properties → Inputs → Timeframes — Context timeframe (bias) and Validation timeframe (confirmation) at their defaults of 1 hour / 15 minutes)
█ Structure Grid Configuration
The 7-Timeframe Market Structure Grid is fully customisable. Each of the seven rows has two settings: a timeframe selector (any TF from 1-minute to monthly) and a Show toggle.
The default ladder is Weekly, Daily, 4-hour, 1-hour, 15-minute, 5-minute, 1-minute — covering the most common trading horizons from high-timeframe context down to execution. Any row can be reassigned to a different TF, and rows can be enabled or disabled individually using their Show checkboxes. A trader running a non-standard ladder (e.g., only the four TFs they actually trade) can hide the rest.
Hidden rows still compute for scoring. This is important — the indicator's engines, BIAS aggregation, and confluence logic read from all seven configured rows regardless of which are visible. Hiding a row removes it from the dashboard display, not from the analysis. Customise the visible ladder to match what you want to see ; the indicator continues to use the full 7-TF data for its decisions.
! (setup-structure-grid.png)
(Screenshot: Properties → Inputs → Timeframes — the seven Structure row dropdowns at their defaults (Weekly → 1-minute ladder), each with an individual Show checkbox; in this view, only the 15-minute row is set to Show)
█ Trader Type
Trader Type is a single dropdown with three values: Scalper, Day Trader (default), and Swing. It controls how patient the indicator is.
The setting doesn't change which timeframes the indicator reads. What it changes is the sensitivity applied to that data. Scalper reacts faster: smaller candle bodies count as meaningful, shorter consolidations register, recent structural events qualify as fresh. Swing waits longer: bodies need to be more decisive, consolidations more developed, events more recent. Day Trader sits between them.
The effect shows up in several places — IMP row candle classifications in Market Context, TREND column readings in the Structure Grid, the Structural Phase header in the Verdict Banner, and delivery-state consolidation detection. The same chart and timeframes will produce different engine reads under different Trader Types because the indicator is asking different questions about the same data.
Pick Trader Type to match your trading style — how long you typically hold trades and how patient you are waiting for setups — not the chart timeframe you happen to be viewing. A scalper running a 1-minute chart will likely want Scalper; a swing trader on H4 will likely want Swing. But the mapping isn't enforced — Trader Type just tells the indicator how strict to be.
Trader Type and the timeframe inputs are independent. Selecting a different Trader Type does not change your Context or Validation Timeframe values. For a complete style-switch, change all three together.
! (setup-trader-type.png)
(Screenshot: Properties → Inputs → Trader Profile — the Trader type dropdown open, showing Scalper, Day Trader (default, highlighted), and Swing)
---
█ Reading the Indicator on a Live Chart
The dashboard mockups above show what each section looks like. The four worked examples below show what each section does — captured from real TradingView replay sessions, with the indicator running on price as it would in normal use. Each scenario teaches one state the system can be in.
Conditions Ripening — system naming the pre-confirmation state
! (scenario-conditions-ripening.png)
(Screenshot: XAUUSD 5M during live replay — displacement and impulse are building; the system reports the setup before any signal fires)
(Dashboard view: Verdict Banner + Market Context. Other sections hidden.)
Most indicators are silent until conditions confirm, then they fire. IID Dual reports the state before the signal: when displacement and impulse start building a directional case, the Market State band names it explicitly as CONDITIONS RIPENING · FORMING · PRE-PHASE. The system isn't predicting; it's describing what it sees, with timestamps.
Underneath, the impulse layer doesn't just report a single reading — it shows the progression : HLLW → WEAK → SLID → NOW: STRG ↓ at 138% volume, momentum present. Four stages, each named, each timestamped.
The displacement isn't a wick; the case is building. If the next bars deliver continuation, the engine will progress from FORMING to BUILDING to CONFIRMED. If the move stalls, the ripening narrative dissolves and the system moves on.
█ TRACKING in Action — sweep confirmation window
! (scenario-tracking-in-action.png)
(Screenshot: XAUUSD 5M during live replay — a chart sweep arms the confirmation window; the system reads the event and counts down)
(Dashboard view: Verdict Banner + Intelligence Briefing + Pending Strip. Other sections hidden.)
A sweep alone isn't a reversal — it's a question. When price takes out a swing high or low and the confirmation window arms, the dashboard surfaces the pending event explicitly — here a bear sweep at 4762.905, 4 of 5 bars remaining — and the TRACKING column counts down bar by bar so the trader knows whether they're watching a confirmed reclaim or a failed raid. Above, the verdict banner shows Reversal already reading EARLY ▼ BEAR 81% — the engines have priced the structural case; the pending sweep is the live evidence that confirms or invalidates it.
The dashboard isn't predicting; it's reading the chart in real time and reporting what it sees. If the bar closes back inside the original range before the counter expires, the sweep is confirmed and the structural-reversal case strengthens. If the window expires without a clean close, the raid failed and the system moves on.
█ Divergent Signals — both engines speaking at once
! (scenario-divergent-signals.png)
(Screenshot: XAUUSD 5M during live replay — both engines scoring the same chart: Continuation FORMING bear, Reversal BUILDING bull — the system flags the divergence explicitly)
(Dashboard view: Verdict Banner + Intelligence Briefing. Other sections hidden.)
Most indicators force a single directional read. IID Dual lets both engines speak. When a fresh MSS on chart arms the reversal case but the prior continuation hasn't fully invalidated, the dashboard shows both engines scoring at once — here Continuation FORMING ▼ BEAR 22% alongside Reversal BUILDING ▲ BULL 55%, with the Market State band reporting "DIVERGENT SIGNALS · OPPOSED · ENGINES SPLIT" and the sub-line stating "engines disagree . wait for resolution before acting." The STATE column in the Intelligence Briefing reinforces with "DIVERGENT SIGNALS ⚠ Conflict."
The system isn't choosing for the trader; it's reporting what it sees, in detail. If the trader has configured Dominant Wins , the higher-tier engine (here Reversal at 55%) takes the displayed read. If Show Both or CONFLICT Flag is set, the dashboard surfaces the disagreement rather than resolving it — leaving the read to the trader's judgement.
█ Confluence Breakdown — what KIND of confluence is active
! (scenario-confluence-breakdown.png)
(Screenshot: XAUUSD 5M during live replay — multiple timing factors firing while zone and reference categories sit partial; the dashboard splits the confluence score into its three constituent buckets)
(Dashboard view: Verdict Banner + Confluence row. Other sections hidden.)
Confluence usually arrives as a single number. IID Dual splits it. The CONFLUENCE row reports the headline — here 6/15 STANDARD mixed — but the three category lines beneath name exactly what kind of confluence is active: ZONE 2/7 , REFERENCE 0/4 inactive , TIMING 4/4 .
Read those three lines and the same 6/15 score tells a much sharper story. TIMING is fully saturated — every timing factor the system tracks is firing. ZONE is partial — a sweep and a premium/discount read, but no order block or FVG contribution.
REFERENCE is silent — no EMA or VWAP alignment in play. A trader who relies on EMA structure now knows their preferred confluence layer isn't contributing; a trader who weighs timing knows the timing-side case is as strong as it gets. The headline number is honest; the breakdown is where the read lives.
---
█ Component Reference
The four worked examples above teach what the system does in different market states. The nine entries below cover what each component shows , in isolation — each captured with only that component visible, so its structure and tooltips can be read without competition. The Properties panels in each image are the recipe; replicate any view by setting the same toggles.
█ Chart Overlays
! (anatomy-chart-overlays.png)
(Screenshot: EURUSD 15M — chart populated with the indicator's full visible vocabulary; Structure Grid configured to a single TF on the right as a bridge to the dashboard)
Chart Overlays are the indicator's chart-side teaching layer — they show you what the dashboard is actually reading from. Every zone, structural marker, and event tag the indicator draws directly on price corresponds to a cell or column somewhere in the dashboard.
Zones (OB, FVG, iFVG, BB, BPR) appear as coloured regions with right-edge labels naming what they are. Structural markers (BOS, CHoCH, MSS, DISP) sit at the bars where the indicator detected those events. Sweep tags (SWEEP, SMT BEAR, SMT BULL) mark the levels where liquidity was taken.
Chart overlays don't carry hover-tooltips themselves — the dashboard's other components do the descriptive work. Here, the 1-TF Structure Grid sits next to the chart as a bridge: each chart object the indicator draws on price (BEAR OB, BULL FVG, BOS, SWEEP) corresponds to a cell in the grid's columns.
The tooltip surfaced on the TF cell confirms the system-wide principle: "Timeframe row. Hidden rows can be toggled, but engine computation continues."
The chart-side vocabulary is foundational. Every other section in this reference reads from these objects — the Structure Grid summarises them across timeframes, the Confluence row counts them as factors, the engines score them through tier logic.
This view uses three toggles: Show dashboard, Show chart overlays, and Show 7-timeframe market structure grid (configured to one TF). The Properties panel on the left shows the configuration.
The full multi-timeframe treatment of chart objects is covered next, in the Structure Grid.
█ Verdict Banner
! (anatomy-verdict-banner.png)
(Screenshot: EURUSD 10M — engines scoring in opposition, Market State band naming the divergence; centre cell hovered)
The Verdict Banner is the dashboard's headline read — your one-glance answer to "what state is the market in right now?" . Three cells across the top: Continuation on the left, Reversal on the right, Market State between them. Above all three, a Structural Phase header names the broader regime.
The Market State cell carries a tooltip explaining each state's trigger. Here the band reads DIVERGENT SIGNALS, and the tooltip explains the rule: "One engine is BUILDING+ now while the other was BUILDING+ within 15 bars but faded below BUILDING." That last clause matters — the system holds memory of recently-strong engines for 15 bars, so a state can persist after the engine that earned it has cooled.
The Intelligence Briefing uses the same memory principle on a 30-bar window.
Read the banner as a system. The Continuation and Reversal cells each carry a tier (EARLY, FORMING, BUILDING, CONFIRMED) and a direction (BULL ▲, BEAR ▼) from that engine's own scoring.
The Market State band synthesises: CONDITIONS RIPENING when displacement is building, CONTINUATION PHASE or REVERSAL PHASE when one engine dominates, DIVERGENT SIGNALS when the engines disagree. The sub-line names what's driving the read — "driven by CON" or "driven by BIAS + IMP" . The Structural Phase header at the top (PULLBACK, EXPANSION, REVERSAL, CONSOLIDATION) frames the macro regime.
This view uses just two toggles: Show dashboard and Show verdict banner. The Properties panel on the left shows the configuration.
The Verdict Banner is the only section that always speaks — other sections can read quiet, but the banner always reports something , even if INACTIVE 0%.
█ Modifier & Trade-level Strip
! [Modifier strip — firing with engine impact](anatomy-modifier-strip.png)
(Screenshot: EURUSD 10M — Modifier strip showing tag with Verdict Banner context above; modifier cell hovered)
The Modifier & Trade-level Strip surfaces context the engine scores alone can't show — sessions, sweeps, conflicts, structural exceptions. It's a single row that sits beneath the Verdict Banner, normally quiet, lighting up only when a modifier is firing. When it does, it appears as a labelled tag — ` ` for a recent sweep contribution, ` ` for a session penalty, ` ` for a validation warning, and others.
The hovered tooltip explains the active modifier's effect: "Validation conflict cuts Continuation by 1 tier; Reversal treats it as N/A." That's not a passive label — the modifier is actively changing the engine output.
The Verdict Banner shown above reads Continuation FORMING ▼ BEAR 46%; without the conflict cut, the Continuation engine would presumably sit one tier higher. The double-exclamation ` ` notation marks high-priority modifiers — ones that materially change scoring rather than just nudging it.
Each modifier in the strip's vocabulary has its own scoring rule. The strip is the indicator's way of surfacing context that the engine logic alone wouldn't expose — sessions, sweeps, conflicts, structural exceptions.
This view uses three toggles: Show dashboard, Show verdict banner, and Show modifier and trade-level strip. The strip currently requires the Verdict Banner to be enabled to render — captured here as configured.
█ Intelligence Briefing
! (anatomy-intelligence-briefing.png)
(Screenshot: EURUSD 5M — REVERSAL EMERGING state with active sweep being tracked; STATE column hovered)
The Intelligence Briefing answers "what is the indicator actually seeing right now?" in plain structural language. It translates engine percentages into the kind of observation a trader would make at the chart. Three columns: STATE (the indicator's current classification), OBSERVED (what structural evidence has been detected), TRACKING (what live events the system is watching).
The STATE column tooltip surfaces an engine-logic principle: "Reversal is active now or was BUILDING+ within 30 bars, with Continuation outside handoff control." The system has memory — STATE doesn't just reflect the current bar's read, it reflects whether either engine was strong within a 30-bar window.
The handoff system manages how engines pass control between phases. The Verdict Banner uses a similar 15-bar memory on its DIVERGENT trigger; together, the two windows mean the indicator reports on recent history, not just instantaneous classification.
The OBSERVED column reports validated structural events — what the indicator has actually confirmed on chart. The TRACKING column reports pending events with countdowns — sweeps awaiting close confirmation, structural breaks under validation. When TRACKING is active, the system is mid-evaluation; when it's quiet, no live events are pending.
This view uses just two toggles: Show dashboard and Show Intelligence Briefing. The Properties panel on the left shows the configuration.
The Briefing is the dashboard's translation layer between the engines' percentages and the trader's structural vocabulary.
█ 7-Timeframe Market Structure Grid
! (anatomy-structure-grid.png)
(Screenshot: EURUSD 5M — the grid showing per-timeframe readings across Weekly through 1M, with the 5M row's SWING H/L cell hovered to surface its tooltip)
The 7-Timeframe Market Structure Grid is a per-timeframe snapshot of where price sits in its swing range, what structural events have validated, what unfilled order blocks and FVGs sit at proximity, and what trend mode each timeframe is reading. One row per configured timeframe; one column per structural dimension.
Each cell carries a hover-tooltip with its plain-language meaning. Hovering the 5M row's SWING H/L cell surfaces the tooltip shown: "5 52%. Equilibrium (EQ)." followed by a compact legend — the dot glyph marks the current position in the swing range, arrow glyphs name sweep and reclaim events, and the bracketed tags identify zone-state ( for premium, for discount, for equilibrium, for OTE — the optimal-trade-entry discount zone, for proximity to a swing extreme).
The reading "5 52%" means the 5-minute timeframe sits at the 52nd percentile of its current swing range — squarely in equilibrium. Every other cell in the grid carries the same kind of legend on hover.
The grid earns its keep when read vertically . A single timeframe showing tells you that one chart is in discount; five timeframes showing in the SWING H/L column tells you the whole structure is in discount and that any bullish entry sits with the broader ladder, not against it. The OB↑ and OB↓ columns work the same way — a column showing unfilled bullish order blocks at low proximity across multiple timeframes is a more durable read than the same reading on one timeframe alone.
The TREND column on the far right collapses each timeframe's macro mode into one tag (CON for continuation, PUL for pullback, TRN for transition, REV for reversal); scan that column for the macro picture.
This view uses just two toggles: Show dashboard and Show 7-timeframe market structure grid. The Properties panel on the left shows the configuration.
Hidden rows still compute for scoring. Turning a timeframe off the display removes it from the visible grid, not from the engine — the dashboard simplifies the view, not the analysis.
█ VWAP Row
! (anatomy-vwap-row.png)
(Screenshot: EURUSD 10M — VWAP row showing current and prior-day anchor values; VWAP label cell hovered)
The VWAP Row gives you the chart's daily fair-value reference without having to plot VWAP on chart. Three cells: a label, the current anchored VWAP with distance to price, and the prior-day completed VWAP value.
The label cell carries the row's hover-tooltip: "Selected VWAP anchor is the fair-value reference. Middle shows current anchored VWAP and distance; right shows the prior completed anchor value." The middle cell — here reading `D: 1.16335 dn | 0.02% above` — packs two facts: the VWAP value is dropping (`dn`), and current price sits 0.02% above the VWAP line. Direction and distance reported in the same cell. The right cell — here `PD: 1.16412` — shows where yesterday's VWAP closed, available as a reference even after the new day's anchor has reset.
VWAP serves the indicator's confluence and structural logic as a reactive level — a place price often respects on revisit. The row makes the reference and distance available at a glance without requiring VWAP to be drawn on chart.
This view uses just two toggles: Show dashboard and Show VWAP row. The Properties panel on the left shows the configuration.
The data cells don't carry their own tooltips; the label-level tooltip covers the whole row.
█ Confluence Row
! (anatomy-confluence-row.png)
(Screenshot: EURUSD 10M — confluence reading 7/15 STANDARD mixed; TIMING title hovered)
The Confluence Row answers "how much evidence is the indicator seeing for the current read?" — and where that evidence is coming from. A headline score (here 7/15 STANDARD with a progress bar and a composition label) sits above three category lines: ZONE, REFERENCE, and TIMING.
The TIMING title tooltip teaches one category's firing rule: "Timing factors activate during major killzones and while recent BOS, CHoCH, or MSS events are still fresh." The same activation logic applies by analogy to the others. ZONE factors fire when price interacts with structural zones (OB, FVG, BB, BPR, sweep proximity, premium/discount position).
REFERENCE factors fire when price relates to anchored references (EMA, VWAP). Each category has its own count of how many factors are firing out of how many possible.
The breakdown matters more than the headline number. Here ZONE reads 4/7 (partial), REFERENCE reads 0/4 inactive, TIMING reads 3/4 (near full). Same 7/15 score, but the composition tells a sharper story — timing-led and structurally-supported, with no reference-level alignment. The composition label at the top (here mixed ) names the dominant mode: structural-led when ZONE dominates, reference-led when REFERENCE dominates, timing-led when TIMING dominates, mixed when factors spread across categories.
This view uses just two toggles: Show dashboard and Show confluence row. The Properties panel on the left shows the configuration.
The headline number is honest; the breakdown is where the read lives.
█ Detail Strip
! (anatomy-detail-strip.png)
(Screenshot: EURUSD 10M — the strip showing all five chart-timeframe sub-components active; CHART TIMEFRAME INTELLIGENCE header hovered)
The Detail Strip is the indicator's compact answer to "what's happening right now on this chart?" . Five chart-timeframe context readings packed into one row: volume, swing position, volatility, session state, and killzone countdown.
The section header tooltip names the five sub-components in order: "Chart-timeframe inputs: volume, swing position, volatility, lunch state, and active killzone countdown." Each sub-component reports a small but distinct fact. VOL shows current volume relative to average. SWING reports where price sits within the current swing range and which zone-state applies ( , , , , ).
VLT reports volatility deviation from baseline (`+36%` here). The session indicator names the active session (EARLY LDN visible) including the lunch state mentioned in the tooltip. The killzone countdown reports time remaining in the active killzone window (`11% KZ LONDON 160m`).
These are all chart-timeframe inputs — they read from the timeframe of the chart, not from the multi-TF ladder. The Detail Strip is the indicator's compact context summary for "what's happening right now, on this chart."
This view uses just two toggles: Show dashboard and Show detail strip. The Properties panel on the left shows the configuration.
█ Market Context
! (anatomy-market-context.png) (Screenshot: EURUSD 10M — the four-row block showing structural context; IMP row hovered)
Market Context tells you what the broader trading environment is doing — where the magnets are, whether impulse is building, what liquidity is doing, and whether the multi-timeframe picture leans one way. Four rows sitting near the bottom of the dashboard: MAG (magnet proximity), IMP (impulse progression), LIQ (liquidity state), and BIAS (cross-timeframe directional conviction).
The IMP row tooltip reveals the indicator's candle-classification scoring rule: "STRONG/SOLID candles can score impulse; HOLLOW/ABSORBED/WEAK do not, though ABSORBED can add a Reversal pattern bonus." The IMP row shows the recent progression of candle classifications (`WEAK → SLID → SLID → NOW: STRG ↑ | 120% volume`) — a four-stage history of how impulse has built over recent bars. The Scenario 1 worked example above teaches this progression pattern in context.
Each row in Market Context reports a different aspect. MAG names the nearest magnetic level (prior-day high, VWAP, prior-day low) and which is closest. LIQ reports active liquidity state — sweep awaiting, sweep active, structural-side dominance (BSL = buy-side, SSL = sell-side). BIAS aggregates conviction from all seven Structure Grid timeframes into a single signed read; its calibration tiers are 7 full, 5+ leaning, 3+ scattered, and no consensus.
This view uses just two toggles: Show dashboard and Show market context rows. The Properties panel on the left shows the configuration.
The BIAS row's aggregation from seven structure rows is the dashboard's clearest cross-section data flow — confluence among components, not just within one.
---
█ Alerts
Alert conditions span three categories, each individually toggleable, all gated by bar close (no intra-bar firing) and with built-in per-family cooldowns:
ENGINE alerts
fire when the Continuation or Reversal engine enters CONFIRMED. Master toggles per engine gate alerts only — both engines continue computing and displaying regardless.
-
STRUCTURE alerts
fire on chart-timeframe phase transitions — Expansion, Pullback, Consolidation, Continuation, Reversal — and on confirmed sweep reclaims (after the confirmation-window FSM completes).
-
ZONE alerts
fire when price enters swing-high or swing-low proximity, or when price enters the OTE discount (21–38%) or OTE premium (62–79%) zones.
Use them à la carte. Subscribe to phase transitions for context, to engine confirmations for high-tier readings, or to zone entries for proximity-based attention.
! (alert-categories.png)
(Screenshot: Alert conditions grouped by category — ENGINE for verdict confirmations, STRUCTURE for chart-timeframe phase transitions and sweep-reclaim events, ZONE for swing proximity and OTE discount/premium entries — each individually toggleable and bar-close gated)
---
█ Getting Started
Add IID Dual to any chart. The indicator works on any instrument and any timeframe TradingView supports.
-
Collapse the chart legend (click the arrow next to the indicator name) for a cleaner view — all status-line clutter is already suppressed by design.
-
Read the dashboard. Market State and the Intelligence Briefing give the headline; the structure grid, confluence breakdown, and market context fill in the detail.
-
Configure timeframes under the Timeframes input group to match your workflow, then choose your alert categories.
---
█ Feeling Overwhelmed? Start Simple
Dashboards in this category are often described as overwhelming. IID Dual is built to be turned down. Every section — Verdict Banner, Intelligence Briefing, Structure Grid, VWAP, Confluence, CTI strip, Market Context, Footer, Chart Overlays — is individually toggleable from the Properties panel. Each of the four worked examples above shows a different dashboard configuration — the toggles in their Properties panels are the recipe.
! (feeling-overwhelmed-divergent-demo.png)
(Screenshot: EURUSD 10M · all sections lit · Cont 42% vs Rev 50% · the system speaking in full)
A clean starting point: leave only Market State and the Intelligence Briefing on, and add bands back as their meaning clicks. Anything you hide still computes for scoring — you simplify the view, not the analysis. Every dashboard cell and every input carries a plain-language tooltip on hover, and status-line clutter is already suppressed by design.
! (properties-display-toggles.png)
(Screenshot: Properties → Inputs → Display panel — every dashboard section individually toggleable, with (i) tooltip indicators that reveal plain-language explanations on hover for inputs and dashboard cells throughout)
---
█ ICT/SMC Concepts Used
Break of Structure (BOS) —
price closes beyond a prior swing in the existing trend direction, confirming continuation.
-
Change of Character (CHoCH) —
price closes beyond a prior swing against the current trend, signalling a possible regime change.
-
Market Structure Shift (MSS) —
a higher-conviction structural break, often paired with displacement, marking a transition between bullish and bearish delivery.
-
Order Block (OB) —
the last opposing candle before a displacement move, treated as an institutional reactive level.
-
Fair Value Gap (FVG) —
a three-candle imbalance where price moved with insufficient overlap, leaving an inefficiency that may be revisited.
-
Inverted FVG (iFVG) —
an FVG that has been traded through and now acts as resistance/support in the opposite direction.
-
Breaker Block (BB) —
a failed order block that has been broken and retested, often signalling a structural pivot.
-
Balanced Price Range (BPR) —
overlap of bullish and bearish FVGs, treated as a high-probability reactive area.
-
Liquidity Sweep —
price taking out a prior swing high/low (equal highs/lows or pivot extremes) before reversing.
-
Sweep Reclaim —
a confirmed sweep where price closes back inside the original range with follow-through, distinguishing a successful raid from a continuation.
-
Premium / Discount Zones —
the upper and lower halves of the active swing range; OTE values sit within these.
-
Optimal Trade Entry (OTE) —
the 62–79% premium retracement (short-bias) and the 21–38% discount retracement (long-bias) of the active swing.
-
Kill Zones —
the Asian, London, NY AM, and NY PM session windows where institutional volume is concentrated.
-
VWAP —
Volume Weighted Average Price, anchored to Daily, Weekly, Session, or Monday, with previous-anchor reference.
-
Impulse Classification —
categorisation of directional moves by displacement strength, absorption, and volume context.
---
█ Limitations, Transparency & Development
Built-in tooltip system.
Every cell, column header, and dashboard section in IID Dual carries a contextual tooltip. Hover over any data point, a verdict state, a confluence factor, a structure label, a modifier, a row title, and the indicator explains what you're looking at, how it was calculated, and what it means in the current market context.
The dashboard is designed to teach as you use it, so newcomers to ICT and SMC concepts can build fluency without leaving the chart, and experienced traders can verify the exact methodology behind any reading. The Intelligence Briefing is the primary interpretive layer; the tooltip system is the reference layer beneath it.
Non-prescriptive by design.
This indicator describes market conditions. It does not issue buy or sell instructions, place orders, or claim a strategy edge. Alerts report state changes — not trade calls.
Methodology honesty.
The confluence engine treats its factors with equal weighting; the Intelligence Briefing's OBSERVED column is intentionally conservative and may show fallback narration when structural evidence is sparse. The Reversal engine requires hard gates before it will score, which by design produces fewer signals than the Continuation engine.
Not financial advice.
Trading involves risk. This indicator is an analytical tool. All decisions are the trader's.
Active development.
IID Dual is actively maintained. Feature updates, additional alert conditions, methodology refinements, and bug fixes are delivered through code updates — see release notes below the description for the latest changes. 지표

지표

지표