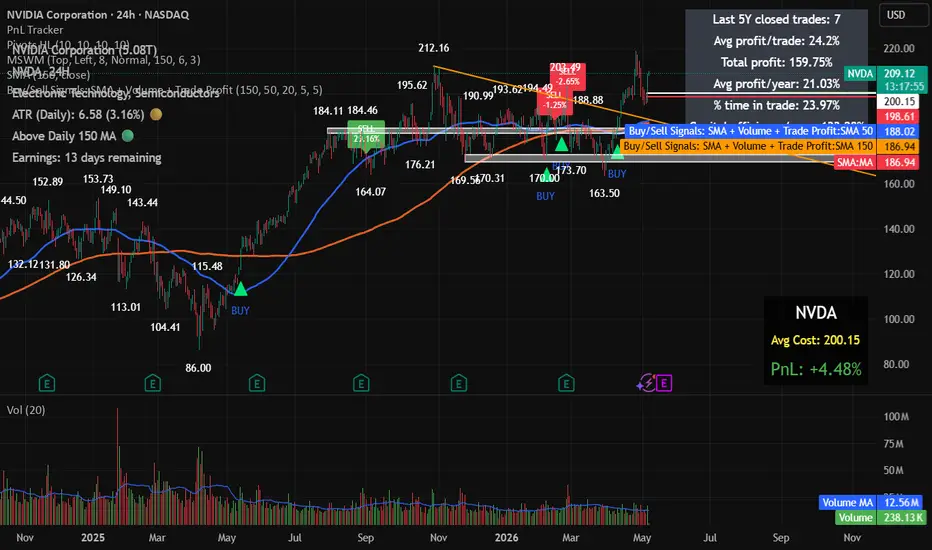
Buy/Sell Signals: SMA + Volume + Trade ProfitThis indicator generates buy and sell signals using SMA 150, SMA 50, candle color, and volume conditions.
A buy signal appears when a green candle closes above the SMA 150, remains within the selected maximum percentage above it, closes above the SMA 50, and has above-average volume.
A sell signal appears on the first candle that closes below the SMA 50 after a buy signal.
The indicator tracks each completed trade and displays the profit/loss percentage on the sell candle. It also includes a summary table showing trade count, average profit, total compounded profit, average yearly profit, time spent in trades, and yearly capital-efficiency adjusted for exposure time.
The checked time period is configurable in years. 지표

Session Killzones & Breakouts [BigBeluga]🔵 OVERVIEW
Session Killzones & Volume Flow Profile is a professional-grade market structure tool that merges time-based "Killzone" analysis with intraday volume distribution. This advanced version covers the full global trading cycle— Asia, London, and New York —and now includes a Performance Statistics Dashboard to track historical breakout success.
By visualizing the "Point of Control" (POC) and volume distribution, it helps traders understand institutional interest zones, while the new dashboard provides a quantitative edge by showing how often each session successfully hits its expansion targets.
🔵 CONCEPT
Three-Session Cycle — Automatically encapsulates the Asia, London, and New York sessions in dynamic, color-coded zones.
Real-Time Point of Control (POC) — Continuously calculates and plots the most traded price level during the session development, highlighting the current high-interest node as it forms.
Post-Session Volume Profile — Once a session ends, a high-resolution, stepped polyline profile is generated to visualize the final "Value Area."
Breakout Expansion — Projects three mathematical price targets (Deviations) once price escapes a session's range.
Performance Dashboard — A real-time table tracking the total number of bullish/bearish breakouts and successful target hits for every session.
🔵 HOW IT WORKS (IN-DEPTH)
1️⃣ Real-Time POC & Session Development
As each session develops, the indicator tracks every price tick and volume bar from the very first minute.
Live POC Tracking: While the session is active, the indicator plots a Real-Time POC box and extension line that shifts dynamically as new volume flows in. This identifies the "fairest price" exactly when it is being negotiated.
This allows traders to see the session's internal center of gravity before the final profile is even drawn.
2️⃣ Post-Session Volume Flow Profile
Immediately after a session concludes, the indicator finalizes the data and draws a high-resolution Polyline Profile.
Longer horizontal steps in the polyline represent "High Volume Nodes" where institutional accumulation or distribution was most intense.
The final POC is locked in, providing a permanent historical anchor for future support and resistance.
3️⃣ Breakout & Target Logic
Once a session ends, its High and Low act as structural boundaries.
A confirmed close outside these boundaries triggers a Breakout Signal (Triangle) and a dashed "Tether Line" connecting the move back to its source.
Three expansion targets (Dev 1, 2, and 3) are projected. These lines are "hit-aware," meaning they stop extending exactly when price reaches the target, providing a clean visual record of the move's completion.
4️⃣ The Performance Dashboard
The indicator maintains a global tally of all session events.
Break ▲ / ▼: Tracks how many times a session has broken out in either direction.
Hit |, ||, |||: Tracks how many times those breakouts successfully reached the first, second, and third deviation targets.
This allows traders to quickly see which session is currently providing the most reliable follow-through on the current asset.
🔵 KEY FEATURES
Global Session Coverage: Dedicated settings for Asia (Pink), London (Cyan), and New York (Orange).
Real-Time POC Visualization: A live-updating POC box and extension line that identifies high-interest levels as the session unfolds.
Finalized Volume Profile: A sleek, stepped polyline generated at session end for post-session structural analysis.
Statistics Dashboard: A customizable table (position and visibility) showing breakout and target hit counts.
"Hit-Aware" Targets: Target lines (marked |, ||, |||) stop automatically upon price contact to reduce chart clutter.
High-Resolution Polylines: Optimized volume visualization that provides granular detail without sacrificing chart performance.
🔵 HOW TO USE
Monitor the Live POC: During the session, watch where the POC box is located. Price often orbits this level as the "mean," and a strong move away from it often precedes a full session breakout.
Analyze the Final Profile: Once the session ends, use the Polyline Profile to identify the "Value Area." If price returns to the session range later, these high-volume nodes often act as strong support or resistance.
Consult the Dashboard: Use the performance table to identify which session has the highest win rate for breakouts on your specific timeframe.
Target Scaling: Use Deviation 1 (|) for high-probability scalps, Deviation 2 (||) for standard trend targets, and Deviation 3 (|||) for major institutional expansion points.
🔵 CONCLUSION
Session Killzones & Volume Flow Profile is a complete institutional roadmap. By combining the "When" (Sessions) with the "Where" (Live POC & Final Profile) and the "How Much" (Dashboard Stats), it provides a data-driven framework for navigating the most profitable hours of the trading day. 지표

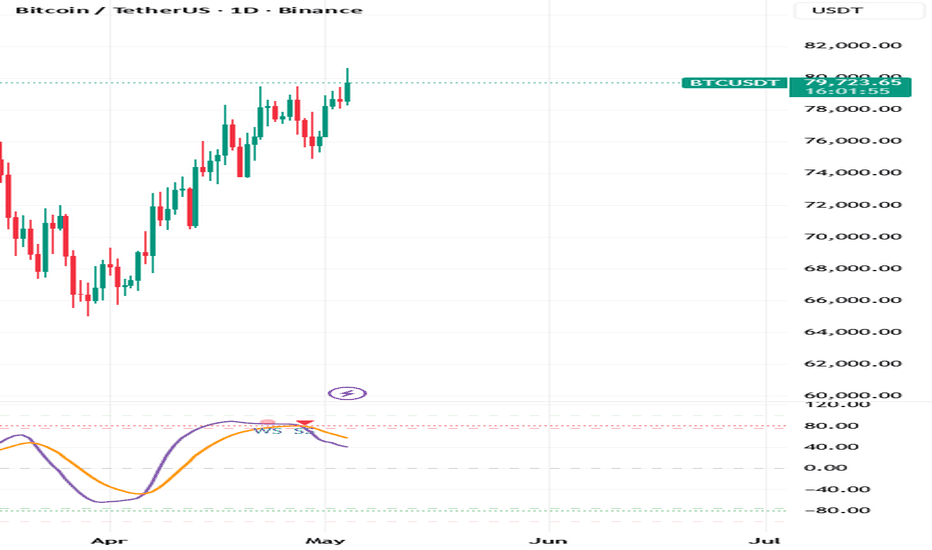
Trend V2 Exact + Soft Filters**Trend V2 Exact + Soft Filters**
Trend V2 Exact + Soft Filters is a precision-based momentum and confirmation indicator designed to identify high-probability market turning points with clarity and structure. Built around a smoothed correlation trend engine, it delivers both early warnings and confirmed signals while maintaining strict control over signal quality.
At its core, the indicator plots two key lines:
* **Purple Line** – a smoothed representation of trend momentum
* **Yellow Line** – a signal line used for confirmation and timing
These lines operate within a structured zone system, allowing the script to detect when price action reaches statistically significant extremes before triggering any signals.
---
### 🔍 How It Works
The logic follows a two-stage process:
**1. Setup (Weak Signals)**
A potential trade is identified when:
* The Yellow line enters a defined extreme zone (overbought or oversold)
* The Purple line reaches a deeper threshold (“touch level”)
This creates a *“ready state”*, displayed as **Weak Buy (WB)** or **Weak Sell (WS)** signals. These are early warnings — not confirmations.
**2. Confirmation (Strong Signals)**
A trade is only confirmed when:
* The Purple line crosses the Yellow line *after* the setup is armed
* Optional filters (if enabled) agree with the direction
This produces **Strong Buy (SB)** or **Strong Sell (SS)** signals — the primary entries.
---
### ⚙️ Smart Signal Control
To improve reliability without over-filtering, the script includes optional **Soft Filters**:
* **Turn Filter** – ensures momentum is actually shifting direction
* **Volume Filter** – checks whether volume supports the move
* **Liquidity Filter** – evaluates participation using volume-based proxies
Each filter can be enabled or disabled depending on your trading style, allowing full control between responsiveness and confirmation strength.
---
🔁 Anti-Repaint & Signal Flow
The indicator uses a strict event-state system:
* Signals are only triggered once per cycle
* Buy and sell signals alternate (no stacking)
* Setups must fully complete before confirmation
This ensures clean, non-redundant signals and avoids noise in ranging conditions.
---
📊 Visual Structure
* Clear upper and lower bands highlight extreme conditions
* Strength and touch levels are plotted for transparency
* Signals are minimal, clean, and easy to read on any timeframe
---
✅ Best Use
Trend V2 is ideal for:
* Intraday and swing trading
* Identifying reversals and continuation entries
* Traders who want **early context (weak signals)** + **confirmed execution (strong signals)**
---
⚠️ Notes
This is a confirmation tool, not a standalone strategy. It performs best when combined with market structure, support/resistance, or higher timeframe bias.
---
Designed for traders who value precision, structure, and control over raw signal frequency.
지표
지표

Volume Trap Reversal Planner [AGPro Series]Volume Trap Reversal Planner
🧠 Core Idea
Did a volume spike trap one side of the market and reverse with enough confirmation to deserve attention?
📌 Overview / What it does
Volume Trap Reversal Planner is a chart-first reversal planning tool built around high-volume trap behavior.
Instead of treating every volume spike or wick sweep as a reversal signal, the script checks whether price expands through a recent reference, prints unusual relative volume, fails to hold the move, recovers back through the reference, and then confirms with a follow-through candle.
The output includes volume trap pockets, reclaim rails, risk edges, target-room bands, compact event labels, alerts, and a clean AGPro decision panel. It does not predict price, automate trades, or claim that every trap will reverse.
🎯 Purpose & Design Philosophy
The script was built for traders who want to separate meaningful high-volume trap events from ordinary noisy spikes.
Many reversal tools focus only on a wick, a candle pattern, or a support/resistance touch. This planner focuses on the decision layer after a volume trap forms: whether the trap is confirmed, where the risk edge sits, where target-room review begins, and what the next action state should be.
The design supports a structured review mindset: identify the trap, wait for confirmation, monitor the risk edge, and read the context through a 0-100 score instead of reacting to a single candle.
⚡ Why This Script Is Different
Most tools focus on volume spikes as standalone events or classify every sweep as a reversal attempt.
This script does NOT operate as a generic stop-run scanner, a broad liquidity sweep map, or a simple volume climax labeler.
Instead, it combines relative volume, wick sweep behavior, close recovery, confirmation candle quality, follow-through, risk edge placement, and target-room context into one planner-style reversal model.
⚙️ Methodology
1. Context Detection
The script builds a rolling high/low reference range and watches for unusual volume expansion near those references.
2. Trap Mapping
When price sweeps beyond the reference with elevated volume and recovers back inside, the script maps the volume trap pocket.
3. Reversal Evaluation
The planner evaluates wick quality, recovery strength, confirmation candle structure, follow-through distance, and the active risk edge.
4. Visual Output
The result is translated into a 0-100 reversal score, a next-action state, on-chart labels, risk/target guides, and a compact AGPro panel.
🗺️ How to Read the Chart
Zones = volume trap pockets created by a high-volume sweep and recovery.
Labels = trap watch, reversal ready, trap failed, or target review states.
Colors = bull-side reversals use teal, bear-side reversals use pink, watch states use amber, and review/target context uses indigo.
Panel = current trap side, volume spike multiple, reversal score, risk edge, and next action.
🚦 Signals & States
• VOL TRAP WATCH → a high-volume trap candidate formed and needs confirmation.
• REVERSAL READY → the trap received confirmation and reached the required score.
• TRAP FAILED → price closed beyond the risk edge and the active trap context weakened.
• TARGET REVIEW → price reached the target-room review band for the active plan.
🔔 Alerts Logic
Alerts trigger when a volume trap watch appears, when reversal confirmation reaches the required score, when the active trap fails through the risk edge, or when price reaches the target-room review band.
Alerts are attention markers only. They are not trade instructions.
🧩 Confluence Logic
The context becomes stronger when volume spike quality, wick sweep behavior, close recovery, confirmation candle structure, and follow-through align in the same direction.
The score is intentionally multi-factor so a single dramatic candle does not dominate the interpretation.
📊 When to Use
• 4H charts for the cleanest public visual balance
• Markets with reliable volume data
• High-volume reactions around recent highs or lows
• Reversal review after failed breakout or failed breakdown attempts
• Active intraday or swing charts where trap behavior is visible
⚠️ When NOT to Use
• Very low-liquidity symbols
• Markets with unreliable or missing volume data
• Extremely noisy ranges where every candle sweeps both sides
• News-driven volatility where candle structure can distort normal context
🎛️ Key Inputs
• Trap Reference Lookback → controls the rolling high/low range used for trap detection.
• Volume Spike RVOL → adjusts how much relative volume is required.
• Sensitivity → changes sweep, wick, and volume selectivity.
• Confirmation Mode → controls how strict the confirmation candle must be.
• Risk / Target Logic → controls risk edge buffers and target-room bands.
• Visual Settings → control zones, rails, labels, panel location, theme, and font sizes.
🖥️ Interface & Visual Design
The interface is built around a clean AGPro panel and chart-first visual hierarchy.
Trap pockets show where the volume trap occurred. Labels identify the current state without overcrowding the chart. Risk and target guides make the output easier to interpret as a planning tool rather than a raw signal board.
🧪 Practical Usage Workflow
1. Read the panel and check the active trap side.
2. Inspect the volume trap pocket and reclaim rail.
3. Wait for reversal confirmation instead of reacting to the spike alone.
4. Compare the current state with the risk edge and target-room band.
5. Interpret the score within broader market context.
🔍 Interpretation Guidelines
A high score means the trap structure, volume spike, recovery, and confirmation are aligned more cleanly.
A watch state means the event is still developing.
A failed state means the active trap context has weakened or invalidated according to the script's rules.
Use the output as structured context, not as a standalone decision.
🚫 What This Script Is NOT
• Not a prediction engine
• Not financial advice
• Not an auto-trading system
• Not a guaranteed reversal signal
• Not a generic liquidity sweep scanner
⚠️ Limitations & Transparency
Volume quality varies by symbol, exchange, and asset class.
Different timeframes may produce different trap pockets and confirmation states.
High volatility can make traps appear and fail quickly.
The script is rule-based and cannot know news, order flow intent, execution quality, or broader discretionary context.
🧠 Market Context Notes
Volume traps often matter most when they occur at obvious participation points, such as recent highs, recent lows, failed breakouts, or failed breakdowns.
The strongest use case is not the spike itself. The strongest use case is the sequence after the spike: recovery, confirmation, risk edge, and follow-through.
🧾 Use Case Examples
When price sweeps below a recent low on elevated volume, closes back above the reference, and confirms upward within the allowed window, the planner can mark a bullish reversal context.
When price sweeps above a recent high on elevated volume, fails to hold, and confirms downward, the planner can mark a bearish reversal context.
🧱 System Philosophy
Volume Trap Reversal Planner belongs to the AGPro planner-style workflow: detect the event, score the evidence, define the risk edge, map the review zone, and guide the next chart-reading step.
🔐 Non-Promise Statement
No trap, score, label, or alert can guarantee a reversal.
No script can provide certainty.
📉 Risk Disclosure
Trading involves risk.
Users are responsible for their own decisions, risk management, and market interpretation.
This script is for educational and analytical purposes only and does not provide financial advice.
📚 Educational Note
Use the script to study how high-volume failed moves behave after sweeping recent references. The most useful insights come from comparing confirmed traps, failed traps, and ignored spikes across different markets and timeframes.
지표

지표

FlowScale PVT FlowScale: Normalized Volume-Price Dynamics
The FlowScale PVT is a professional-grade momentum oscillator designed to bridge the gap between cumulative volume flow and trend precision. Built on the foundational Price Volume Trend (PVT) formula, this indicator applies a sophisticated 89-period Normalization Engine and HMA (Hull Moving Average) Smoothing to transform raw volume data into a clean, bounded oscillator (-100 to +100).
The standout feature of FlowScale is its "13% Balance Buffer," a mathematically defined neutral zone that filters out market noise and prevents premature entry signals during low-volume consolidation.
🚀 Key Features
* Adaptive Normalization: Unlike standard PVT, which grows indefinitely, FlowScale anchors the data within a -100 to +100 scale using an 89-bar lookback. This allows traders to identify historical exhaustion points and trend strength with absolute clarity.
* The 13% Neutral Buffer (Gray Zone): To eliminate "whipsaws" (false signals), the indicator features a ±13 neutral corridor. The trend color remains Neutral Gray until the momentum gathers enough mass to break out into Bullish Green or Bearish Red.
* HMA-Enhanced Smoothing: Utilizing a 13-period Hull Moving Average, the oscillator provides a "lag-less" smooth curve, reacting quickly to price shifts while filtering out the erratic spikes common in raw volume indicators.
* Dynamic Flow Fill: A visual "mountain-fill" logic anchors the signal line to the Zero Balance point, making it easy to visualize the total mass of volume-price momentum at a glance.
🧠 Mathematical Logic
FlowScale calculates the relative position of the cumulative PVT within its recent high-low range. By applying a Normalization process:
Formula: 200 * (PVT - Lowest PVT) / (Highest PVT - Lowest PVT) - 100
It ensures that the volume-price relationship is always relative to the current market regime. The addition of the 13% Hysteresis (Buffer) ensures that the trend color only shifts when the move is mathematically significant.
🛠️ How to Use
1. The Trend Trigger: Watch for the line to exit the Gray Zone. A break above +13 confirms bullish momentum; a break below -13 confirms bearish dominance.
2. Momentum Masses: The "Fill" area represents the pressure. Sustained Green fill above the Zero Line indicates strong accumulation, while Red fill indicates distribution.
3. The Exhaustion Zones (±80): When the FlowScale line enters the Overbought (+80) or Oversold (-80) levels, look for potential reversals or trend decelerations as volume flow hits a statistical extreme.
4. Divergence Analysis: Look for price making new highs while FlowScale makes lower highs. This "Volume-Price Divergence" is a powerful leading indicator of an upcoming trend shift.
⚙️ Settings
* Normalization Period (89): Defines the window for scaling. A higher value leads to more macro analysis; a lower value makes it more reactive.
* Smoothing Intensity (13): Controls the HMA period. Set to 13 for the optimal balance between speed and noise-reduction.
* Balance Buffer (13%): Sets the width of the neutral zone. Increase this in volatile markets to avoid false signals.
📌 Credits & Origins
This work is based on the Price Volume Trend (PVT) methodology, enhanced with modern statistical normalization and smoothing techniques. It is dedicated to traders who demand a clean, data-driven view of market liquidity and momentum.
Disclaimer: All indicators are probabilistic. FlowScale PVT is a decision-support tool and does not guarantee profits. Always use stop-losses and follow your risk management plan. 지표

VWAP DELTA🇬🇧 ENGLISH
VWAP DELTA is a Volume Weighted Average Price that uses delta volume magnitude as its weighting factor instead of total volume. Unlike a standard VWAP — where every bar contributes proportionally to its raw volume — VWAP DELTA gives more weight to bars where buyers or sellers clearly dominated, and less weight to bars where volume was balanced between both sides. The result is a price level that better reflects where the market agreed during high-conviction moves.
HOW IT WORKS:
Delta volume is estimated from each candle's shape by splitting volume between buyers and sellers using the high-low range. Bars that close near the high have high buy delta; bars that close near the low have high sell delta. The VWAP is then computed weighting each price by the absolute value of its delta, so only directional pressure counts.
COMPONENTS:
1. Delta Volume — Estimated as: Buy Vol = Volume × (Close − Low) / (High − Low), Sell Vol = Volume × (High − Close) / (High − Low). Delta = Buy Vol − Sell Vol.
2. VWAP Delta — Formula: Sum(HLC3 × |Delta|) / Sum(|Delta|), anchored and reset at each new period (Session, Week, Month, Quarter or Year).
3. Standard Deviation Bands — Delta-weighted variance bands above and below the VWAP Delta, showing price extension during high-conviction moves. Useful as dynamic support and resistance zones.
4. Dynamic Color — The line turns teal when cumulative session delta is positive (buyers dominating the strong moves) and red when negative (sellers dominating). At a glance you know which side has been more active in the meaningful bars of the session.
USE CASES:
• Confirm the direction of "active money" — price above VWAP Delta means high-conviction moves were bullish.
• Filter false signals — balanced-volume candles barely move the indicator, reducing noise.
• Spot divergences — price rising but VWAP Delta lagging or falling signals a rally with weak buying conviction.
• Intraday bias — color tells you who dominated the strong bars of the session without reading order flow tools.
━━━━━━━━━━━━━━━━━━━━━━━━━━━━━━━━━━━━━━
🇪🇸 ESPAÑOL
VWAP DELTA es un Precio Medio Ponderado por Volumen que usa la magnitud del volumen delta como factor de ponderación en lugar del volumen total. A diferencia del VWAP estándar — donde cada vela contribuye de forma proporcional a su volumen bruto — VWAP DELTA otorga más peso a las velas donde compradores o vendedores dominaron claramente, y menos peso a las velas donde el volumen estuvo equilibrado entre ambos lados. El resultado es un nivel de precio que refleja mejor dónde acordó el mercado durante los movimientos de alta convicción.
CÓMO FUNCIONA:
El volumen delta se estima a partir de la forma de cada vela dividiendo el volumen entre compradores y vendedores usando el rango high-low. Las velas que cierran cerca del máximo tienen alto delta comprador; las que cierran cerca del mínimo tienen alto delta vendedor. El VWAP se calcula ponderando cada precio por el valor absoluto de su delta, de modo que sólo cuenta la presión direccional.
COMPONENTES:
1. Volumen Delta — Estimado como: Vol Comprador = Volumen × (Close − Low) / (High − Low), Vol Vendedor = Volumen × (High − Close) / (High − Low). Delta = Vol Comprador − Vol Vendedor.
2. VWAP Delta — Fórmula: Sum(HLC3 × |Delta|) / Sum(|Delta|), anclado y reiniciado en cada nuevo período (Sesión, Semana, Mes, Trimestre o Año).
3. Bandas de Desviación Estándar — Bandas de varianza ponderada por delta por encima y por debajo del VWAP Delta, que muestran la extensión del precio durante movimientos de alta convicción. Útiles como zonas dinámicas de soporte y resistencia.
4. Color Dinámico — La línea se muestra en verde azulado cuando el delta neto de la sesión es positivo (compradores dominando los movimientos fuertes) y en rojo cuando es negativo (vendedores dominando). De un vistazo sabes qué lado ha sido más activo en las velas importantes de la sesión.
CASOS DE USO:
• Confirmar la dirección del "dinero activo" — precio por encima del VWAP Delta significa que los movimientos de alta convicción fueron alcistas.
• Filtrar señales falsas — las velas de volumen equilibrado apenas mueven el indicador, reduciendo el ruido.
• Detectar divergencias — precio subiendo pero VWAP Delta plano o bajando señala un rally sin convicción compradora real.
• Sesgo intradiario — el color indica quién dominó las velas importantes de la sesión sin necesidad de herramientas de order flow. 지표

Volume Rejection Planner [AGPro Series]Volume Rejection Planner
🧠 Core Idea
Did unusual volume appear at rejection in a way that changes the current decision context?
📌 Overview / What it does
Volume Rejection Planner is a chart-first volume reaction tool built to evaluate wick-led rejection events that appear with elevated relative volume near a recent range edge.
The script maps a volume rejection zone, a risk edge, a follow-through trigger, a room guide, compact state labels, and a clean AGPro planning panel. It converts relative volume, wick quality, close location, range-edge context, follow-through progress, and time decay into a 0-100 rejection quality score.
It does not predict price, automate trades, or mark every volume spike as meaningful. Its purpose is to organize the decision window after volume appears at a rejection wick.
🎯 Purpose & Design Philosophy
This script was built for traders who want more context than a raw volume spike or a simple wick marker.
High volume at a wick can mean participation, absorption, rejection, or noise depending on where it appears and what follows next. The planner focuses on that next question: is the rejection being accepted by follow-through, or is the event failing at its risk edge?
The design supports a decision-engine mindset: identify the rejection, measure its quality, locate invalidation, monitor follow-through, and decide whether the context deserves review, patience, or dismissal.
⚡ Why This Script Is Different
Most tools focus on volume spikes, climax candles, or generic wick rejection labels.
This script does NOT clone a Volume Climax Detector, does not become a Rejection Block tool, and does not draw generic support/resistance zones.
Instead, it treats high-volume wick rejection as a short lifecycle: event, test, accepted follow-through, failed risk edge, expired window, or room-guide reach. The main output is not a raw signal; it is a structured planning state.
⚙️ Methodology
1. Context Detection
The script builds a recent range-edge reference and checks whether the rejection wick occurs near the upper or lower edge.
2. Reference Mapping
When a qualified event appears, it maps the rejection zone, risk edge, follow-through trigger, and room guide.
3. Reaction Evaluation
The model scores relative volume, wick ratio, wick size, close location, edge quality, room, follow-through progress, pressure against the event, and time decay.
4. Visual Output
The result is shown through centered zone text, compact event labels, risk/room guides, candle tint, alerts, and a premium AGPro decision panel.
🗺️ How to Read the Chart
Volume Rejection Zone = the wick-led rejection area created by elevated participation at a range edge.
Risk Edge = the invalidation boundary beyond the rejection wick.
Follow-Through Trigger = the distance price must move away from the rejection to show accepted context.
Room Guide = a forward planning reference used to judge whether the reaction has enough space to matter.
Labels = compact BULL VRP / BEAR VRP markers for primary volume rejection events. Optional secondary labels can show monitor, accepted follow-through, expiry, and room-guide reach when the user wants a more detailed chart.
Colors = teal highlights bullish rejection context, pink highlights bearish rejection context, amber highlights watch context, indigo highlights room/guide context, and red highlights invalidation.
Panel = summarizes Rejection Volume, Wick Quality, Follow-Through, Risk Edge, and Action.
The panel focuses on fresh active context only. Older historical zones can remain on the chart without forcing the panel to display stale invalidated events.
🚦 Signals & States
• Volume Rejection Event → elevated relative volume appears with a qualifying wick near a range edge.
• Testing → the event exists, but accepted follow-through is not confirmed yet.
• Monitor → the active score is high enough to keep the context under review.
• Accepted → price has moved away from the rejection wick enough to confirm follow-through context.
• Risk Edge Broken → the event has moved through its invalidation boundary.
• Window Expired → the event did not confirm within the selected follow-through window.
• Room Guide Reached → the accepted context reached its planning guide.
🔔 Alerts Logic
Alerts trigger when a qualified volume rejection event appears, when the active context reaches READY, when the state changes, when the risk edge is broken, or when the room guide is reached.
Alerts are attention markers only. They are not trade instructions, entry commands, exit commands, or automated strategy rules.
🧩 Confluence Logic
The strongest context appears when high relative volume, a clear wick ratio, a strong close back away from the wick, range-edge location, enough room, and quick follow-through align.
If price fails to move away from the rejection wick, presses back into the risk edge, or loses too much time, the planner downgrades the context.
📊 When to Use
• Range-edge reactions
• Wick rejection events with unusually high participation
• Failed pushes into recent highs or lows
• Markets where volume data is readable
• Situations where the next decision depends on whether rejection follows through
⚠️ When NOT to Use
• Very low-liquidity symbols with unreliable volume
• Extremely noisy micro-timeframes
• News spikes where wick behavior may distort quickly
• Markets where volume reporting is fragmented or unavailable
• Situations where the user expects a direct buy/sell signal
🎛️ Key Inputs
• Sensitivity → controls how strict the volume, wick, and edge requirements are.
• Range Edge Lookback → defines the recent high/low context used for rejection location.
• Minimum Rejection Score → controls which events are important enough to draw.
• Confirmation Mode → adjusts how quickly follow-through can be accepted.
• Follow-Through Window → controls how long the event remains active.
• Risk Edge Buffer → adjusts the invalidation boundary beyond the wick.
• Room Guide ATR → controls the planning guide distance.
• Visual settings → control zones, rails, primary labels, secondary labels, failure labels, candle tint, label density, and text size.
• Limit Historical Drawing / Historical Drawing Bars → controls how far back the script creates visual objects, improving load speed on long histories while preserving the current planning view.
• Adaptive HTF Events → slightly relaxes event thresholds on daily and weekly charts so higher timeframes do not look empty while intraday behavior stays stricter.
🖥️ Interface & Visual Design
The interface is designed to stay chart-first.
The rejection zone provides the visual anchor. The risk edge and room guide frame the planning context. Labels stay compact and offset away from candles so the chart remains active without becoming crowded.
The AGPro panel uses a merged blue title row and a compact five-row decision layout.
🧪 Practical Usage Workflow
1. Read the panel action state.
2. Check whether the rejection zone is bullish or bearish.
3. Review the wick quality and relative volume.
4. Compare current price against the follow-through trigger and risk edge.
5. Treat alerts as attention markers, then evaluate broader market context.
🔍 Interpretation Guidelines
Think in terms of event lifecycle, not prediction.
A stronger score means the rejection had better participation, wick structure, location, room, and follow-through behavior. A weaker or decaying score means the event is losing quality under the current rule set.
Accepted follow-through does not mean price must continue. It means the rejection event has met the script's conditions for stronger review context.
🚫 What This Script Is NOT
• Not a prediction engine
• Not financial advice
• Not auto trading
• Not guaranteed signals
• Not a generic volume spike marker
• Not a Rejection Block clone
• Not a Volume Climax Detector clone
⚠️ Limitations & Transparency
The script is rule-based and depends on recent price, volatility, wick structure, and volume behavior.
Different timeframes can change how rejection and follow-through appear. Volatility spikes can temporarily distort wick size and edge quality. Symbols with weak or unreliable volume may produce less useful readings.
Outputs should always be interpreted within broader structure, liquidity, volatility, and risk context.
🧠 Market Context Notes
Volume rejection is most useful when the wick appears at a meaningful location and the follow-up reaction is clear.
High volume alone is not enough. Location, close behavior, risk edge, and follow-through all matter.
🧾 Use Case Examples
When price pushes above a recent range edge, prints a strong upper wick with elevated RVOL, and then moves away from that wick, the planner may classify the context as accepted bearish rejection.
When price probes below a recent range edge, prints a strong lower wick with elevated RVOL, but then closes below the risk edge, the planner may classify the event as invalidated.
🧱 System Philosophy
AGPro planning tools are designed to help traders evaluate context before reacting.
This script follows that approach by turning high-volume wick rejection into a structured decision question: is the event valid, strong, risky, accepted, or fading?
🔐 Non-Promise Statement
No indicator can provide certainty.
This tool provides structured visual context and rule-based attention markers. It does not guarantee continuation, reversal, rejection, or follow-through.
📉 Risk Disclosure
Trading involves risk. Market conditions can change quickly, and no script can remove uncertainty.
Users are responsible for their own analysis, risk management, and decisions.
This script is for educational and analytical use only and does not provide financial advice.
📚 Educational Note
Use the planner to study how volume behaves at wick rejection points, how quickly follow-through appears after rejection, and how risk edges help separate valid context from failed reaction events.
지표

Volume Follow-Through Planner [AGPro Series]Volume Follow-Through Planner
🧠 Core Idea
Did high volume create real continuation, or was it only a one-bar event?
📌 Overview / What it does
Volume Follow-Through Planner is a decision-oriented volume analytics overlay built to evaluate what happens after a qualified high-volume candle appears.
Instead of only marking volume spikes, the script opens a follow-through review window, measures next-bar progress, spread quality, close location, trend-side alignment, risk-rail defense, target-room progress, and converts the result into a 0-100 follow-through score.
It produces volume event labels, a forward follow-through box, a centered box label, a risk rail, a target-room guide, continuation/failure state labels, optional target-review labels, alert conditions, and a compact AGPro planning panel. It does not predict future price, automate execution, or claim that a high-volume event must continue.
🎯 Purpose & Design Philosophy
This script was built for traders who want volume to answer a practical planning question: did the event actually create usable continuation context?
Many volume tools stop at detection. They show that volume was high, but they do not explain whether later candles accepted, extended, failed, or faded after the event.
Volume Follow-Through Planner fills that gap by treating volume as the start of a review process, not the final answer. The goal is a cleaner decision layer: event quality, follow-through quality, risk edge, bias context, and next action.
⚡ Why This Script Is Different
Most volume tools focus on identifying spikes, climaxes, absorption, or simple participation changes.
This script does NOT try to clone Volume Climax Detector, Volume Absorption Zones, Breakout Volume Quality, or a generic breakout scanner.
Instead, it focuses on post-event behavior. The volume event must be strong enough to matter, but the main question is what happens next: continuation, weak follow-through, risk building, target review, or failure.
⚙️ Methodology
1. Context Detection
The script measures local relative volume against a rolling volume baseline, normalizes candle spread by ATR, checks body quality, close location, and trend-side alignment.
2. Reference Mapping
When a qualified event appears, the script anchors a follow-through box from the event close toward a target-room guide and places a risk rail beyond the event candle.
3. Reaction Evaluation
During the review window, the planner measures next-bar progress, favorable movement, adverse movement, follow-through closes, rail defense, and time efficiency.
4. Visual Output
The result is converted into a 0-100 follow-through score, chart labels, centered box text, guide lines, panel rows, and alert conditions.
🗺️ How to Read the Chart
Zones = the follow-through box projected from the event close toward the target-room guide.
Labels = volume event, follow-through ready, one-bar event, target review, or failed event states.
Colors = teal for constructive bullish context, pink for constructive bearish context, yellow for caution, and indigo for target/strong review states.
Panel = compact decision summary showing Volume Event, Follow-Through, Spread Quality, Bias, and Action.
Risk rail = the invalidation reference behind the event candle. A confirmed close beyond it marks the active event as failed.
🚦 Signals & States
• Volume Event → a qualified high-volume candle opened a follow-through review.
• FT WATCH → the event is active but still needs more progress.
• FT READY → follow-through quality reached the planner threshold.
• RISK BUILDING → adverse movement is rising while the event is still active.
• ONE-BAR EVENT → volume appeared, but follow-through did not develop enough inside the review window.
• FAILED → price closed beyond the risk rail.
• TARGET REVIEW → the event reached the target-room guide and should be reviewed in context.
🔔 Alerts Logic
Alerts trigger when a qualified volume event appears, when follow-through reaches the ready threshold, when the risk rail is broken, when the target-room guide is reached, and when an event becomes a one-bar event.
Alerts are attention markers. They are not trade instructions, entry rules, or automated execution logic.
🧩 Confluence Logic
The strongest context appears when relative volume, spread quality, close location, next-bar progress, follow-through closes, and trend-side bias align.
When the event has strong participation but weak progress, the planner reduces the follow-through score instead of treating volume alone as enough.
📊 When to Use
• After noticeable participation expansion
• During directional continuation attempts
• Around strong candle events that need confirmation from later bars
• On liquid instruments with reliable volume data
• When the main question is whether volume created continuation or only temporary attention
⚠️ When NOT to Use
• Very low-liquidity symbols
• Charts with unreliable or missing volume data
• Extremely noisy micro timeframes
• Markets where one candle can distort volume baselines
• Conditions where the user needs a full volume profile, absorption zone, or climax detector instead
🎛️ Key Inputs
• Sensitivity → controls how demanding the volume event gate is.
• Volume Lookback → defines the baseline used for relative volume.
• Minimum Planner Score → sets the FT READY threshold.
• Follow-Through Window → controls how many bars are used for early review.
• Risk Rail Buffer → adjusts the invalidation reference behind the event candle.
• Target Guide ATR → controls the projected target-room guide.
• Cooldown Bars → limits repeated events around the same move.
• Visual settings → control labels, optional target-review labels, boxes, guide lines, panel location, panel theme, and font sizes.
🖥️ Interface & Visual Design
The panel is designed as a compact planning cockpit rather than a data dump.
The first row uses the AGPro blue merged header style, while the rows below focus only on the decision fields needed for fast interpretation.
The chart visuals are intentionally moderate: enough labels to make the chart feel active, but controlled by cooldown, maximum visible objects, and spacing settings.
🧪 Practical Usage Workflow
1. Read the panel and check whether a volume event is active.
2. Inspect the follow-through box and risk rail.
3. Watch whether price progresses beyond the event close or fades back toward the rail.
4. Use the Follow-Through score and Action row as context for further review.
5. Confirm the broader market structure, volatility, and liquidity environment separately.
🔍 Interpretation Guidelines
Think of the first volume event as a question, not an answer.
Strong follow-through means the event received continuation support. Weak follow-through means volume did not yet translate into useful directional progress. A failed event means the risk rail was broken and the original event context should be rejected.
The score is a planning aid. It should be interpreted with market structure, higher-timeframe context, and risk controls.
🚫 What This Script Is NOT
• Not a prediction engine
• Not financial advice
• Not auto trading
• Not guaranteed signals
• Not a volume climax detector
• Not an absorption zone map
• Not a generic support/resistance tool
⚠️ Limitations & Transparency
Volume quality depends on the chart symbol and exchange feed.
Timeframe changes can materially alter event frequency, volume baselines, and follow-through behavior.
Extreme volatility can make the risk rail or target-room guide less stable.
The script is rule-based and cannot understand news, liquidation cascades, macro events, or hidden order flow.
🧠 Market Context Notes
High volume is most useful when later candles confirm that participation had directional effect.
If price cannot progress after the event, the volume may represent temporary effort, late participation, absorption-like behavior, or simple noise.
This script focuses on that after-event evaluation.
🧾 Use Case Examples
When a strong bullish volume event appears and later candles close above the event close, the follow-through score can improve toward FT READY.
When a bearish volume event appears but price immediately reclaims the event area and breaks the rail, the state can shift to FAILED.
When volume expands but price stays trapped near the event close, the state can become ONE-BAR EVENT.
🧱 System Philosophy
The AGPro planner style is built around decision quality.
A chart tool should not only show what happened. It should help the user evaluate validity, strength, risk, target room, and the next state to monitor.
🔐 Non-Promise Statement
No script can provide certainty.
No signal, state, score, label, or alert guarantees a future outcome.
📉 Risk Disclosure
Trading involves risk.
Users are responsible for their own analysis, execution, risk management, and decisions.
This script is for educational and analytical purposes only and does not provide financial advice.
📚 Educational Note
Use the planner to study how volume events behave after they appear. The most important information is often not the event itself, but whether later candles confirm, weaken, or invalidate it.
지표

Luxy BOSS MODE - Support & ResistanceBOSS MODE S/R is a comprehensive Support & Resistance system that detects, scores, and learns from every zone reaction — then automatically generates trade plans with entry, stop, target, and position size.
Unlike traditional S/R indicators that simply draw lines, BOSS MODE combines 6 detection engines , an adaptive scoring algorithm , a real-time momentum classifier powered by the Luxy Energy Index, and a Trade Plan Generator that calculates exact risk parameters based on your account.
── WHAT MAKES IT DIFFERENT ──
1. Adaptive Weight Scoring
Every zone is scored 0-100 based on 7 factors: volume at touch, higher-timeframe origin, confluence with other zones, freshness, touch count, regime alignment, and historical performance. After 20+ observed zone outcomes (first bounce or first break per zone), the system adjusts its scoring weights based on which factors correlated with bounces vs breaks on that specific chart and asset.
2. LEI-Powered Momentum Classifier
Uses the Luxy Energy Index (Extension + Velocity + Volume exhaustion model) to classify each approaching zone as likely BOUNCE or BREAK . LEI ≥ 70 = exhausted move arriving at zone = bounce expected. LEI ≤ 30 = energized move = break risk.
3. Trade Plan Generator
For qualifying setups (Grade A/B zone, regime-aligned, R:R above your minimum), the indicator auto-calculates:
Entry — just beyond zone boundary
Stop Loss — opposite side of zone + ATR buffer
Target — nearest zone in trade direction
Position Size — based on your account size and risk %
R:R ratio — only shows when above your minimum
4. Per-Zone Intelligence
Every zone tracks its own history: how many times it bounced vs broke, average bounce distance in ATR units, and hold rate. Labels show this inline: ⬆ SUPPORT 📐 82 5/7 +0.4ᴬ = score 82, held 5 of 7 tests, avg distance from zone mid at touch: 0.4 ATR.
── 6 DETECTION ENGINES ──
📐 Swing Pivots — Classical swing highs/lows on current, Daily, and Weekly timeframes
🧱 Order Blocks — Last candle before a strong impulsive move, confirmed by volume
📊 Volume POC — Highest-volume price cluster over lookback period
💨 Fair Value Gaps — 3-candle imbalances where price left unfilled ranges
💧 Liquidity Pools — Equal high/low clusters where stops accumulate
⚓ Anchored VWAP — Auto-anchors on gap+volume events (earnings, catalysts)
All 6 sources feed into the same unified zone object, allowing true confluence scoring across methodologies.
── REGIME-AWARE SCORING ──
The market regime (STRONG_BULL / WEAK_BULL / RANGE / WEAK_BEAR / STRONG_BEAR / SQUEEZE) drives the scoring bias. In a bullish regime, support zones receive a significant score bonus while resistance zones score lower — reflecting the statistical reality that zones aligned with the trend hold more reliably.
Regime is calculated from ADX + Bollinger Band Width + EMA slope, giving 5 states plus a Squeeze override when volatility compresses to the bottom 10% of the last 100 bars.
── VISUAL SYSTEM ──
Zones are rendered with a 4-layer heat-map system:
Atmospheric halo — fades beyond zone boundaries, scales with score
Main fill — neon color: cyan family for support, red/orange for resistance, intensity proportional to score
Hot core strip — brighter inner band at zone midpoint
Entry line — solid bright stripe at the price-contact edge (top for support, bottom for resistance)
Grade-A pulse ring — glowing outline when a high-conviction zone is within 1.5 ATR of price
Score bar — vertical progress bar to the right of each zone, height = score 0-100
Simple View : A separate layer draws just two clear boxes — nearest SUPPORT (green) and nearest RESISTANCE (red) — with text centered inside. Designed for traders who want instant visual clarity without analyzing all zones.
── TRADE PLAN GENERATOR ──
Configure in the 💰 Trade Plan settings group:
Account Size ($) — your total trading capital
Risk per Trade (%) — standard is 1.0% per trade
Min R:R to Show — only displays setups where the calculated reward exceeds this multiple of risk
When a qualifying setup is found, three dashed lines appear on the chart (blue = entry, red = stop, green = target) with a summary label showing direction, prices, share count, and R:R ratio. The Dashboard shows it in the 💰 Active Setup row. An alert fires with the full trade plan.
Important: The Trade Plan Generator identifies setups based on zone proximity and regime alignment. All trade decisions remain entirely the responsibility of the user. Past zone reactions do not guarantee future performance. Always apply your own analysis and risk management.
── DASHBOARD (14 rows) ──
The information panel shows in real-time:
Market Regime with color coding
Asset Class / Session (PRE/RTH/AH for stocks)
Active zones breakdown (0A/1B/3C format)
Nearest Resistance price, grade, ATR distance
Nearest Support price, grade, ATR distance
ATR% Rank (volatility context)
Active Warning (8 types, color-coded by severity)
Anchored VWAP value and anchor reason
Squeeze detector
Zone Hit Rate (historical bounce %)
Active Detection Sources
Scenario suggestion
Adaptive Weights status
Active Trade Plan (Entry / Stop / Target / Shares / R:R)
Every cell has a detailed tooltip explaining what the value means and how to use it.
── MULTI-ASSET SUPPORT ──
The asset engine auto-detects chart type and adjusts accordingly:
Stocks — ATR-based zones, session-aware (PRE/RTH/AH)
Stocks under $1 — percent-based zone widths (ATR is unreliable for extreme low-price securities)
Crypto — 24/7, percent bands, no session breaks
Forex — pip-based zone widths
Indices — volume-agnostic fallback
Futures — rollover-aware
── SETTINGS OVERVIEW ──
🎯 Trading Mode — Scalp / Intraday / Swing (affects zone widths and sensitivity)
🧭 Regime Classifier — ADX, BB, and EMA periods
🎯 Zone Detection — Toggle each of the 6 engines independently
📐 Swing Pivots — Left/right lookback bars and zone width
🧱 Order Blocks — Lookback period, minimum move %, volume threshold
📊 Volume POC — Lookback bars and histogram bins
💨 Fair Value Gaps — Minimum gap size %
💧 Liquidity Pools — Lookback and touch tolerance %
⚓ Anchored VWAP — Auto-anchor thresholds and manual catalyst date
⚖️ Scoring — Individual weight controls for all 7 scoring factors
🌍 Asset-Class Adaptation — Override or force Sub-$5 mode
🚨 Warnings — Toggle each of 8 warning types with ATR distance control
🎨 Visual Settings — Top-N zones, adaptive hide, transparency, Simple View toggle
📊 Dashboard — Position, size, show/hide
💰 Trade Plan — Account size, risk %, minimum R:R
🔔 Alerts — Standard or structured JSON for webhook automation
── ALERTS ──
8 alert types:
Any Warning (catch-all)
Sweep Imminent
Regime Shift near Grade-A zone
Trap Suspected (low-volume false breakout)
Zone Approach
Squeeze Detected
Trade Plan — LONG Setup
Trade Plan — SHORT Setup
Enable Structured JSON Alerts to receive webhook-ready payloads with full zone data, regime, warning type, and trade plan details.
── EXTERNAL LIBRARY ──
This script imports Luxy Energy Index (LEI) by OrenLuxy for the momentum classifier. LEI measures move exhaustion using Extension from VWAP, Velocity (5-bar rate of change), and Volume as a modifier.
── IMPORTANT NOTES ──
This indicator is for educational and analytical purposes only . It does not constitute financial advice.
Past zone performance (hit rate, average bounce) does not guarantee future results.
The Trade Plan Generator calculates position sizes mathematically based on user inputs — always verify sizing with your broker before placing orders.
Adaptive weights require 20+ observed bounce/break events to activate. On new charts, base weights are used.
The LEI library requires separate import — the indicator will prompt if not accessible.
── CREDITS ──
Luxy Energy Index (LEI) — OrenLuxy. Exhaustion methodology drawing on academic research by Campbell-Grossman-Wang (1993) on volume-return relationships, ATR normalization by J. Welles Wilder Jr., and standard VWAP methodology.
S/R concepts inspired by VSA (Volume Spread Analysis), SMC (Smart Money Concepts), and classical pivot point theory.
Past performance does not predict future results. This tool is for informational purposes only and does not constitute investment advice. Trading involves substantial risk of loss.
지표

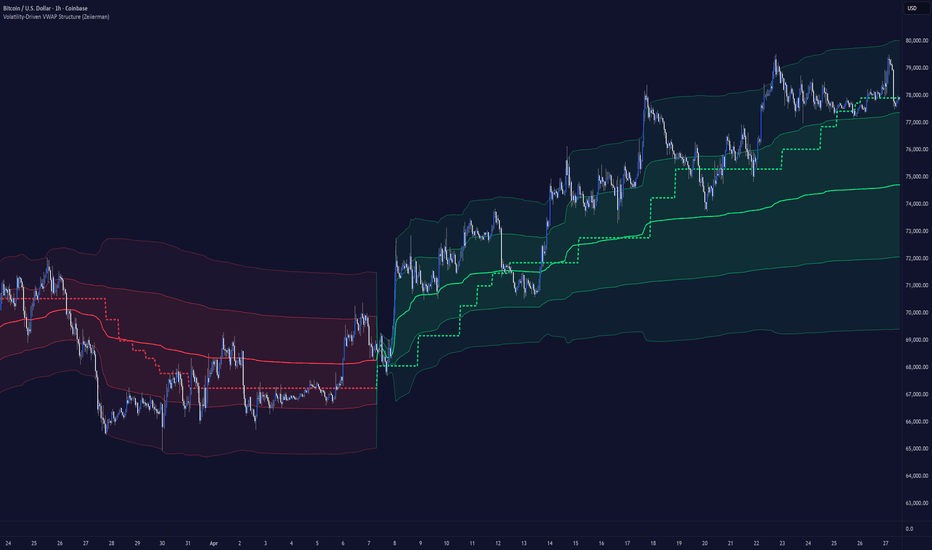
Volatility-Driven VWAP Structure (Zeiierman)█ Overview
Volatility-Driven VWAP Structure (Zeiierman) is a VWAP-based market structure tool that adapts its regime logic using volatility, Z-score normalization, and reversal-anchored VWAP profiles.
The script builds a rolling VWAP structure and adjusts its transition distance using an adaptive volatility engine. The result is a dynamic structure line that shifts only when VWAP displacement is strong enough relative to current volatility conditions.
When a structure reversal occurs, the script resets an anchored VWAP profile from that point and builds deviation bands around it, allowing traders to track the active post-reversal value area.
█ How It Works
⚪ Rolling VWAP Base
The script first calculates a rolling VWAP using price multiplied by volume over the selected lookback period.
float rollingVwap = math.sum(src * volume, vwapLengthInput) / math.sum(volume, vwapLengthInput)
This creates a volume-weighted fair value line that updates continuously without relying on fixed session, daily, weekly, or monthly anchors.
⚪ Adaptive Volatility Engine
The structure step is not fixed. It is based on ATR, a slow ATR comparison, and a Z-score volatility reading.
float atrZ = atrDev != 0 ? (atrFast - atrMean) / atrDev : 0.0
float volRatio = atrSlow != 0 ? atrFast / atrSlow : 1.0
This allows the script to identify whether volatility is currently expanding or contracting compared to its recent behavior.
⚪ Sigmoid Volatility Mapping
The volatility ratio and Z-score are blended into a sigmoid function.
float sigmoidInput = 4.0 * (volRatio - 1.0) + 0.75 * atrZClamped
float sigmoid = 1.0 / (1.0 + math.exp(-sigmoidInput))
The sigmoid smooths extreme volatility changes, converting them into a controlled, adaptive multiplier.
This helps prevent the structure from becoming too sensitive during noise while still expanding during stronger volatility regimes.
⚪ VWAP Structure Engine
The rolling VWAP is compared against adaptive upper and lower structure levels.
When VWAP expands far enough beyond the current structure range, the script shifts the structure higher or lower.
float upsideExpansion = rollingVwap - (structureUpper + structureStep)
float downsideExpansion = (structureLower - structureStep) - rollingVwap
If the expansion is strong enough, a new structure direction is assigned:
int nextDirection = expandsHigher ? 1 : expandsLower ? -1 : direction
This creates bullish and bearish VWAP structure regimes based on volume-weighted displacement, not just candle closes.
⚪ Structure Mean
The main plotted line is the midpoint of the active VWAP structure range.
float structureMid = (structureUpper + structureLower) / 2.0
This line acts as the active structure mean:
When the regime is bullish, it uses the bullish color.
When the regime is bearish, it uses the bearish color.
⚪ Reversal-Anchored VWAP Profile
Every time the VWAP structure reverses, a new anchored VWAP profile begins.
bool anchorReset = isReversed or na(anchorSumPV)
From that reversal point, the script accumulates:
price × volume
volume
price² × volume
These values are used to calculate the active anchored VWAP and its weighted deviation.
float anchoredVwap = anchorSumV != 0 ? anchorSumPV / anchorSumV : na
float anchoredDev = not na(anchoredVar) ? math.sqrt(math.max(anchoredVar, 0)) : na
This creates a fresh value profile after every structural shift.
⚪ Anchored Deviation Bands
The script plots one or two deviation bands around the reversal-anchored VWAP.
float anchorUpper1 = anchoredVwap + anchoredDev * bandMult1
float anchorLower1 = anchoredVwap - anchoredDev * bandMult1
These bands help visualize the active post-reversal value area and potential stretched-price zones.
█ How to Use
⚪ Read the Structure Mean
Bullish color → VWAP structure is in an upward regime
Bearish color → VWAP structure is in a downward regime
The structure mean can be used as a dynamic guide for trend bias, continuation, regime changes, and identifying good areas to look for retests on the mean.
⚪ Watch for Structure Reversals
A reversal occurs when the adaptive VWAP structure changes direction.
These reversals reset the anchored VWAP profile, marking the start of a new active value phase.
⚪ Use the Anchored VWAP
After a reversal, the anchored VWAP shows the volume-weighted average price from that new structure point.
Price above anchored VWAP → stronger bullish control
Price below anchored VWAP → stronger bearish control
⚪ Use the Deviation Bands
The deviation bands show how far the price has moved from the active anchored VWAP.
Band 1 → normal value expansion
Band 2 → stronger price extension
Touches of the outer bands can be used to identify extended conditions, reaction zones, or continuation pressure.
█ Settings
Rolling VWAP Length: Controls the lookback period for the rolling VWAP calculation.
Structure Multiplier: Controls how wide the adaptive structure transitions are.
Volatility Length: Controls the ATR length used in the volatility engine.
Band 1 Multiplier: Controls the first anchored VWAP deviation band.
Band 2 Multiplier: Controls the second anchored VWAP deviation band.
-----------------
Disclaimer
The content provided in my scripts, indicators, ideas, algorithms, and systems is for educational and informational purposes only. It does not constitute financial advice, investment recommendations, or a solicitation to buy or sell any financial instruments. I will not accept liability for any loss or damage, including without limitation any loss of profit, which may arise directly or indirectly from the use of or reliance on such information.
All investments involve risk, and the past performance of a security, industry, sector, market, financial product, trading strategy, backtest, or individual's trading does not guarantee future results or returns. Investors are fully responsible for any investment decisions they make. Such decisions should be based solely on an evaluation of their financial circumstances, investment objectives, risk tolerance, and liquidity needs.
지표
Candle Expansion Readiness [AGPro Series]Candle Expansion Readiness
🧠 Core Idea
Is the current candle expansion meaningful enough to monitor, or is it only a noisy wide candle?
📌 Overview / What it does
Candle Expansion Readiness is a chart-first candle quality planner built to evaluate whether an active expansion candle has enough structure to deserve attention.
Instead of treating every wide candle as important, the script studies body efficiency, wick control, relative volume, ATR-normalized expansion, recent range behavior, and close location. These components are converted into a 0-100 Expansion Readiness Score with a clear state: READY, WATCH, FADE RISK, or WAIT.
The script produces expansion candle labels, a forward follow-through box, risk edge, target guide, failure/fade states, alerts, and a clean AGPro planning panel. It does not predict future price movement, automate decisions, or guarantee that an expansion candle will continue.
🎯 Purpose & Design Philosophy
This script was built for traders who want a cleaner way to judge expansion candles before reacting to them.
The gap it fills is practical: many candle tools mark a candle after it appears, but they do not explain whether that candle is efficient, supported, close-positioned, and monitorable. Candle Expansion Readiness turns that moment into a structured planning question.
The design supports a decision-first workflow: read the candle quality, check whether follow-through is developing, identify the risk edge, and decide whether the context deserves more attention.
⚡ Why This Script Is Different
Most tools focus on large candles, volume spikes, engulfing patterns, institutional candle labels, or general breakout signals.
This script does NOT clone Institutional Candle Detector, does not classify candles into institutional taxonomies, does not build an absorption system, and does not act as a generic breakout-volume tool.
Instead, it evaluates the current expansion candle as a readiness event. The output is not a trade command. It is a planning state that helps users separate monitorable expansion from weak, noisy, or fading candle behavior.
⚙️ Methodology
1. Context Detection
The script reads the active candle side from candle direction and close behavior, or lets the user force bullish or bearish readiness mode.
2. Reference Mapping
It maps the expansion candle, risk edge, follow-through window, and target guide.
3. Reaction Evaluation
The model scores body efficiency, wick control, relative volume, ATR expansion, recent range expansion, and directional close location.
4. Visual Output
The result appears through compact labels, candle glow, a forward follow-through box, risk edge, target guide, deterministic alerts, and the AGPro planning panel.
🗺️ How to Read the Chart
Zones = the follow-through box shows the monitored area from the expansion risk edge toward the target guide. Its label is centered inside the box.
Labels = compact markers show READY, WATCH, DOWNGRADE, CONFIRMED, INVALID, or FADED context.
Colors = green highlights stronger bullish readiness or confirmation, pink highlights bearish or invalidated context, amber highlights caution, and indigo highlights watch behavior.
Panel = the panel summarizes Candle Efficiency, Volume Support, Expansion Score, Follow-Through, and Action.
🚦 Signals & States
• READY → candle expansion quality is strong enough to monitor.
• WATCH → candle quality is improving but confirmation is incomplete.
• FADE RISK → the candle expanded, but wick or close behavior is weak.
• CONFIRMED → follow-through reached the active target guide.
• INVALIDATED → price crossed the active risk edge.
• FADED → the follow-through window expired without confirmation.
• WAIT → no strong enough expansion context is active.
🔔 Alerts Logic
Alerts trigger when the planner enters READY state, downgrades from READY or WATCH, crosses the active risk edge, confirms at the target guide, or fades after the follow-through window.
These alerts are attention markers only. They are not trade instructions, entry signals, or automated strategy commands.
🧩 Confluence Logic
The readiness state becomes stronger when body efficiency, close location, relative volume, ATR expansion, and wick control align on the same candle.
When those elements align and the follow-through box remains active without risk-edge violation, the candle context becomes cleaner. When the score is high but follow-through fails, the planner intentionally downgrades the context instead of ignoring the failure.
📊 When to Use
• Active intraday or swing charts where candle expansion matters.
• Breakout attempts where candle quality needs review.
• Continuation moves that require follow-through monitoring.
• Reversal attempts where the trader wants to know whether the impulse candle is efficient or noisy.
• Liquid symbols with reliable OHLC and volume data.
⚠️ When NOT to Use
• Very low-liquidity markets with unreliable candles.
• Extremely noisy sessions where wide candles fail repeatedly.
• Symbols with poor or missing volume data if volume support is central to your workflow.
• News-driven spikes where normal candle-quality rules may lose relevance.
• As a standalone entry system without broader market context.
🎛️ Key Inputs
• Sensitivity → controls how strict the readiness model is.
• Expansion Lookback → compares the current candle to recent range behavior.
• READY Threshold → minimum 0-100 score required for READY state.
• Confirmation Mode → controls whether close quality alone is enough or whether volume/edge confirmation is required.
• Follow-Through Bars → defines how long the script monitors the active expansion.
• Risk Edge Buffer ATR → moves the invalidation reference slightly beyond the candle edge.
• Visual settings → control boxes, risk edge, target guide, candle glow, labels, panel theme, and font sizes.
🖥️ Interface & Visual Design
The interface is designed to stay chart-first.
The panel gives the current decision state without becoming a crowded dashboard. The follow-through box creates a clean visual planning area, while compact labels keep the chart active without burying price candles.
The first panel row follows the AGPro merged blue header standard and shows only the script name.
🧪 Practical Usage Workflow
1. Read the Expansion Score and Action row.
2. Check whether the candle is READY, WATCH, or FADE RISK.
3. If READY appears, inspect the follow-through box and risk edge.
4. Watch whether price confirms, fades, or invalidates.
5. Interpret the result within your broader structure, liquidity, and risk plan.
🔍 Interpretation Guidelines
Think of the script as a candle expansion planner, not a signal caller.
A READY candle deserves attention because its structure is cleaner than average. A WATCH candle needs more evidence. A FADE RISK candle warns that expansion exists, but the candle quality is not clean. INVALIDATED and FADED states are part of the workflow because failed expansion is useful information.
🚫 What This Script Is NOT
• Not a prediction engine.
• Not financial advice.
• Not auto trading.
• Not guaranteed signals.
• Not an institutional candle detector.
• Not an order block, fair value gap, or support/resistance map.
⚠️ Limitations & Transparency
• Timeframe differences can change how expansion candles appear.
• Volatility spikes can temporarily distort candle-quality readings.
• Volume data may differ by exchange, broker, symbol, and feed.
• Follow-through is evaluated through a fixed monitoring window.
• Market conditions can shift after a READY candle appears.
🧠 Market Context Notes
Candle expansion is most useful when interpreted with liquidity, structure, volatility, and location.
The script focuses on the candle itself and the immediate follow-through plan. Traders should still consider broader trend context, nearby levels, session behavior, and event risk.
🧾 Use Case Examples
When a bullish candle closes near its high with strong body efficiency and relative volume, the script may mark READY and project a follow-through box above the risk edge.
When a wide candle has heavy wick behavior and poor close location, the script may flag FADE RISK instead of treating the candle as clean expansion.
When a READY candle fails back through its risk edge, the active plan becomes INVALIDATED.
🧱 System Philosophy
AGPro tools are designed to support structured chart reading. The goal is to convert market behavior into clean, rule-based context that helps traders think more clearly.
Candle Expansion Readiness follows that philosophy by turning a single expansion candle into a monitored planning state.
🔐 Non-Promise Statement
No script can provide certainty.
This tool organizes candle expansion context, but it does not guarantee continuation, reversal, profit, or any specific market outcome.
📉 Risk Disclosure
Trading involves risk.
Users are responsible for their own analysis, execution, position sizing, and risk management.
Nothing in this script or description is financial advice.
📚 Educational Note
Use the script to study how clean expansion candles behave across different symbols and timeframes. The value is in comparing candle quality, follow-through, and failure behavior over time.
지표

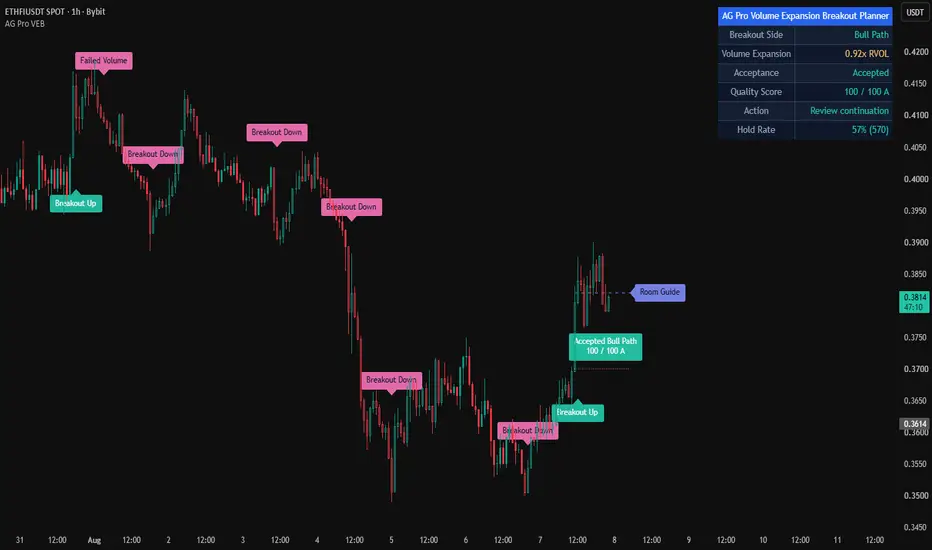
Volume Expansion Breakout Planner [AGPro Series]Volume Expansion Breakout Planner
🧠 Core Idea
After a breakout, is volume expanding in a constructive path, or is the move losing participation and acceptance?
📌 Overview / What it does
Volume Expansion Breakout Planner is a chart-first breakout planning tool built around post-breakout participation quality.
Instead of judging only the breakout candle, the script maps the broken reference level, draws an acceptance band, monitors relative volume after the break, tracks whether price holds the path, and converts the full sequence into a 0-100 quality score.
The output includes compact breakout path labels, volume expansion labels, hold labels, failed-volume labels, an invalidation rail, a room or review guide, and a clean AGPro decision panel. It does not predict price, automate entries, or issue trade commands.
🎯 Purpose & Design Philosophy
This script was built to fill the gap between simple breakout markers and full trade-management tools.
Many breakouts look strong on the first candle but quickly lose participation. Others start quietly and become stronger as post-break volume expands. This tool is designed for traders who want to evaluate that path with structure, not emotion.
The mindset is planning-first: identify the breakout reference, evaluate volume expansion, check acceptance, respect invalidation, and decide whether the path deserves continued attention.
⚡ Why This Script Is Different
Most breakout tools focus on the first break beyond a level.
This script does NOT try to clone a standard breakout volume confirmation tool, a Darvas breakout system, a triangle breakout scanner, or a generic support/resistance map.
Instead, it focuses on the post-break volume expansion path: what happens after the level breaks, whether volume remains constructive, whether price accepts the broken area, and whether the path becomes suspicious or failed.
⚙️ Methodology
1. Context Detection
The script builds a prior price structure from a configurable lookback and identifies the upper and lower breakout references.
2. Reference Mapping
When price closes beyond the reference by an ATR-normalized buffer, the script starts a breakout path and draws the broken level, acceptance band, invalidation rail, and a room or review guide.
3. Reaction Evaluation
The model evaluates relative volume, candle efficiency, close location, breakout distance, trend alignment, range quality, post-break participation, progress, acceptance, and failure behavior.
4. Visual Output
The chart displays compact path labels, volume expansion labels, accepted-path labels, failed-volume labels, and a premium AGPro panel summarizing the current decision state.
🗺️ How to Read the Chart
Zones = the acceptance band around the broken level. Its text changes by state, such as BULL PATH REVIEW, ACCEPTED BULL PATH, or FAILED BEAR PATH.
Labels = compact path state markers such as UP, DN, VOL+, HOLD, FAIL, WATCH UP, and WATCH DN. Label scores can be enabled from settings if the user wants more detail.
Colors = teal for constructive bullish paths, pink for constructive bearish paths, yellow for watch or caution states, indigo for room or review guide emphasis, and muted gray for expired paths.
Panel = the current breakout side, volume expansion state, acceptance state, quality score, and next action.
🚦 Signals & States
• UP → a bullish breakout path has started.
• DN → a bearish breakout path has started.
• VOL+ → post-break volume is expanding with directional follow-through.
• HOLD → the path held beyond the acceptance band with constructive volume.
• FAIL → the path returned into weak-volume or invalidation conditions.
• WATCH UP / WATCH DN → optional approach labels when price is near a breakout reference while relative volume is building.
🔔 Alerts Logic
Alerts trigger when a high-quality bullish or bearish volume expansion path starts, when post-break volume expands, when the path becomes accepted, or when failed-volume conditions appear.
These alerts are attention markers for chart review. They are not trade instructions.
🧩 Confluence Logic
The strongest readings usually occur when the breakout closes cleanly beyond the reference, relative volume expands above baseline, candle structure is efficient, trend alignment supports the side, and price later accepts the broken area.
When these conditions align, the quality score improves and the next-action state becomes more constructive.
📊 When to Use
• Breakout continuation review
• Range exits where volume quality matters
• Post-break acceptance monitoring
• Breakouts that need a clear invalidation reference
• Multi-symbol review where traders need fast path-quality comparison
⚠️ When NOT to Use
• Low-liquidity symbols with unreliable volume
• Markets with irregular session volume or distorted feeds
• Extremely choppy periods where every break returns inside the prior structure
• Events driven by abnormal news volatility where technical volume baselines become less stable
🎛️ Key Inputs
• Breakout Lookback → controls the prior structure used for breakout references.
• Break Buffer ATR → defines how far price must close beyond the level.
• Volume Baseline Length → controls the relative volume baseline.
• Expansion RVOL Threshold → defines the required volume expansion for strong pulses.
• Minimum Planner Score → controls how selective the main path states are.
• Acceptance Band ATR → controls the decision zone around the broken level.
• Invalidation Rail ATR → controls the structural failure reference.
• Panel / Label Settings → control location, theme, font size, label scores, optional watch labels, and label density.
🖥️ Interface & Visual Design
The interface is built for fast chart reading.
The acceptance band is the main visual anchor. The breakout line, invalidation rail, and room or review guide create a compact planning map without filling the chart with generic zones. Labels are short, shifted slightly away from the candle, and capped by user settings.
The AGPro panel follows the publication standard with a single merged blue header row containing only the script name.
🧪 Practical Usage Workflow
1. Read the panel to see whether a breakout path is active.
2. Check the acceptance band and broken level.
3. Evaluate whether volume is expanding or fading.
4. Watch for ACCEPTED or FAILED VOL states.
5. Use the invalidation rail and room or review guide as planning references within broader market context.
🔍 Interpretation Guidelines
Read the score as a structured quality model, not as certainty.
A higher score means the path has cleaner participation, stronger candle structure, better close quality, better trend alignment, and stronger acceptance behavior according to the script's rules.
A lower score means the path is weaker, less accepted, or more vulnerable to failed-volume behavior.
🚫 What This Script Is NOT
• Not a prediction engine
• Not financial advice
• Not auto trading
• Not guaranteed signals
• Not a complete trading system
• Not a generic buy/sell indicator
⚠️ Limitations & Transparency
Volume quality depends on the reliability of the TradingView volume feed for the selected symbol.
Different timeframes can produce different breakout references and acceptance behavior.
High-volatility news periods, low-liquidity markets, and irregular session activity can reduce the usefulness of relative volume baselines.
The script is rule-based and should be interpreted alongside broader context.
🧠 Market Context Notes
Volume expansion is most useful when it is connected to structure.
The broken level matters because it gives the move a reference. The acceptance band matters because it shows whether the market is holding that reference. The invalidation rail matters because it defines when the path has lost structural quality.
🧾 Use Case Examples
When price breaks above a prior range with strong RVOL and later holds the acceptance band, the path may remain constructive.
When price breaks below a range but volume fades and price returns above the broken reference, the path may become suspicious or failed.
When price approaches a reference with building volume but no confirmed break, VOL WATCH keeps the trader aware without turning the tool into a signal board.
🧱 System Philosophy
The script is part of the AGPro planner-style workflow: show the reference, score the context, define invalidation, monitor acceptance, and guide the next review step.
🔐 Non-Promise Statement
No script can guarantee continuation, reversal, or outcome certainty.
This tool organizes breakout-volume context so users can evaluate the chart more clearly.
📉 Risk Disclosure
Trading involves risk.
Users are responsible for their own decisions, risk management, and market interpretation.
This script is provided for educational and analytical use only and does not provide financial advice.
📚 Educational Note
Use the script to study how post-breakout volume behaves after price leaves a prior structure. The most useful insights often come from comparing accepted paths against failed-volume paths over many examples.
지표

Impulse Follow-Through Quality [AGPro Series]Impulse Follow-Through Quality
🧠 Core Idea
Did the impulse receive enough follow-through to remain valid?
📌 Overview / What it does
Impulse Follow-Through Quality is a chart-first momentum expansion planner built to evaluate what happens after a strong impulse candle appears.
Instead of treating every strong candle as a standalone signal, the script starts a follow-through review window and measures whether price extends, pauses constructively, pulls back too deeply, reaches a target-room guide, or crosses a failure rail. These elements are converted into a 0-100 Impulse Quality score and a clear next-action state.
The script produces an impulse highlight, follow-through box, failure rail, measured target guide, compact labels, alerts, and a clean AGPro planning panel. It does not predict continuation, automate trades, or guarantee that momentum will continue.
🎯 Purpose & Design Philosophy
This script was built for traders who want to separate a meaningful impulse from a candle that only looks strong for one bar.
Many momentum tools focus on the impulse itself. The practical question often comes after that candle: does the move attract follow-through, or does it begin to fail? This planner fills that gap by turning the post-impulse phase into a readable decision process.
The design supports a patient review mindset: identify the impulse, watch the follow-through window, evaluate pullback depth, check target room, and review the failure rail before reacting.
⚡ Why This Script Is Different
Most tools focus on strong candles, volume spikes, momentum bursts, or basic continuation labels.
This script does NOT act as a Volume Climax Detector, does NOT rebuild an Institutional Candle Detector, and does NOT reduce the chart to a simple buy/sell momentum signal.
Instead, it evaluates what happens after the impulse. The key output is not the candle itself. The key output is the follow-through quality state: IMPULSE, WAIT FT, FT WATCH, VALID FT, PULLBACK RISK, WEAK FT, FAILED, or TARGET REVIEW.
⚙️ Methodology
1. Context Detection
The script detects qualified bullish or bearish impulse candles using ATR-normalized range, body efficiency, close location, trend context, and participation.
2. Reference Mapping
Once an impulse qualifies, the script maps the impulse origin, follow-through box, failure rail, and target-room guide.
3. Reaction Evaluation
The model evaluates follow-through progress, closes beyond the impulse close, retracement depth, participation support, target room, and whether price crosses the failure rail.
4. Visual Output
The result is displayed through an impulse highlight, centered follow-through box label, failure rail, target guide, compact labels, deterministic alerts, and a premium AGPro panel.
🗺️ How to Read the Chart
Impulse Highlight = the latest qualified impulse leg that starts the review window.
Follow-Through Box = the active planning area between the impulse close and the measured target-room guide. Its label is centered inside the box.
Failure Rail = the practical invalidation reference behind the impulse. It is an analytical line, not a stop order.
Target Guide = a measured target-room reference based on the impulse range.
Labels = compact state markers for impulse start, constructive follow-through, weak follow-through, pullback risk, failure rail review, and target review.
Colors = teal supports constructive long-side follow-through, pink supports short-side or failure context, amber marks review risk, and indigo marks watch states.
Panel = summarizes Impulse Quality, Follow-Through, Pullback Risk, Target Room, and Action.
🚦 Signals & States
• IMPULSE → a qualified impulse candle has started a review window.
• WAIT FT → the impulse exists, but follow-through is not confirmed yet.
• FT WATCH → follow-through conditions are improving but not strong enough for the highest state.
• VALID FT → follow-through quality is constructive according to the rule set.
• PULLBACK RISK → retracement depth is elevated inside the impulse range.
• WEAK FT → the follow-through window is aging without enough progress.
• FAILED → price crossed the failure rail behind the impulse.
• TARGET REVIEW → price reached the measured target-room guide and context should be reviewed.
🔔 Alerts Logic
Alerts can trigger when a new impulse starts, follow-through becomes constructive, follow-through enters watch state, the move weakens, pullback risk rises, price crosses the failure rail, or price reaches the target-room guide.
Each alert is an attention marker. Alerts are not trade instructions, entry commands, exit commands, or automated strategy rules.
🧩 Confluence Logic
The strongest context appears when a clean impulse candle is followed by measurable progress, multiple closes beyond the impulse close, controlled retracement depth, supportive participation, and readable target room.
When these components weaken, the planner can shift toward WAIT FT, FT WATCH, PULLBACK RISK, WEAK FT, or FAILED.
📊 When to Use
• After strong momentum candles where continuation quality matters.
• During trend continuation attempts that need follow-through review.
• After breakout or expansion bars where a one-bar move may be misleading.
• On liquid symbols where ATR, candle structure, and volume behavior are readable.
• When you want a post-impulse planning map instead of another raw momentum signal.
⚠️ When NOT to Use
• Very low-liquidity symbols with unstable candles or unreliable volume.
• Extremely noisy micro-timeframes where impulse candles appear too frequently.
• News-driven spikes where one-bar expansion can distort the model.
• Markets with large gaps that make ATR and failure-rail references less useful.
• Situations where the user expects guaranteed continuation or automated trade signals.
🎛️ Key Inputs
• Follow-Through Side → controls Auto, Long Follow-Through, or Short Follow-Through mode.
• Minimum Impulse ATR → changes how large a candle must be before review begins.
• Minimum Body Efficiency → controls how clean the impulse body must be.
• Minimum Edge Close → controls how near the candle must close to its directional edge.
• Follow-Through Window → controls how many bars are used to judge early continuation.
• Required Progress ATR → defines preferred movement after the impulse close.
• Maximum Pullback Ratio → controls when retracement depth becomes elevated risk.
• Failure Rail Buffer ATR → adjusts the analytical failure rail behind the impulse.
• Visual settings → control the impulse highlight, follow-through box, failure rail, target guide, labels, panel visibility, panel location, theme, and font sizes.
🖥️ Interface & Visual Design
The interface is designed to stay chart-first.
The impulse highlight gives the origin. The follow-through box gives the active planning area. The failure rail and target guide define the practical review frame.
The AGPro panel provides a compact decision summary with a merged blue title row, adjustable panel location, adjustable theme, and adjustable font size.
🧪 Practical Usage Workflow
1. Read the panel Impulse Quality score and Action.
2. Check the impulse highlight and the direction of the follow-through box.
3. Review whether price is extending beyond the impulse close.
4. Compare pullback depth with the failure rail.
5. Use the target guide as a context-review reference, not as a guarantee.
6. Treat alerts as attention markers inside broader analysis.
🔍 Interpretation Guidelines
Think in terms of follow-through quality, not prediction.
A higher score means the impulse has more constructive continuation characteristics according to the script's rule set. A weaker score means the move may be aging, retracing too deeply, lacking progress, or crossing its failure reference.
VALID FT does not mean price must continue. FAILED does not mean the market cannot recover later. The states organize the review process.
🚫 What This Script Is NOT
• Not a prediction engine.
• Not financial advice.
• Not an auto-trading system.
• Not a guaranteed signal tool.
• Not a buy/sell signal service.
• Not a Volume Climax Detector.
• Not an Institutional Candle Detector.
• Not a generic momentum oscillator.
⚠️ Limitations & Transparency
The script is rule-based and depends on recent price action, ATR, candle structure, selected inputs, and volume behavior.
Different timeframes can produce different impulse and follow-through readings. Volatility spikes can temporarily distort the score. Symbols with unreliable volume may produce weaker participation readings.
Outputs should always be interpreted with broader market structure, liquidity, and trader-defined risk controls.
🧠 Market Context Notes
Impulse candles are only useful when the market confirms or rejects them through follow-through.
A clean impulse that receives controlled extension may deserve more attention than a larger candle that immediately retraces. A smaller impulse can also become meaningful when the follow-through window stays organized.
🧾 Use Case Examples
When price prints a strong bullish impulse, closes near the high, then follows through with multiple closes above the impulse close while pullback depth remains controlled, the planner may classify the move as VALID FT.
When an impulse appears but price fails to extend, retraces deeply, or crosses the failure rail, the planner may shift toward WEAK FT, PULLBACK RISK, or FAILED.
🧱 System Philosophy
AGPro planning tools are designed to help traders evaluate context before reacting.
This script follows that philosophy by turning impulse follow-through into a structured planning question: did the move receive enough confirmation, progress, and risk clarity to remain worth reviewing?
🔐 Non-Promise Statement
No indicator can guarantee continuation, reversal, breakout success, or outcome.
This tool provides structured visual context and rule-based attention markers. It does not provide certainty.
📉 Risk Disclosure
Trading involves risk.
Market conditions can change quickly, and no script can remove uncertainty.
Users are responsible for their own analysis, risk management, position sizing, and trading decisions.
This script is for educational and analytical use only and does not provide financial advice.
📚 Educational Note
Use the planner to study how strong candles behave after they appear, how follow-through quality changes across timeframes, and how pullback depth affects the readability of momentum continuation.
지표

Volatility Expansion Planner [AGPro Series]Volatility Expansion Planner
🧠 Core Idea
Is volatility expanding with structure, or is the chart only producing random noise?
📌 Overview / What it does
Volatility Expansion Planner is a chart-first volatility expansion and breakout quality tool built to evaluate whether a release from compression has enough structure to deserve active attention.
Instead of showing another generic expansion signal, the script studies ATR expansion, prior range release, close efficiency, volume support, trend alignment, compression age, and the active risk shelf behind the move. These components are converted into a 0-100 Expansion Score and a clear next-action state.
The script produces an expansion corridor, ATR expansion band, prior range edge, risk shelf, compact quality labels, alerts, and a clean AGPro planning panel. It does not predict future price movement, automate decisions, or guarantee that an expansion will continue.
🎯 Purpose & Design Philosophy
This script was built for traders who want to separate structured volatility expansion from unstable noise.
Many volatility tools identify compression, release, or regime changes, but they often stop before answering the practical planning question: is the expansion clean enough to evaluate, and where is the risk reference if the release fails?
The design philosophy is simple: volatility expansion is only useful when it has structure, confirmation, and a readable risk shelf.
⚡ Why This Script Is Different
Most tools focus on squeeze dots, volatility regime labels, ATR readings, or basic breakout markers.
This script does NOT clone a Squeeze Momentum Indicator, does not rebuild an ATR Compression Map, and does not act as a generic breakout signal.
Instead, it evaluates whether expansion is structurally supported. The main output is not a trade command. It is a planning state that helps users distinguish STRUCTURED expansion from WATCH, RISK REVIEW, NOISE, or WAIT conditions.
⚙️ Methodology
1. Context Detection
The script reads the active expansion side using prior range release and trend context, or lets the user force long-side or short-side expansion planning.
2. Reference Mapping
It maps the prior range edge, current ATR expansion, compression age, risk shelf, and projected expansion corridor.
3. Reaction Evaluation
The model scores ATR expansion, range breakout, close efficiency, volume support, trend alignment, compression maturity, and risk shelf quality.
4. Visual Output
The result is displayed through an expansion corridor, ATR band, range edge, risk shelf, compact labels, deterministic alerts, and a premium AGPro panel.
🗺️ How to Read the Chart
Zones = the expansion corridor shows the projected release path from the prior range edge toward a measured target guide. Its label is centered inside the corridor.
Labels = compact state markers show STRUCTURED, WATCH, RISK REVIEW, NOISE, or SHELF CHECK context.
Colors = green highlights cleaner structured expansion, pink highlights unstable expansion risk, amber highlights review conditions, and indigo highlights watch conditions.
Panel = the panel summarizes Expansion Score, Squeeze Age, Confirmation, Risk Shelf, and Action.
🚦 Signals & States
• STRUCTURED → volatility is expanding with range release, confirmation, and a usable risk shelf.
• WATCH → expansion context is improving but confirmation is incomplete.
• RISK REVIEW → expansion is active but the risk shelf is too tight or too wide for clean planning.
• NOISE → volatility is hot or inefficient and may represent unstable movement.
• WAIT → the script does not detect a strong enough expansion context yet.
• SHELF CHECK → price crossed the prior risk shelf and the expansion context should be reviewed.
🔔 Alerts Logic
Alerts trigger when the planner enters STRUCTURED expansion, WATCH state, NOISE state, RISK REVIEW state, or when price crosses the prior risk shelf.
These alerts are attention markers only. They are not trade instructions, entry signals, or automated strategy commands.
🧩 Confluence Logic
The strongest context appears when ATR expands from a prior compressed structure, price closes beyond the prior range edge, candle efficiency is strong, volume support improves, trend alignment agrees with the expansion side, and the risk shelf remains readable.
When these components align, the Expansion Score improves and the state can move from WATCH to STRUCTURED.
📊 When to Use
• Before evaluating volatility expansion after a quiet range
• During breakout or continuation attempts where expansion quality matters
• When price releases from a prior structure but confirmation is uncertain
• When comparing whether an expansion has clean risk context or only noisy movement
• On liquid symbols where range, volume, and ATR behavior are readable
⚠️ When NOT to Use
• Very low-liquidity symbols with unstable candles
• Extremely noisy micro-timeframes
• News-driven spikes where ATR expands abruptly without structure
• Markets where volume is unreliable and price gaps distort the risk shelf
• Situations where the user expects a signal-only entry tool
🎛️ Key Inputs
• Expansion Side → controls Auto, Long Expansion, or Short Expansion mode.
• Prior Range Lookback → controls how the script maps the range edge before release.
• ATR Baseline → controls how current volatility is compared with normal volatility.
• Minimum Squeeze Age → defines how mature compression should be before stronger expansion scoring.
• Risk Shelf Lookback → controls the shelf used behind the expansion for planning context.
• STRUCTURED Threshold → sets the minimum score required for the strongest state.
• Label and Panel Font Size → controls chart labels, corridor text, and panel readability.
🖥️ Interface & Visual Design
The interface is designed to stay chart-first.
The expansion corridor gives the main visual story. The range edge and risk shelf define the practical planning frame. The ATR band adds volatility context without turning the script into a lower-pane oscillator.
The AGPro panel provides a compact decision summary with a merged blue title row and clear state hierarchy.
🧪 Practical Usage Workflow
1. Read the panel state and Expansion Score.
2. Check whether price is releasing from the prior range edge.
3. Review the risk shelf distance and confirmation state.
4. Compare the expansion corridor with broader structure.
5. Treat alerts as attention markers, then evaluate the broader market context.
🔍 Interpretation Guidelines
Think in terms of expansion quality, not prediction.
A stronger score means multiple structural conditions are aligned. A weaker score means expansion may be premature, poorly confirmed, too hot, or difficult to plan around.
RISK REVIEW is especially important because volatility can expand while the practical risk reference remains too tight, too wide, or unclear.
🚫 What This Script Is NOT
• Not a prediction engine
• Not financial advice
• Not an auto-trading system
• Not a guaranteed signal tool
• Not a Squeeze Momentum clone
• Not an ATR Compression Map clone
⚠️ Limitations & Transparency
The script is rule-based and depends on recent price, volatility, range, and volume behavior.
Timeframe differences can change how compression and expansion appear. Volatility spikes can temporarily distort the score. Symbols with unreliable volume may produce weaker participation readings.
Outputs should always be interpreted with broader market structure and liquidity context.
🧠 Market Context Notes
Volatility expansion is most useful when it appears after a readable compression phase and respects a clear structural shelf.
Expansion without shelf clarity can still move, but it is harder to plan around. Expansion with poor close efficiency or excessive ATR heat can be noisy even when price breaks a range edge.
🧾 Use Case Examples
When price closes beyond a prior range edge with rising ATR, improved volume support, efficient candle structure, and a defined risk shelf, the planner may classify the move as STRUCTURED.
When ATR expands sharply but candles close poorly and the shelf is too far away, the planner may classify the context as NOISE or RISK REVIEW.
🧱 System Philosophy
AGPro planning tools are designed to help traders evaluate context before reacting.
This script follows that philosophy by turning volatility expansion into a structured planning question: Is the release clean, confirmed, and readable enough to deserve attention?
🔐 Non-Promise Statement
No indicator can guarantee continuation, reversal, or follow-through.
This tool provides structured visual context and rule-based attention markers. It does not provide certainty.
📉 Risk Disclosure
Trading involves risk. Market conditions can change quickly, and no script can remove uncertainty.
Users are responsible for their own analysis, risk management, and decisions.
This script is for educational and analytical use only and does not provide financial advice.
📚 Educational Note
Use the planner to study how volatility behaves after compression, how expansion quality changes across timeframes, and how risk shelf clarity affects the readability of a move.
지표

Pre-Breakout Pressure Planner [AGPro Series]Pre-Breakout Pressure Planner
🧠 Core Idea
Is pressure building before a breakout, or is the setup still premature?
📌 Overview / What it does
Pre-Breakout Pressure Planner is a chart-first breakout readiness tool designed to evaluate pressure before price leaves a range.
The script maps an active pressure box, upper and lower trigger corridors, directional buildup side, volume support, fakeout-risk context, invalidation reference, and target-room projection. These factors are converted into a 0-100 Pressure Score with a clear next-action state such as Bull Pressure, Bear Pressure, Coil Watch, Premature, Fakeout Risk, or Trigger Review.
It does not predict breakouts, automate entries, or confirm post-breakout acceptance. It is built to help traders organize the pre-breakout decision process before reacting to price movement.
🎯 Purpose & Design Philosophy
This script was built for traders who want to evaluate whether a breakout setup is becoming valid before the breakout actually happens.
Many traders notice a range only after price has already moved. This tool focuses on the earlier planning phase: Is the range compressed? Is one side applying pressure? Is volume supportive? Is the candle behavior constructive? Is there fakeout risk near the boundary?
The design supports a planning mindset. It helps the user read pressure quality, risk location, target room, and next-action context without turning the chart into a generic signal board.
⚡ Why This Script Is Different
Most breakout tools focus on the moment price breaks a level.
This script does NOT focus on post-breakout confirmation, measured move corridors, generic support/resistance boxes, or simple buy/sell labels.
Instead, it evaluates the setup before the break. The core question is whether pressure is building in a structured way or whether the range is still too early, too wide, too weak, or vulnerable to a fakeout.
This keeps the concept separate from consolidation breakout tools. The purpose is not to grade a completed breakout. The purpose is to organize the pre-breakout readiness window.
⚙️ Methodology
1. Context Detection
The script builds a live pressure range from prior bars and evaluates whether price remains inside the active box, probes a boundary, or enters a trigger corridor.
2. Reference Mapping
It maps the pressure box, upper trigger corridor, lower trigger corridor, active-side invalidation reference, and projected target-room reference.
3. Reaction Evaluation
The model scores range compression, higher-lows or lower-highs buildup, relative volume behavior, candle pressure, and close location inside the box.
4. Visual Output
The script displays the active pressure box, centered status label, trigger corridors, optional risk/target guides, compact event labels, alerts, and a premium AGPro panel.
🗺️ How to Read the Chart
Pressure Box = the active range where pre-breakout pressure is being evaluated.
Trigger Corridors = narrow upper and lower zones where breakout review becomes relevant.
Risk / Target Guides = active-side invalidation and target-room references used for planning context.
Labels = compact state markers showing pressure, watch, fakeout risk, or trigger-review context.
Colors = teal supports bullish buildup, pink supports bearish buildup, amber marks neutral or developing pressure, and red marks elevated fakeout risk.
Panel = summarizes Pressure Score, Buildup Side, Volume Support, Fakeout Risk, Risk / Target, and Action.
🚦 Signals & States
• Bull Pressure → bullish buildup is forming inside the pressure box near the upper trigger context.
• Bear Pressure → bearish buildup is forming inside the pressure box near the lower trigger context.
• Coil Watch → compression or pressure exists, but the directional side is not clear enough yet.
• Premature → the setup does not yet meet the pressure score or structural requirements.
• Fakeout Risk → a boundary probe appears with weak support, poor candle pressure, or elevated rejection risk.
• Trigger Review → price has entered or crossed a trigger corridor and deserves context review.
🔔 Alerts Logic
Alerts can trigger when bullish pressure appears, bearish pressure appears, fakeout risk appears, or price enters trigger-review context.
Each alert is an attention marker. Alerts are not trade instructions, entry commands, exit commands, or automated strategy rules.
🧩 Confluence Logic
The strongest pressure read appears when multiple conditions align:
Range compression + directional buildup + supportive relative volume + constructive candle pressure + close location near the active trigger side.
When these conditions weaken, the planner can shift toward Coil Watch, Premature, or Fakeout Risk.
📊 When to Use
• Before evaluating a potential range breakout.
• During tight ranges where pressure may be building on one side.
• Around breakout watchlists where fakeout risk needs context.
• During volatility compression before expansion attempts.
• On liquid symbols where ATR, range boundaries, and relative volume are meaningful.
⚠️ When NOT to Use
• Extremely low-liquidity symbols with unreliable candles or volume.
• Very noisy micro-timeframes where range boundaries change too often.
• News-driven volatility spikes where pre-breakout pressure can distort quickly.
• Markets where the recent range is too wide to represent meaningful compression.
• As a standalone reason to enter or exit a trade.
🎛️ Key Inputs
• Pressure Range Lookback → controls the prior range used to build the active pressure box.
• Buildup Slope Lookback → controls how the script measures rising lows or falling highs.
• Sensitivity → changes how strict the compression model is.
• Minimum Pressure Score → sets the score needed for Bull Pressure or Bear Pressure states.
• Volume Support Level → defines constructive relative volume before breakout.
• Trigger Corridor ATR Width → controls the size of the upper and lower trigger corridors.
• Invalidation Buffer ATR → controls the active-side invalidation reference.
• Target Room Multiple → projects target-room context from the pressure range height.
• Visual settings → control boxes, guides, labels, panel visibility, panel location, theme, and font sizes.
🖥️ Interface & Visual Design
The interface is designed to be chart-first.
The main visual object is the active pressure box with a centered status label. Trigger corridors are narrow and controlled so the chart does not become a generic zone map. Event labels are compact, offset away from candles, and limited by cooldown and maximum-visible settings.
The AGPro panel follows the standard publication layout with a single merged blue title row, adjustable panel location, adjustable theme, and adjustable font size.
🧪 Practical Usage Workflow
1. Read the panel Pressure Score and Action.
2. Check whether the pressure box is tight or still too wide.
3. Review the Buildup Side and Volume Support rows.
4. Check whether Fakeout Risk is Low, Moderate, or Elevated.
5. Compare the active trigger corridor with invalidation and target-room context.
6. Treat labels and alerts as attention markers inside broader analysis.
🔍 Interpretation Guidelines
A high Pressure Score means the pre-breakout setup is more organized according to the script's rule set. It does not mean price must break out.
Bull Pressure and Bear Pressure describe directional buildup, not guaranteed direction.
Fakeout Risk means the boundary behavior deserves caution and context review. It does not mean a breakout cannot continue later.
Trigger Review means price is interacting with a corridor. It is a review state, not a command.
🚫 What This Script Is NOT
• Not a prediction engine.
• Not financial advice.
• Not auto trading.
• Not guaranteed signals.
• Not a buy/sell signal service.
• Not a post-breakout confirmation engine.
• Not a generic support/resistance zone map.
• Not an order-block, FVG, or supply/demand scanner.
⚠️ Limitations & Transparency
The script depends on selected lookback values, ATR normalization, relative volume behavior, and current timeframe.
Different symbols may compress differently. Some markets can show pressure for a long time before expansion. Others may probe a boundary and return inside the range several times.
The model is rule-based. Outputs should always be interpreted with broader structure, volatility, liquidity, and trader-defined risk controls.
🧠 Market Context Notes
Pre-breakout pressure is useful because the quality of a range can change before the breakout candle appears.
Rising lows can show pressure toward the upper boundary. Falling highs can show pressure toward the lower boundary. Volume support and candle pressure help judge whether that buildup is constructive or weak.
The script organizes these factors into a clean planner view so the user can decide whether the setup deserves attention, patience, or caution.
🧾 Use Case Examples
When price remains inside a tight range and the panel shifts to Bull Pressure with supported volume, the upper trigger corridor becomes the main review area.
When price presses into a boundary but the panel shows Elevated Fakeout Risk, the user can recognize that the probe may be weak or vulnerable to rejection.
When the score stays low and the state remains Premature, the range may need more time before it deserves attention.
🧱 System Philosophy
Pre-Breakout Pressure Planner follows the AGPro decision-engine approach: a script should help traders evaluate setup quality, risk, target room, and next action without promising an outcome.
The goal is not to add another signal. The goal is to improve the quality of the planning process before the chart forces a decision.
🔐 Non-Promise Statement
No script can guarantee direction, continuation, breakout success, or outcome.
This tool provides structured pre-breakout context only.
📉 Risk Disclosure
Trading involves risk.
Users are responsible for their own analysis, risk controls, position sizing, and trading decisions.
This script does not provide financial advice, investment advice, or guaranteed trading outcomes.
📚 Educational Note
Use the script to study how pressure builds inside ranges before breakout attempts.
The strongest learning value comes from comparing the panel state, pressure box, trigger corridors, and fakeout-risk labels with the broader chart context.
지표

Darvas Box Breakout Quality [AGPro Series]Darvas Box Breakout Quality
🔹 OVERVIEW
Darvas Box Breakout Quality is built for one of the most recognizable and widely searched chart-pattern structures in technical analysis: the Darvas Box.
The script focuses on the full Darvas lifecycle:
Box formation → compression quality → breakout direction → volume support → failed-break behavior.
Instead of treating every horizontal range as support and resistance, this script waits for a Darvas-style structure to form, validates the box by age and volatility-adjusted height, then evaluates how price resolves from that box. The result is a clean chart-pattern workflow designed for traders who want to study rectangular compression and breakout quality without turning the chart into a crowded zone map.
The main visual element is the active Darvas box itself. By default, resolved boxes are removed after breakout so the chart stays focused on the current live structure instead of filling with old rectangles.
🔹 WHAT MAKES IT DIFFERENT
Most box or breakout tools stop at drawing a rectangle or marking the first break beyond a level. Darvas Box Breakout Quality adds structure, scoring, and failure awareness.
Core differentiators:
• Darvas-first structure logic
The rectangle is not a generic support/resistance zone. It comes from a Darvas box formation process built around a fresh seed high, containment, age, and volatility-adjusted box height.
• Compression quality
The script measures whether the box has enough maturity and controlled range behavior before treating it as a meaningful active structure.
• Breakout quality score
Every qualified breakout is evaluated with a 0-100 model that includes compression quality, relative volume, breakout distance, candle body participation, and directional close location.
• Volume confirmation
Breakout labels can require volume support, helping separate stronger participation events from weaker boundary pokes.
• Failed-break tracking
After breakout, the script watches whether price returns back inside the former box within the selected failure window. If it does, the event is marked as a failed break.
• Premium visual restraint
The default chart view uses one active box, compact labels, controlled label spacing, and a compact AGPro panel. The goal is to make the chart informative without making it noisy.
🧭 WHY THIS DOES NOT OVERLAP WITH OTHER AGPRO TOOLS
This script is intentionally separated from the existing AGPro breakout and chart-pattern family.
It is not Inside Bar Breakout Quality, because it does not require a mother bar or inside-bar compression sequence.
It is not Donchian Breakout Quality, because it is not based on rolling channel highs and lows.
It is not Opening Range Breakout logic, because it is not tied to a session-defined range.
It is not Triangle Breakout Quality, because it does not use converging pivot boundaries, apex pressure, or diagonal structure.
It is not Breakout Volume Quality, because volume is only one part of the confirmation model, not the entire concept.
It is not a supply/demand, order-block, or generic support/resistance zone script. The rectangle exists only when the Darvas box formation process supports it.
That distinction matters visually and analytically. On the chart, this script tells a Darvas story: rectangular compression, active box behavior, quality of release, and failed-break review.
⚙️ METHODOLOGY
1. Darvas seed detection
The script looks for a fresh high over the selected lookback period. This high becomes the initial reference for a potential Darvas box.
2. Box formation
After the seed appears, price must spend enough time contained beneath the upper boundary while the lower boundary develops. The box remains in formation until it meets the selected age and height requirements.
3. Volatility normalization
The box height is measured relative to ATR. This helps filter boxes that are too flat to matter or too wide to represent clean compression.
4. Active box state
When the box qualifies, the script displays the active Darvas box and optional midpoint. The box projects forward so the active breakout boundary remains visible while price approaches it.
5. Breakout confirmation
A bullish breakout requires price to resolve above the Darvas top. A bearish breakout requires price to resolve below the Darvas bottom. Users can require close-based confirmation for stricter filtering.
6. Quality score
The breakout score combines:
• Compression quality
• Relative volume support
• ATR-normalized breakout distance
• Candle body participation
• Directional close location
7. Failed-break monitoring
After breakout, the script watches a defined number of bars. If price returns back inside the former Darvas boundary, the failed-break marker is printed.
📊 PANEL
The AGPro panel summarizes the current Darvas environment:
• Box Age
• Compression
• Breakout Side
• Volume Support
• Latest Quality / State
The first panel row follows the AGPro publication standard: one merged blue header row containing only the panel title. Panel location, panel theme, and panel font size are adjustable from settings.
🎛️ KEY INPUTS
Darvas Box Detection
• New High Lookback
• Minimum Box Age
• Maximum Box Age
• ATR Length
• Minimum Box Height ATR
• Maximum Box Height ATR
• Require Close Beyond Box
Breakout Quality
• Volume MA Length
• Volume Support Threshold
• Require Volume Support
• Target Break Distance ATR
• Minimum Breakout Score
• Failed Break Window
Visual Controls
• Show Active Darvas Box
• Show Box Midline
• Show Breakout Labels
• Show Failed Break Markers
• Keep Resolved Box
• Box Projection Bars
• Label Cooldown Bars
• Maximum Visible Labels
• Label Offset ATR
• Label Stack Offset ATR
• Label Font Size
Panel
• Panel Location
• Panel Theme
• Panel Font Size
🔍 HOW TO READ IT
When a Darvas box becomes active, the chart displays the live rectangular structure. The panel shows how old the box is, how compressed it is, and whether the latest environment has breakout direction or volume support.
When price resolves outside the box with enough quality, the chart prints a compact breakout label such as UP 79 or DN 75. The number represents the breakout quality score.
When price fails to hold outside the box and returns back inside during the selected failure window, the script prints a compact failed-break marker such as FAIL UP or FAIL DN.
The best readings come when the box is visually clear, compression is meaningful, and the breakout candle has both directional close quality and volume support.
🧩 BEST USE CASES
• Classic Darvas box formations
• Rectangular range compression
• Box breakout quality review
• Volume-backed breakout confirmation
• Failed-break review after a box release
• Clean chart-pattern study
• Multi-timeframe Darvas structure observation
• Screenshot-friendly public chart analysis
🧠 VISUAL DESIGN PHILOSOPHY
Darvas Box Breakout Quality is designed to look premium through restraint.
The script avoids filling the chart with old boxes by default. It keeps the active Darvas box as the main visual layer, uses short event labels, adds cooldown and stack spacing to reduce overlap, and keeps the panel compact.
This makes the indicator easier to publish, easier to read, and easier to use across different symbols and timeframes.
🔔 ALERTS
The script includes alert conditions for:
• High-quality bullish Darvas breakout
• High-quality bearish Darvas breakout
• Failed bullish Darvas breakout
• Failed bearish Darvas breakout
These alerts follow the same structure-aware logic used by the chart labels.
🔹 LIMITATIONS AND TRANSPARENCY
Darvas box detection is structure-based and depends on the selected lookback, age, and ATR filters. Changing those settings can make the script more selective or more active.
Volume support depends on the quality of the symbol's volume feed. On instruments where volume is less informative, users may prefer to adjust the volume threshold or disable the volume requirement.
The score is a structured description of breakout quality according to the script's internal model. It is designed to help compare Darvas box releases by quality, not to replace the user's broader market context.
✅ IDEAL USER
This script is designed for traders who want a focused Darvas box tool with cleaner structure detection, breakout quality scoring, volume confirmation, failed-break awareness, and a premium chart layout.
It is best suited for users who want the Darvas box itself to remain the main story on the chart. 지표

Flag Continuation Zones [AGPro Series]🔷 Flag Continuation Zones
Flag Continuation Zones is a premium bull flag and bear flag continuation engine designed to identify clean continuation structures without turning the chart into a generic breakout scanner.
The script focuses on a classic, highly recognizable price-action sequence:
impulse pole → controlled flag compression → qualified breakout → forward continuation zone
Instead of marking every small consolidation as a flag, the engine validates the structure through pole strength, travel efficiency, flag depth, channel compression, trend alignment, breakout distance, and optional volume participation.
🔷 What Makes This Different
Most flag indicators are visually simple but structurally loose. They often label shallow pauses, random pullbacks, or broad ranges as flags.
Flag Continuation Zones takes a stricter route.
It first requires a validated impulse pole. The move must be large enough relative to ATR and efficient enough to show directional commitment. After that, the script waits for a controlled counter-trend flag window. The flag must remain compact, avoid excessive retracement, and preserve continuation structure before any breakout is accepted.
This creates a chart experience that is more selective, cleaner, and easier to trust visually.
🔷 How The Engine Works
The script evaluates four core stages:
1. Pole Validation
The prior impulse is measured by ATR multiple and path efficiency. This helps separate real directional movement from noisy grinding price action.
2. Flag Compression
After the pole, the script studies the consolidation window. A valid flag must remain inside an acceptable depth and range relative to the pole.
3. Breakout Confirmation
A continuation event is accepted only when price clears the flag boundary with an ATR buffer and, when available, enough volume participation.
4. Continuation Mapping
Accepted structures create a forward rectangular zone, an impulse pole line, a breakout label, and an optional measured-move projection line.
🔷 Visual Design
The visual language is intentionally restrained:
- clean bull and bear flag labels
- rectangular continuation zones
- impulse pole reference lines
- optional measured-move target line
- trend EMA context
- compact AG Pro status panel
- adjustable panel location
- dark and light panel themes
- adjustable label and panel font sizes
The goal is to make the pattern visible and premium without crowding the chart.
🔷 How This Is Different From Other AGPro Tools
This script is not a generic Trend Continuation Quality tool. It is not an abstract continuation scorecard.
It is specifically built around the flag pattern family:
- impulse pole quality
- flag channel compression
- breakout through the flag boundary
- measured-move continuation context
It also avoids overlapping with triangle, consolidation breakout, Donchian breakout, inside-bar breakout, and trendline tools by staying focused on the pole-and-flag structure itself.
🔷 Best Fit
This script is useful for traders who want to scan for cleaner bull flag and bear flag continuation patterns across crypto, forex, stocks, indices, and futures.
It is especially suitable for:
- continuation traders
- breakout traders who want stricter structure
- price-action traders who follow classic chart patterns
- users who prefer rectangular zones and measured-move context
- traders who want fewer but higher-quality labels
🔷 Key Inputs
Important controls include:
- Pole Lookback
- Flag Window
- Minimum Flag Bars
- Minimum Pole ATR Multiple
- Minimum Pole Efficiency
- Maximum Flag Depth
- Maximum Flag Range
- Breakout Buffer
- Volume Confirmation
- Signal Cooldown
- Zone Forward Bars
- Label Font Size
- Panel Location
- Panel Theme
- Panel Font Size
🔷 In One Sentence
Flag Continuation Zones turns the classic bull flag and bear flag pattern into a cleaner, scored, zone-based continuation map built for premium public chart presentation.
지표

Effort vs Result Reaction Map [AGPro Series]Effort vs Result Reaction Map
⚖️ OVERVIEW
Effort vs Result Reaction Map is a premium volume-price reaction indicator built around one of the most practical ideas from Wyckoff and Volume Spread Analysis: effort only matters when it is compared with result.
Many volume tools stop at identifying high volume, relative volume spikes, wide candles or bullish/bearish pressure. This script goes further by asking a more selective question:
Is the market actually getting progress for the effort being spent?
The indicator compares normalized participation effort, ATR-adjusted price progress, close-location quality, directional efficiency and wick behavior. The output is a clean reaction map that highlights two specific event families:
• High effort + poor result
• Low effort + strong result
That makes the script different from a simple volume spike detector, a generic pressure map, a support/resistance drawer or a full Wyckoff phase tool. It is focused on the moment where participation and progress become meaningfully disconnected.
🔬 CORE IDEA
Effort is built from two dimensions:
• Relative volume versus a rolling participation baseline
• Candle spread normalized by ATR
Result is built from:
• Price progress over a configurable number of bars
• Close-location quality in the direction of progress
• ATR-normalized movement quality
Efficiency measures the relationship between those two sides. A bar can show strong volume, but if price does not achieve directional progress, the script treats that as a potential failed-progress reaction. A bar can also move cleanly with surprisingly low effort, which can reveal ease of movement and directional acceptance.
🧭 WHAT MAKES IT DIFFERENT
Most public volume indicators answer one of these questions:
• Is volume high?
• Is relative volume expanding?
• Is price near a volume shelf?
• Is pressure bullish or bearish?
• Is a Wyckoff phase forming?
Effort vs Result Reaction Map answers a narrower and more actionable chart-reading question:
Did the market receive enough result for the effort it spent?
This keeps the tool focused and prevents it from overlapping with broader volume profile, relative volume, delta, session reaction or support/resistance scripts. It does not try to label accumulation, distribution, spring, upthrust or phase structure. Instead, it turns effort/result imbalance into a compact reaction framework that can sit cleanly on any chart.
🎯 SIGNAL TYPES
High Effort + Poor Result
This event appears when participation and spread are unusually active but price progress remains weak. The script studies wick behavior and candle direction to estimate which side attempted progress and failed. The label then expresses the opposite reaction bias:
• Failed Bull Progress
• Failed Bear Progress
Low Effort + Strong Result
This event appears when price makes strong directional progress while effort remains unusually light. This can suggest ease of movement, cleaner directional travel or a lack of opposing participation in that moment:
• Low Effort Rise
• Low Effort Drop
Each event must pass a confidence threshold and a visual cooldown before it appears on the chart. This keeps the output selective and suitable for publication-quality screenshots.
🟦 REACTION BOXES
The script can draw rectangular reaction boxes around qualified events. These boxes are not generic support and resistance zones. They are event-native reaction ranges created only when the effort/result engine finds a meaningful imbalance.
Reaction boxes help the user track whether the market later respects, revisits or ignores the area where effort and result became disconnected. The box length, padding, transparency and minimum confidence are configurable.
This gives the chart more structure without turning the indicator into another broad zone tool.
📊 PANEL
The compact panel reports:
• Effort
• Result
• Efficiency
• Reaction Bias
• Confidence
The first panel row follows the AGPro standard format: one merged blue header row containing only the script name. Panel location, panel theme and panel font size are all configurable from the settings.
⚙️ KEY SETTINGS
Engine
• Effort Baseline Length controls the volume normalization baseline.
• ATR Normalization Length controls spread, progress and object spacing.
• Result Progress Bars defines how far back the result comparison looks.
• Volume Weight In Effort balances relative volume versus candle spread.
Reaction Thresholds
• High Effort Threshold defines unusual participation.
• Low Effort Threshold defines unusually light participation.
• Poor Result Threshold filters failed-progress events.
• Strong Result Threshold filters low-effort strong-result events.
• Minimum Event Confidence controls final event selectivity.
• Visual Cooldown Bars keeps labels and boxes from clustering.
Reaction Boxes
• Box Minimum Confidence keeps boxes more selective than labels if desired.
• Box Extend Right Bars controls how long reaction ranges remain visible.
• Box ATR Padding gives boxes a clean margin around the event candle.
• Box Transparency controls chart softness.
Labels And Markers
• Event labels can be enabled or disabled.
• Label confidence can be shown or hidden; it is hidden by default for cleaner screenshots.
• Label font size defaults to Normal.
• Label offset uses ATR so labels stay away from candle bodies.
• Directional markers provide a minimal visual cue for qualified reactions.
🧠 HOW TO USE
Apply the script to a liquid market and start with the default settings.
Watch for high-effort poor-result labels when volume and spread expand but the market fails to make clean progress. These areas can be useful for studying absorption, failed pushes and short-term reaction shifts.
Watch for low-effort strong-result labels when price moves cleanly without requiring heavy participation. These events can help identify easier directional travel and cleaner movement conditions.
Use the reaction boxes as context zones created by the event itself. They are best read together with structure, trend context, liquidity areas, session behavior or your own discretionary framework.
✅ BEST USE CASES
• Spotting failed directional progress after heavy participation
• Comparing volume effort with actual price result
• Identifying clean movement when result expands on lighter effort
• Studying short-term absorption and efficiency shifts
• Adding Wyckoff/VSA-inspired logic without using a full phase detector
• Keeping a premium chart layout with selective labels and contextual boxes
🧩 LIMITATIONS AND TRANSPARENCY
Effort vs Result Reaction Map is an analytical indicator, not a strategy.
It does not classify full Wyckoff phases, does not draw generic support/resistance, and does not attempt to forecast future price. Its purpose is to organize observed effort/result behavior into a clean visual framework.
Event quality depends on symbol behavior, timeframe, volume reliability and selected thresholds. Markets with unreliable volume data may need more conservative settings.
The script is designed to be selective by default, but users can tune thresholds, confidence, cooldown, label size, panel theme and reaction box visibility to match their preferred chart style.
지표

Low Volume Pullback Zones [AGPro Series]Low Volume Pullback Zones
🔷 Overview
Low Volume Pullback Zones is a trend-continuation overlay built for one very specific market behavior: a trend is already established, price retraces in a controlled way, volume dries up during that retracement, and the market later reclaims a continuation trigger.
The default profile is tuned for daily swing charts, where low-volume retracements usually form cleaner structural pockets and the chart has enough space for the boxes to read properly. A 4H Active preset is included for traders who want more frequent mapping, while Custom mode exposes the raw controls.
Many pullback tools focus only on price touching a moving average, a SuperTrend line, or a generic support/resistance area. This script is intentionally narrower. It looks for the quieter part of a trend: the moment where participation contracts during a retracement, the pullback stays shallow relative to the prior impulse, and a clean continuation pocket can be mapped with a visible invalidation boundary.
The goal is not to mark every trend candle. The goal is to isolate the cleaner pauses inside trend conditions where the pullback behaves like controlled absorption instead of aggressive reversal pressure.
🟩 What The Script Detects
The engine combines five layers:
1. Trend Side
The script first checks whether the market has a clean bullish or bearish trend profile using EMA alignment, EMA slope, DI direction, and ADX strength. If the trend is flat or mixed, the script avoids mapping low-quality pullbacks.
2. Low RVOL Retracement
During a pullback, the script measures relative volume against a rolling volume baseline. A stronger dry-up score means the retracement is happening with lighter participation, which often creates a cleaner continuation context than high-volume countertrend pressure.
3. Shallow Pullback Depth
The pullback is measured against the prior impulse reference range. Controlled retracements receive higher scores, while deep retracements move toward failure risk.
4. Continuation Trigger
The script waits for price to reclaim beyond the pullback pocket boundary with a small ATR buffer and relative-volume recovery. This prevents the chart from filling with premature pullback labels before the structure actually confirms.
5. Invalidation Boundary
Every active dry-up pocket has a structural boundary beyond the deepest pullback extreme. If price breaks that boundary, the pocket is treated as invalid rather than leaving an old setup on the chart.
🟦 Chart Visuals
The main visual layer is the Dry-Up Pullback Pocket.
When a valid pullback begins, the script draws a compact rectangular pocket around the retracement range. If the pocket confirms, the script projects a tighter functional retest/hold zone instead of extending the entire historical pullback range. This makes the zone easier to use: bullish zones focus on the reclaimed upper pocket area, bearish zones focus on the reclaimed lower pocket area, and the dotted invalidation boundary remains beyond the failed side of the structure.
Dry-Up Watch labels can appear before final confirmation when the pullback already has strong volume contraction and acceptable structure. Rejected context boxes are optional and disabled by default because they are diagnostic, not actionable hold zones. Trigger labels remain compact and controlled by cooldown logic. The default behavior keeps the chart active enough to be useful without making it feel crowded or noisy.
🟨 Info Panel
The panel summarizes the current state:
Trend Side - bullish trend, bearish trend, or no clean trend.
Dry-Up Score - how strongly volume contracted inside the active or most recent pocket.
Pullback Depth - retracement depth relative to the prior impulse.
Trigger State - mapping, triggered, expired, boundary lost, trend lost, or waiting.
Failure Risk - a compact risk read based on depth, volume behavior, and pullback duration.
The panel location, panel theme, panel font size, and label font size are configurable from settings. The first panel row follows the AGPro Series standard format with a single merged blue header row.
🟪 What Makes This Different
This script is not a generic trend meter.
It is not a SuperTrend reaction tool.
It is not a broad continuation score dashboard.
It is not a volume spike or climax detector.
Low Volume Pullback Zones is focused on the relationship between trend continuation and volume contraction during the retracement itself. That makes the script different from tools that only measure trend strength, moving-average reclaim, breakout quality, support/resistance reactions, or high-volume pressure events.
The core question is:
Did the pullback become quiet enough, shallow enough, and controlled enough to justify a mapped continuation pocket?
That narrow question is what gives the script its identity.
🧭 How To Read It
Bullish dry-up pocket:
The trend filter is bullish, price retraces into the EMA lane, average RVOL contracts, depth remains controlled, and price reclaims the upper pocket boundary.
Bearish dry-up pocket:
The trend filter is bearish, price retraces upward into the EMA lane, average RVOL contracts, depth remains controlled, and price reclaims the lower pocket boundary.
Failure risk:
Failure risk rises when the pullback becomes too deep, too long, or too active in volume terms. A higher failure risk means the retracement is no longer behaving like a quiet continuation pause.
Invalidation boundary:
The dotted boundary marks the structural area where the active pocket is no longer considered valid.
⚙ Key Settings
Engine Preset:
Daily Swing is the default and is designed for cleaner publication-grade structure. 4H Active keeps more frequent lower-timeframe pockets. Custom uses the direct input values.
Fast / Mid / Slow EMA Lengths:
Control the trend structure used by the pullback engine.
Minimum ADX and Minimum EMA Slope:
Help the script avoid mapping dry-up pockets in flat conditions.
Relative Volume Length:
Defines the baseline used to measure volume dry-up.
Preferred Pullback RVOL:
Controls how quiet the pullback should be to receive full dry-up credit.
Preferred Max Depth:
Defines the ideal shallow retracement threshold.
Trigger Buffer:
Adds a small ATR-based confirmation buffer beyond the pullback pocket.
Pocket Projection Bars:
Controls how far completed pockets extend to the right.
Functional Zone Width:
Controls how much of the original pullback range is projected after confirmation. Smaller values create a tighter retest/hold pocket; larger values keep more of the original pullback structure.
Label Cooldown and Max Structures:
Keep the overlay readable and publication-clean.
📌 Best Use
This indicator is best used on markets that already show directional structure. It is designed for traders who study trend continuation, relative volume behavior, pullback quality, and invalidation-based chart structure.
It can be used across crypto, forex, indices, equities, and commodities, but the most useful results generally appear when the market has enough trend strength for low-volume retracements to matter.
🟧 Design Philosophy
Low Volume Pullback Zones was built to keep the chart premium and readable:
Clean pocket boxes instead of noisy background clutter.
Restrained watch and trigger labels instead of constant marker spam.
Visible invalidation boundaries instead of ambiguous zones.
Professional RVOL and depth scoring instead of simple moving-average touches.
Configurable panel and label sizing for different chart layouts.
The script is intentionally selective. Its strongest value comes from filtering out ordinary pullbacks and highlighting the ones where trend, volume dry-up, shallow depth, and continuation confirmation align.
지표

Breakout Volume Quality [AGPro Series]Breakout Volume Quality
🔷 OVERVIEW
Breakout Volume Quality is a chart-overlay indicator built to answer one specific question:
When price breaks a defended level, did that break carry real participation quality, or was it only a low-conviction move beyond the line?
Many breakout tools detect the level break itself. This script goes one layer deeper. It evaluates the breakout candle through relative volume, body efficiency, close location, distance beyond the broken level, expansion versus ATR, and the quality of the underlying support-resistance range. The output is a clean 0-100 breakout volume quality score, a visual confirmation band, a compact event label, and a retest state panel.
The goal is not to mark every possible breakout. The goal is to separate a cleaner participation-backed break from a weak level poke that deserves less visual attention.
🔹 CORE IDEA
A breakout is more useful when price does more than cross a line.
Breakout Volume Quality looks for a sequence:
1. A support or resistance reference is built from repeated pivot interaction.
2. Price closes beyond that defended level by an ATR-adjusted buffer.
3. The breakout candle is graded for relative volume participation.
4. Candle structure is checked for efficient body control and directional close quality.
5. The move is measured against ATR to understand displacement and expansion.
6. Confirmed events project a forward confirmation band.
7. The script then tracks whether the broken level produces a clean retest hold, expires, or fades back inside.
This creates a more complete event map than a simple arrow above or below a candle.
💠 UNIQUE EDGE
The edge of this script is the "volume verdict" layer.
It does not simply ask whether price broke resistance or support. It asks whether the break showed enough participation quality to deserve confirmation.
That distinction matters because visually similar breakouts can behave very differently:
- A break with elevated relative volume, strong body efficiency, and a close near the directional extreme usually communicates cleaner participation.
- A break with low relative volume, wick-heavy structure, and a weak close beyond the level may be more fragile.
- A move that breaks, confirms, and later holds the band is visually different from a move that immediately fades back inside.
Breakout Volume Quality turns those differences into a readable score and a structured chart layer.
🔶 WHAT MAKES IT DIFFERENT FROM OTHER AGPRO BREAKOUT TOOLS
This script was intentionally designed to avoid overlapping with the existing AGPro breakout family.
It is not a Donchian breakout tool.
It does not revolve around a rolling channel high or low as the main concept. The level reference comes from defended pivot interaction, and the main evaluation is the volume quality of the break.
It is not an Inside Bar breakout tool.
It does not require a parent candle compression pattern. The script can evaluate broader defended levels rather than only inside-bar structures.
It is not an Opening Range breakout tool.
There is no session opening window, no locked opening range, and no session-specific model.
It is not an ATR Envelope breakout tool.
It does not treat a dynamic volatility envelope as the breakout boundary. ATR is used for normalization, buffers, bands, and score scaling.
It is not a Break-Retest quality tool.
The retest state is included for workflow context, but the core score is assigned to the breakout candle and its participation quality. The first retest is not the central scoring event.
It is not a Failed Break or trap-reclaim tool.
Weak breaks are faded as failed confirmations, but the script does not rebuild the event into a reversal or reclaim model.
It is not a general RVOL pressure map.
Relative volume is used specifically to validate level breaks, not to classify all candles into broad pressure states.
This gives Breakout Volume Quality its own clear lane: breakout participation quality around defended levels.
📌 VISUAL COMPONENTS
Breakout Line
The broken level is extended forward so the user can see the exact structural reference being tested.
Decision Rails
Eligible defended support and resistance references are displayed as subtle forward rails. These rails keep the chart active while price is building around a level, without turning the script into a generic support-resistance map.
Volume Build-Up Windows
Compact boxes labeled BULL SETUP or BEAR SETUP can frame areas where price is building volume pressure near an eligible breakout level before confirmation. These windows are concept-native: they show pre-breakout participation pressure, not generic support-resistance zones.
Optional Advanced Layers
RVOL approach marks, quality candle glow, and pressure trail points are available for users who want more activity on the chart, but they are disabled by default so the main public view remains easy to read.
Confirmation Band
A rectangular band is projected around the broken level. Confirmed events use stronger visual emphasis, while weak confirmations are faded so the chart keeps important context without becoming noisy.
Failed-Confirmation Fade
When price breaks a level but fails the volume, score, candle structure, or close-quality model, the event can still be shown as a softer failed confirmation band. Cleaner weak confirmations can also print WEAK UP or WEAK DOWN labels through a minimum-score filter, so the chart gains more context without labeling every low-quality break.
Retest Hold Label
After a confirmed breakout, the script watches the band for a clean hold. A retest hold is labeled only once so the chart remains controlled.
Summary Panel
The panel displays the current breakout side, volume confirmation, expansion, retest state, and score. It is designed for quick chart reading without covering the price action.
⚙️ SCORING MODEL
The score is built from six components:
Relative Volume
Measures whether current participation is meaningfully above its volume baseline.
Body Efficiency
Measures how much of the candle range is represented by the real body.
Directional Close Location
Checks whether the candle closes toward the breakout side of its own range.
Break Distance
Measures how far the close finishes beyond the broken level in ATR terms.
Expansion
Measures the breakout candle range relative to ATR.
Range Quality
Rewards levels that come from a more defined structure rather than a loose oversized range.
Together, these components produce a transparent 0-100 score and a grade-style readout.
🧭 HOW TO USE
Use the script to study whether a breakout has participation quality.
A stronger event usually has:
- A clean close beyond the level.
- Relative volume above the confirmation threshold.
- A body-dominant candle.
- A close near the breakout-side extreme.
- Meaningful ATR-normalized displacement.
- A confirmation band that later holds during a retest.
A weaker event may show:
- Low relative volume.
- A wick-heavy breakout candle.
- A close barely beyond the level.
- Fast return back inside the broken structure.
- A faded failed-confirmation label instead of a confirmed event.
The script is best used as a structured chart-reading layer. It helps organize breakout quality, but it is not a complete trading system by itself.
🔷 KEY INPUTS
Pivot Strength
Controls how support and resistance references are confirmed.
Minimum Level Touches
Requires repeated interaction before a level becomes eligible.
Level Match Tolerance ATR
Groups nearby pivots into one defended level.
Close Beyond Level ATR
Controls how decisive the break must be beyond the level.
RVOL Confirmation Threshold
Defines the participation level required for volume confirmation.
Minimum Body Efficiency
Filters weak, wick-heavy breakout bars.
Directional Close Location
Requires the candle to close toward the breakout side.
Minimum Score To Confirm
Controls how selective confirmed breakout labels should be.
Confirmation Band ATR
Sets the height of the projected band around the broken level.
Retest Watch Window
Defines how long the script watches for a clean retest hold.
Panel Location / Theme / Font Size
Allows the panel to be adapted to different chart layouts.
Label Font Size / Label Offset
Keeps labels readable and away from candle bodies.
🔶 BEST USE CASE
Breakout Volume Quality works best when the chart has visible defended levels and the user wants a cleaner way to judge whether the break had enough participation behind it.
It is especially useful for:
- Breakouts through repeated swing highs or swing lows.
- Range exits where volume quality matters.
- Comparing strong break candles against weak level pokes.
- Reviewing whether a breakout level later behaves as a confirmation band.
- Keeping weak break attempts visible without giving them the same visual weight as confirmed events.
The script is intentionally restrained: no oversized dashboard, no heavy channel system, no session dependency, and no unnecessary signal spam. The chart stays focused on the level, the break, the volume verdict, and the retest state.
🔹 ALERTS
The script includes alert conditions for:
- Bullish breakout volume confirmation.
- Bearish breakout volume confirmation.
- Breakout failed volume confirmation.
- Breakout retest hold.
- Breakout failed back inside.
These alerts are event prompts for chart review and workflow organization.
💎 DESIGN PHILOSOPHY
Breakout Volume Quality is built to feel clean, premium, and practical on a public TradingView chart.
The visual hierarchy is deliberate:
- Confirmed breaks are visible but not loud.
- Cleaner weak confirmations are faded and labeled through a score filter, while low-quality weak breaks stay visually softer.
- Decision rails keep active levels visible between major events.
- Labeled setup windows explain where pre-breakout volume pressure is forming.
- Optional activity layers are available, but the default chart does not rely on unlabeled dots.
- Bands are long enough to make the level meaningful.
- Retest labels appear only when the state actually changes.
- The panel stays compact and focused on the fields that matter.
The result is a breakout tool that is easy to understand at first glance, but still has enough structure underneath to support serious review.
지표

Volume Absorption Zones [AGPro Series]Volume Absorption Zones
🔷 Overview
Volume Absorption Zones is a chart-overlay volume analysis tool built around one specific market condition: high effort with limited price result.
Instead of marking every high-volume candle as important, the script looks for candles where participation expands while the candle range stays compressed, the close location shows directional control, and the resulting price area can be tracked as a forward absorption zone.
When a valid event appears, the script draws a rectangular bullish or bearish absorption box, projects it forward, adds an invalidation level, and continues monitoring whether the zone is defended, failed, or left as active context.
The goal is to make absorption visible as a lifecycle on the chart rather than a one-bar marker.
🔹 Core Idea
Absorption is not the same thing as a volume spike.
A volume spike can appear during expansion, exhaustion, liquidation, news reactions, or ordinary session activity. This script focuses on a narrower structure:
- Volume expands relative to its recent baseline.
- Candle spread remains compressed relative to its recent range baseline.
- The close location shows directional control.
- The wick/body structure leaves a usable absorption range.
- The zone remains visible after the event so later defense or failure can be evaluated.
Bullish absorption is modeled as high participation absorbed near the lower side of the candle while the close finishes with upper-side control.
Bearish absorption is modeled as high participation absorbed near the upper side of the candle while the close finishes with lower-side control.
This makes the script an effort-versus-result zone model, not a generic volume highlight.
💎 What Makes This Script Different
Most volume absorption scripts and high-volume tools stop at one of three outputs:
- A candle color.
- A triangle or label.
- A simple high-volume marker.
Volume Absorption Zones goes further by converting the detected event into a managed chart zone.
The script keeps asking questions after the first signal:
- Where is the absorption range?
- Is the zone still active?
- Has price defended the zone?
- Has price closed beyond the invalidation level?
- Is follow-through improving or fading?
- How old is the zone?
- Is the current context bullish absorption, bearish absorption, defended, failed, or mature?
This lifecycle approach is the main design difference. The first event creates the zone; the later candles tell the story.
🧭 Difference From Other AGPro Scripts
This script was designed to sit in a separate lane from existing AGPro volume and price-action tools.
It is not Volume Climax Detector.
Volume Climax Detector focuses on extreme participation and climax-style events. Volume Absorption Zones focuses on compressed effort: elevated volume with limited spread and a forward zone that can later defend or fail.
It is not Relative Volume Pressure Map.
Relative Volume Pressure Map classifies broader relative-volume pressure and pressure efficiency. Volume Absorption Zones does not try to build a broad pressure regime. It isolates concrete absorption ranges and follows their lifecycle.
It is not Volume Delta Imbalance Map.
Volume Delta Imbalance Map is built around flow imbalance behavior. Volume Absorption Zones does not estimate bid/ask delta, CVD, or directional transaction flow. It stays OHLCV-native and uses candle structure plus relative volume effort.
It is not Volume Profile Acceptance Ladder or a POC tool.
This script does not build volume profile bins, value area, POC magnets, acceptance ladders, or auction distribution zones. Its zones come only from absorption-candle conditions.
It is not a general support/resistance drawer.
The boxes are not swing highs, swing lows, pivots, order blocks, or manually projected support/resistance areas. A box appears only when the absorption engine detects high effort, compressed result, close-location control, and sufficient quality.
That separation is important: the script is not a renamed version of another AGPro concept. Its role is absorption-zone lifecycle tracking.
⚙️ How The Engine Works
The script evaluates each candle through a structured sequence:
1. Volume Effort
Current volume is compared with a rolling volume baseline. The event must show elevated participation before any absorption zone can be created.
2. Spread Compression
The candle range is compared with a recent spread baseline. A qualifying event needs limited price travel relative to normal range behavior.
3. Close Location
Bullish absorption requires the close to finish in the upper part of the candle. Bearish absorption requires the close to finish in the lower part of the candle.
4. Absorbed Wick Share
The script checks whether the candle leaves enough absorbed-side structure to define a useful zone.
5. Absorption Quality
Effort, compression, and close-location behavior are blended into a quality score. This helps filter weaker events and keeps the chart focused on stronger absorption structures.
6. Zone Projection
When the event qualifies, the script draws a rectangular zone and extends it forward for the selected number of bars.
7. Invalidation Level
Each zone receives an ATR-buffered invalidation line beyond the absorption range.
8. Defense / Failure Tracking
After the zone is created, the script tracks whether price defends the range or closes beyond invalidation.
📦 Zone States
Active
The zone has been created and remains unresolved.
Defended
Price interacts with the zone and closes back in favor of the zone direction.
Failed
Price closes beyond the ATR-buffered invalidation level.
Mature
The zone remains active beyond the selected age threshold.
These states help the user understand whether an absorption zone is still relevant, has been respected, or has lost its structure.
📊 AGPro Panel
The dashboard summarizes the latest absorption context without requiring the user to inspect every box manually.
Panel fields:
- Absorption Side
- Effort Score
- Spread Compression
- Follow-through
- Zone Status
- Zone Age
The panel follows the AGPro publication layout:
- Single merged blue header row.
- Header contains only the script panel title.
- Adjustable panel location.
- Adjustable panel theme.
- Adjustable panel font size.
🎯 Visual Design
The script is designed to be readable on clean publication charts:
- Bullish zones use the AGPro teal state color.
- Bearish zones use the AGPro pink state color.
- Failed zones shift to the neutral state color.
- Defended zones shift to the accent state color.
- Invalidation lines are dotted and subtle.
- Event labels are offset from candles so they remain visible.
- Label cooldown and maximum-label settings keep density under control.
- Active zone count is capped for performance and readability.
The default visual style is intentionally active, because absorption is easier to understand when the zone lifecycle is visible on the chart.
🔔 Alerts
Included alert conditions:
- Bullish Absorption Zone
- Bearish Absorption Zone
- Absorption Zone Defended
- Absorption Zone Failed
These alerts are tied to the same lifecycle states shown on the chart.
🛠 Key Inputs
Volume Baseline Length
Controls the lookback used to normalize current volume.
High Effort Threshold
Defines how much relative volume expansion is required before a candle can qualify.
Spread Baseline Length
Controls the range baseline used for spread compression.
Maximum Spread Ratio
Defines how compressed the candle must be relative to its baseline.
Strong Close Location
Controls how strongly the candle must close toward the active side.
Minimum Absorbed Wick Share
Requires visible absorbed-side candle structure before a zone can be accepted.
Minimum Absorption Quality
Filters events by the combined effort, compression, and close-location score.
Zone Extension Bars
Controls how far absorption boxes project forward.
Max Active Zones
Caps the number of active boxes retained on the chart.
Invalidation Buffer ATR
Controls the ATR buffer used for each zone's invalidation level.
Mature Zone Age
Defines when an unresolved zone is considered mature.
Max Zone Memory Bars
Removes older zones so the chart remains focused on recent, visible absorption context.
Label Cooldown Bars
Controls spacing between event labels.
Max Event Labels
Controls the maximum number of retained labels.
Label Font Size / Panel Font Size
Both default to Normal and can be adjusted from settings.
🧩 Best Use
Volume Absorption Zones is designed for traders who want to study:
- High-effort, low-result candles.
- Absorption zones that remain visible after the initial event.
- Whether later price action defends or fails those zones.
- Market areas where volume expands but price travel remains compressed.
- Weekly, daily, and intraday absorption structures without needing a lower-pane volume dashboard.
The script can be used across symbols and timeframes where TradingView volume data is available. The quality of results depends on the instrument, session structure, liquidity, and reliability of the volume feed.
🔍 Limitations & Transparency
This script uses standard TradingView OHLCV data.
It does not access order book data, bid/ask data, footprint data, true delta, or exchange-native transaction flow.
The absorption model is rule-based. It approximates absorption through relative volume effort, spread compression, close-location behavior, wick/body structure, and later zone interaction.
It does not predict future price movement and it does not issue buy or sell commands. It organizes absorption context on the chart so users can evaluate how price behaves around those zones.
Different instruments and timeframes may require input adjustments. Thin markets, irregular volume feeds, major gaps, and unusual sessions can affect event quality.
✅ Chart Reading Guide
For the clearest view, use a clean chart with only this script loaded. The boxes, labels, dotted invalidation lines, and panel are designed to explain the absorption lifecycle without requiring additional overlays.
지표