지표

지표

지표

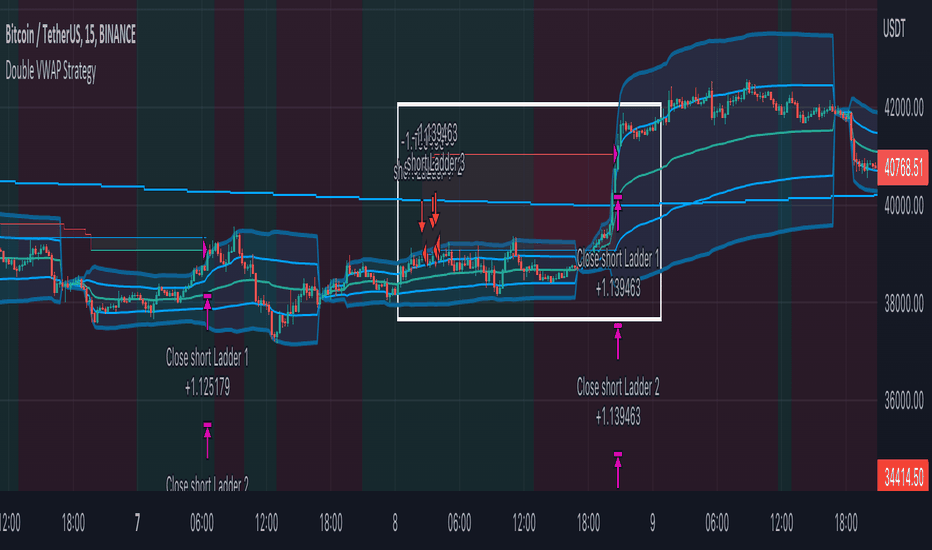
SMA VWAP BANDS [qrsq]Description
This indicator is used to find support and resistance utilizing both SMA and VWAP. It can be used on lower and higher time frames to understand where price is likely to reject or bounce.
How it works
Rather than using the usual calculation for the VWAP, instead this script smooths the volume first with the SMA and then respectively calculates the smoothed multiplication of high, low and close price with the volume individually. These values are then divided by the smoothed volume to find individual VWAP's for each of the sources. The standard deviations of these are calculated, resulting in an upper, lower and middle band. It is essentially VWAP bands with some smoothed calculations in the middle.
How to use it
I like to use the bands for LTF scalping as well as HTF swings.
For scalping:
I tend to use either the 5m or 15m TF
I then set the indicator's TF to 1m
I will take a scalp based on the bands confluence with other PA methods, if price is being either supported or rejected.
For swings:
I tend to use a variety of TFs, including: 30m, 1H, 4H, D
I then set the indicator's TF to "Chart"
I will take a swing based on the bands confluence with other PA methods, if price is being either supported or rejected.
I also tend to use them on perpetual contracts as the volume seems to be more consistent and hence results in more accurate support and resistance. 지표

지표

지표

지표

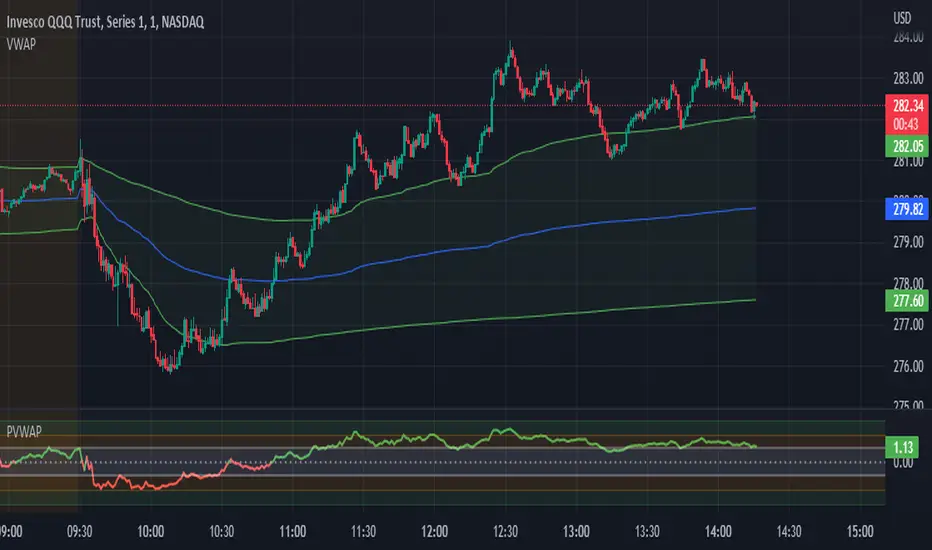
VWAP + EMA Analysis [Joshlo]Overview and Use Case
VWAP Analysis gives the possibility to combine multiple time frames of VWAP along with a triplet of exponential moving averages. This can provide insight into potential scalp, swing and longer term trades, depending on your time frame. The use of this indicator with it's setup is based off the the Scalp Setup Alerts provided by Roensch Capital.
The primary use for this script is to help with intraday scalp set ups. Using the Daily VWAP, turned on by default, we can look for price to respect and bounce from one of the VWAP lines (support or resistance) back toward equilibrium, we can also look for price to bounce off of equilibrium and move back toward VWAP support or resistance.
The chart attached shows AMD bouncing off of the Daily time frame VWAP Resistance level multiple times (see yellow boxes), often with confirmation given by an increase in volume which is often far higher than the average volume. In many of these cases a short position could've been opened or put option could have been placed with a profitable outcome.
Every line projected onto the chart via this indicator has the potential to create support or resistance as well as causing 'hang ups', meaning price loses it's momentum, slows down and hangs out in the particular area. This is shown on the chart within the green box.
Chart walkthrough - See attached chart
After a rejection off of the Daily VWAP Resistance line (depicted by the white circle), price starts to move back toward Daily VWAP Equilibrium. In order to reach this line, price needs to move through the 20EMA (white) and 50EMA (purple), the Weekly VWAP Resistance (red circles) and the 200EMA (orange). All of these lines are a part of this single indicator.
The 20EMA seems to offer little resistance but follows the price on it's move, offering some resistance to a volatile move upward. Initially upon contact with the 50EMA, price hangs up and bounces above and below the line whilst finding support on the Weekly VWAP Resistance at the same time. This causes a 'hang up' or sideways movement for around 20 minutes of trading. A potential trade may have entered at the white circle with a VWAP Resistance rejection and exited upon contact with the 50EMA in anticipation of multiple EMAs and support / resistance lines converging which is known to cause price movement to slow.
Eventually with an increase in volume, price breaks below the 20EMA (white), 50EMA (purple) and the Weekly VWAP Resistance level (red circles). Price then finds support on the 200EMA (orange), although there was potential for the price to fall to the Daily VWAP Equilibrium (solid blue). As the Red VWAP lines tend to act more often as resistance as opposed to support (price is rarely above these lines for extended periods), the trade from earlier may have profited more by awaiting contact with the 200EMA before exiting, taking the assumption that the Weekly VWAP Resistance was more likely to act as resistance than support.
A period of consolidation in the green box, around the Weekly VWAP Resistance, 20EMA, 50EMA and with support from the 200EMA eventually resulted in another break out where the price came back up to the Daily VWAP Resistance. Prior to the end of this trading day, there were two more opportunities for scalp setups based off of the price showing consistent rejections off the Daily VWAP Resistance back down to the 50EMA.
In the final example, price breaks above the Daily VWAP Resistance but quickly rejects off of the Monthly VWAP Resistance. For examples where the VWAP Resistance or Support or broken, it can help to look at an indicator such as the RSI to look for bullish divergence or bearish divergence.
Just as this example shows bounces and rejection off of VWAP Resistance, the same applies around the Equilibrium and Support VWAP lines.
The perfect scenario would be to find a ticker where there has already been two or three bounces off of one of these levels, with the goal of taking the trade on the next bounce and either using a percentage price target or technical price target based off of the EMAs or VWAP lines. If there are EMAs close in the direction you want to take the trade, there is a higher chance of hang ups and reversals, so a clear run is the more desired trade set up.
You can also look for these indicator lines to stack up in order to form a stronger support and resistance. For example the 200EMA and Daily VWAP Equilibrium being close to each other may suggest it would take more of an effort to break both of these levels, but one by itself may break more easily.
Indicator Setup
In the settings for the indicator, almost everything you might want to change can be done from the Input tab.
The three options for VWAP (daily, weekly and monthly) allow for analysis on multiple time frames. Daily is turned on as standard.
Standard Deviation Multiplier is set to 2 as standard, this effects the distance of the VWAP support and resistance from the equilibrium line. This seems to be a level that works well with finding support and resistance lines, however if there is excessively high or low volume, occasionally the lines can be thrown off. You can adjust this level if required to find a 'sweet spot' where price likes to reject or find support.
The colors for all VWAPs can be adjusted via the Inputs tab, however if you'd like to change the type of line these are depicted as, this can be done from the Styles tab.
The 3 EMAs (20, 50 and 200) can be toggled on or off and also have their color changed. The style of the lines can be adjusted from with the Styles tab if required. 지표

지표
지표

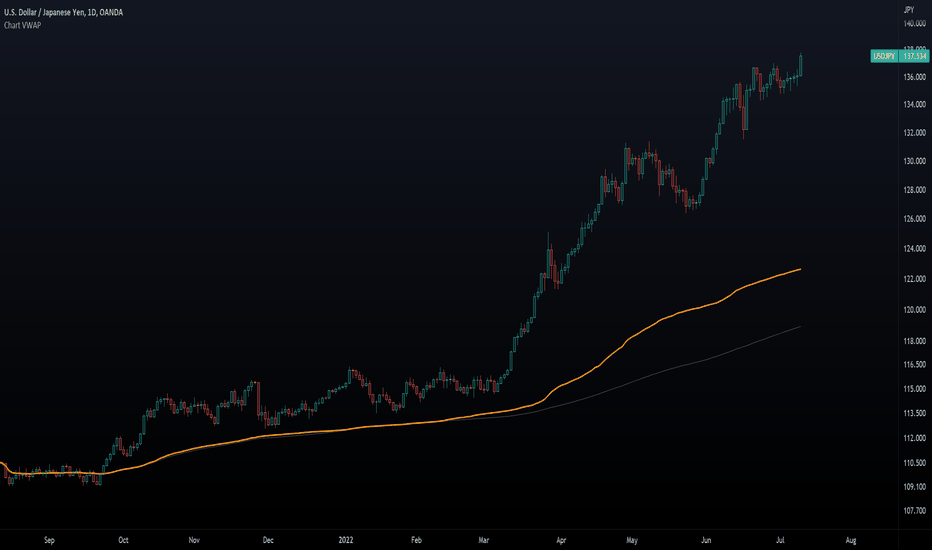
Chart VWAP█ OVERVIEW
This indicator displays a Volume-Weighted Average Price anchored to the leftmost visible bar of the chart. It dynamically recalculates when the chart's visible bars change because you scroll or zoom your chart.
If you are not already familiar with VWAP, our Help Center will get you started. The typical VWAP is designed to be used on intraday charts, as it resets at the beginning of the day. Our Rolling VWAP , instead, resets on a rolling time window. You may also find the VWAP Auto Anchored built-in indicator worth a try.
█ HOW TO USE IT
Load the indicator on an active chart (see the Help Center if you don't know how). By default, it displays the chart's VWAP in orange and a simple average of the chart's visible close values in gray. This average can be used as a companion to the VWAP, since both are calculated from the same set of bars. The script's settings allow you to hide it.
You may also use the script's settings to enable the display of the chart's OHLC (open, high, low, close) levels and the values of the high and low. These are also calculated from the range of visible bars. You can complement the high and low lines with their price and their distance in percent from the chart's latest visible close . You can use the levels to quickly identify the distances from extreme points in the visible price range, as well as observe the visible chart's beginning and end prices.
█ NOTES FOR Pine Script™ CODERS
This script showcases three novelties:
• Dynamic recalculation on visible bars
• The VisibleChart library by PineCoders
• The new `anchor` parameter of ta.vwap()
Dynamic recalculation on visible bars
This script behaves in a novel way made possible by the recent introduction of two new built-in variables: chart.left_visible_bar_time and chart.right_visible_bar_time , which return the opening time of the leftmost and rightmost visible bars on the chart. These are only two of many new built-ins in the `chart.*` namespace. See this blog post for more information, or look up them up by typing "chart." in the Pine Script™ Reference Manual .
Any script using chart.left_visible_bar_time or chart.right_visible_bar_time acquires a unique property, which triggers its recalculation when traders scroll or zoom their chart, causing the range of visible bars to change. This new capability is what makes it possible for this script to calculate its VWAP on the chart's visible bars only, and dynamically recalculate if the user scrolls or zooms their chart.
This script is just a start to the party; endless uses for indicators that redraw on changes to the chart will no doubt emerge through the hands of our community's Pine Script™ programmers.
The VisibleChart library by PineCoders
The newly published VisibleChart library is designed to help programmers benefit from the new capabilities made possible by the fact that Pine Script™ code can now tell when it is executing on visible bars. The library's description, functions and example code will help programmers make the most of the new feature.
This script uses three of the library's functions:
• `PCvc.vVwap()` calculates a VWAP for visible bars.
• `PCvc.avg()` calculates the average of a source value for visible bars only. We use it to calculate the average close (the default source).
• `PCvc.chartXTimePct(25)` calculates a time value corresponding to 25% of the horizontal distance between visible bars, starting from the left.
The new `anchor` parameter of ta.vwap()
Our script also uses this new `anchor` parameter to reset the VWAP at the leftmost visible bar. See how simple the code is for the VisibleChart library's `vVwap()` function.
Look first. Then leap.
지표
지표

지표

지표

지표

지표

Neo Matrix
What is NeonMoney Indicator?
NeonMoney Indicator is a trend following indicator which gives strong support and resistance indications with some moving averages.
Description
After the long research of 2 years along with 100’s of indicators & oscillators we have created this wonderful indicator which can avoid signals in a choppy market & gives perfect signal to buy and sell at a right time with high winning probability and higher reward to risk.
Main part of this indicator is timeframe period that is it shifts from one to another pivots , vwap and MAs tf automatically which helps in top down analysis.
This indicator is made with Vwap , MA, cpr and fibonacci pivots calculations. It can be useful to trade every market like in crypto, forex, commodities and as well as stock market . To use this indicator trader must have basic understanding of candle pattern and chart pattern identification studies with moving averages retrenchments.
This indicator works well & gives better results if you have moving average retrenchment knowledge. When candles are retrenching specific moving average line then also sometimes traders get confuse whether to enter with moving average direction / favor or not. So, to come out from this confusion this indicator is very useful. Because it gives signal in moving average favors and target at pivot levels. So ultimately traders gain some confident on his/her trade that he/she is in the right side of the market.
Another advantage of this indicator is in some of the criteria it gives fix signal in-between the candle formation & once signal is given then it will not change.
About uses instruction and components.
Time frame – 1m, 3m , 15m, 1H, 4H, DailyTF
Components: Vwap , MAs, CPR , and Fibonacci Pivots .
Dotted line - Vwap
Straight gray line and zone - CPR
Curvy Gray lines - MAs
Colorful lines - Fibonacci pivots
지표

지표

지표

지표

지표

전략

전략