여기는 toodegrees의 유료 공간입니다. 이제 트레이딩뷰에서 직접 그들의 유료 콘텐츠에 접근할 수 있습니다. 유료 공간에 대해 더 알아보기 Fractal Model [Pro+] (TTrades) Introduction:
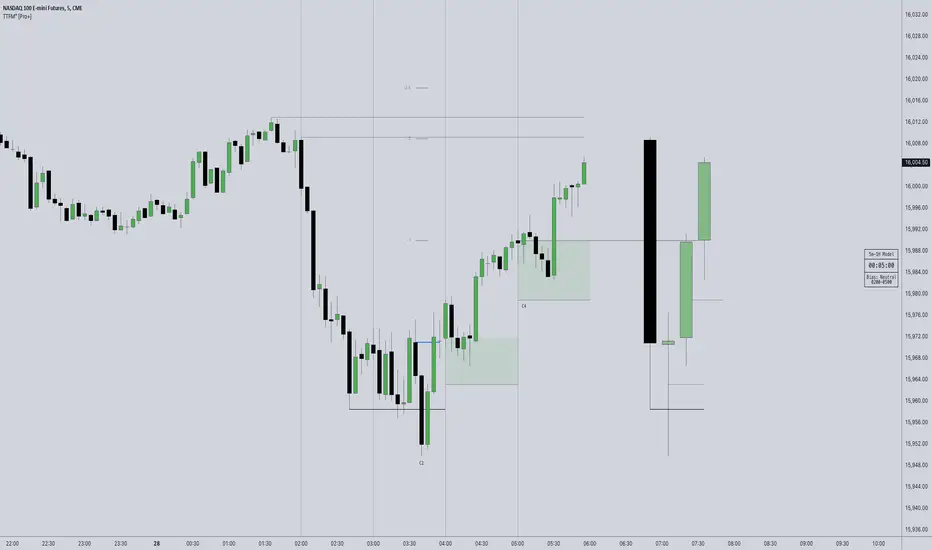
Crafted with TTrades, the Fractal Model empowers traders with a refined approach to Algorithmic Price Delivery. Specifically designed for those aiming to capitalize on expansive moves, this model anticipates momentum shifts, swing formations, orderflow continuations, as well as helping analysts highlight key areas to anticipate price deliveries.
Description:
The Fractal Model° is rooted in the cyclical nature of price movements, where price alternates between large and small ranges. Expansion occurs when price moves consistently in one direction with momentum. By combining higher Timeframe closures with the confirmation of the change in state of delivery (CISD) on the lower Timeframe, the model reveals moments when expansion is poised to occur.
Thanks to TTrades' extensive research and years of studying these price behaviors, the Fractal Model° is a powerful, adaptive tool that seamlessly adjusts to any asset, market condition, or Timeframe, translating complex price action insights into an intuitive and responsive system.
The TTrades Fractal Model remains stable and non-repainting, offering traders reliable, unchanged levels within the given Time period. This tool is meticulously designed to support analysts focus on price action and dynamically adapt with each new Time period.
Key Features:
Custom History: Control the depth of your historical view by selecting the number of previous setups you’d like to analyze on your chart, from the current setup only (0) to a history of up to 40 setups. This feature allows you to tailor the chart to your specific charting style, whether you prefer to see past setups or the current view only.
Fractal Timeframe Pairings: This indicator enables users to observe and analyze lower Timeframe (LTF) movements within the structure of a higher Timeframe (HTF) candle. By examining LTF price action inside each HTF candle, analysts can gain insight into micro trends, structure shifts, and key entry points that may not be visible on the higher Timeframe alone. This approach provides a layered perspective, allowing analysts to closely monitoring how the LTF movements unfold within the overarching HTF context.
For a more dynamic and hands-off user experience, the Automatic feature autonomously adjusts the higher Timeframe pairing based the current chart Timeframe, ensuring accurate alignment with the Fractal Model, according to TTrades and his studies.
Bias Selection: This feature allows analysts complete control over bias and setup detection, allowing one to view bullish or bearish formations exclusively, or opt for a neutral bias to monitor both directions. Easily toggle the bias filter on Fractal Model to align with your higher Timeframe market draw.
Indicator Notice for Timeframe Pairing Limitations: This indicator supports Timeframe pairings (e.g., 5m-1H, 15m-4H). If you select a timeframe, grater than the lower Timeframe (LTF) view (e.g., viewing a 15m chart when 5m-1H is enabled), the indicator will display an warning message within the table. Although the higher Timeframe (HTF) candle plotting will remain visible, note that the LTF’s CISD and associated projections will not render in this view.
Customizable Time Filters: Further synchronize Time and price studies by selecting up to three custom Time windows, filtering model formations that fall outside these specified ranges. This provides clarity and focus on relevant price action signatures within defined Time windows, at the discretion of the analyst.
Higher Time Frame Candles (PO3): The Fractal Model° integrates the HTF Power of Three framework, enabling traders to visualize and spot critical turning points live. By incorporating this structure, traders can observe key phases of price delivery and market transitions on lower Timeframes, while monitoring higher Timeframe candle development.
Info Table: Display a customizable information table that includes key details such as timeframe pairing, Time until the next higher Timeframe candle close, analyst bias, and applied Time filter preferences. Options for size, location, and border give analysts full control over the table’s appearance on the chart.
TTrades Framework Customization :
TTFM Lables (C2/C3/C4): When a setup remains valid, the label will display in gray, signifying stable conditions for the setup.
If the setup fails—defined by price returning to the initial high or low without forming a higher Timeframes swing point—the indicator will stop plotting projections, Equilibrium (EQ), Liquidity Sweep, and the T-spot. In this case, the labels for key points (C2, C3, C4) will remain on the chart but turn red, clearly indicating the failure of the setup.
If the setup does not fail within the next higher Timeframes candle, which defines the setup’s formation, the label will turn orange. This orange color signals potential consolidation, or slowdown, suggesting that the market may enter a range or pause in trend movement within the setup.
Candle 1 Liquidity: Highlight important liquidity levels at each swing point with horizontal rays, marking sweeps of liquidity and potential reversals.
Change in State of Delivery (CISD): Mark the series of candles making up significant highs or lows. A close beyond the opening price signals a change from bullish to bearish or vice versa, confirming a trend reversal.
Candle Equilibrium: Indicates 50% levels of higher time frame ranges, displaying discount and premium zones that provide additional context for potential entries and exits.
T-Spot Identification: The T-Spot marks anticipated points of the higher Timeframe candles where price wicks are expected to form, based on TTrades’ refined analysis and methodology. This level is invaluable for identifying high-probability reversal or continuation points within lower Timeframes, remaining aligned with the higher Timeframe narrative.
Projections: Leverage projected levels based on the shifts in delivery as per TTrades’ analysis. These user-defined levels serve as future points of interest for price to redeliver, rebalance, and exhaust. Analysts can add, or remove, desired projection levels – default projections being .
Formation Liquidity: Identify previous candles' highs and lows as critical liquidity points appertaining to the current developing formation. These zones are marked to provide easy visualization of engineered liquidity pools, serving as key reference points for future price action.
Fully Automated Framework: all these components, when put together in the Fractal Model° , yield TTrades' fully automated system. Each component is customizable to the analyst's liking to match their unique visual preferences and model Timeframes.
Usage Guidance:
Add Fractal Model (TTrades) to your TradingView chart.
Select your preferred Time pairings, model history, Time filers.
Automate your analysis process with Fractal Model (TTrades) and leverage it into your existing strategies to fine-tune your view through TTrades' lens.
Terms and Conditions
Our charting tools are products provided for informational and educational purposes only and do not constitute financial, investment, or trading advice. Our charting tools are not designed to predict market movements or provide specific recommendations. Users should be aware that past performance is not indicative of future results and should not be relied upon for making financial decisions. By using our charting tools, the purchaser agrees that the seller and the creator are not responsible for any decisions made based on the information provided by these charting tools. The purchaser assumes full responsibility and liability for any actions taken and the consequences thereof, including any loss of money or investments that may occur as a result of using these products. Hence, by purchasing these charting tools, the customer accepts and acknowledges that the seller and the creator are not liable nor responsible for any unwanted outcome that arises from the development, the sale, or the use of these products. Finally, the purchaser indemnifies the seller from any and all liability. If the purchaser was invited through the Friends and Family Program, they acknowledge that the provided discount code only applies to the first initial purchase of the Toodegrees Premium Suite subscription. The purchaser is therefore responsible for cancelling – or requesting to cancel – their subscription in the event that they do not wish to continue using the product at full retail price. If the purchaser no longer wishes to use the products, they must unsubscribe from the membership service, if applicable. We hold no reimbursement, refund, or chargeback policy. Once these Terms and Conditions are accepted by the Customer, before purchase, no reimbursements, refunds or chargebacks will be provided under any circumstances.
By continuing to use these charting tools, the user acknowledges and agrees to the Terms and Conditions outlined in this legal disclaimer.
HTF Power of Three° [Pro+] by toodegrees Description:
Power of Three ( PO3 ) is one of the many concepts introduced by the Inner Circle Trader , and inspired by Larry Williams .
The PO3 represents a three staged Smart Money campaign: Accumulation , Manipulation , and Distribution ( AMD ).
This tool helps to build narrative, as well as spotting important institutional levels.
ICT traders assume that this pattern represents how any candle is built.
“ This is applicable to every time measurement, as long as you have a beginning time, the highest value, the lowest value, and an ending in terms of measuring time. ”
Consider the development of a Bullish Candle over Time:
– Candle Open (initial value price, prior to dynamic imbalance)
– Accumulation of longs around the opening price
– Manipulation where short liquidity is engineered and long liquidity is neutralized
– Range Expansion (dynamic price imbalance)
– Distribution pairing long exits with pending buy interest
– Candle Close (ending value price, post dynamic imbalance)
The same goes for the development of Bearish Candles, in reverse.
Indicator Features:
The HTF Power of Three° Pro+ Indicator allows to monitor the selected Higher Timeframe Candles in real time:
– Follow HTF Candle development Live
– Plot unlimited HTF Candles on the current resolution
– Use NY Midnight time as the Candle Open on Daily and Weekly timeframes
– Spot HTF PD Arrays while on a lower timeframe
– See where the HTF Open, High, and Low are in the current lower resolution with high precision
– Know when the HTF candle is supposed to Close by monitoring its own countdown (below 1D)
– Note previous HTF Low to High ranges to gain a deeper understanding of LTF market profiles
Additional Features:
– Choose between Candles and Bars to display your HTF PO3s
– Hover on the open and close of past HTF candles to see their OHLC and Range values
– Resize and offset HTF candles to your liking
– Stack multiple instances on the indicator to show multiple higher timeframes at once on the same layout
– Backtest strategies with two (or more) timeframes on one chart
– Study and backtest PO3 in Replay Mode with ease
– Trade PO3 with confidence without needing multiple layouts
Indicator In Action:
To Get Access, and Level Up see the Author's Instructions below!
This indicator is available only on the TradingView platform.
⚠️ Intellectual Property Rights ⚠️
While this tool's base concepts are public, its interpretation, code, and presentation are protected intellectual property. Unauthorized copying or distribution is prohibited.
⚠️ Terms and Conditions ⚠️
This financial tool is for educational purposes only and not financial advice. Users assume responsibility for decisions made based on the tool's information. Past performance doesn't guarantee future results. By using this tool, users agree to these terms. OHLC Statistical Mapping [Pro+] (Joshuuu) Description:
Dive into the intricate world of candlestick analysis with the OHLC Statistical Mapping Pro+! This collaboration with Joshuuu offers a closer look into the historical data of specific candles within an analyst’s chosen timeframe, providing insights for future time and price delivery. Incorporate this interactive tool into your Tradingview templates and revolutionize your strategies with data. This advanced indicator goes beyond conventional OHLC representation, incorporating the principles of Inner Circle Trader (ICT) to explore accumulation, manipulation, and distribution candle-by-candle.
ICT traders identify manipulation as the wick opposing to the candle’s close. Analysts can observe manipulation legs seen as a movement to trap market participants in the "wrong" direction, to anticipate a candle's distribution.
When price distributes, it expands for higher or lower prices. Analysts can therefore note distribution levels for a draw on liquidity, retracement, or reversal.
These levels will provide important information about orderflow when price trades through them and the sequence in which the delivery occurs.
Additionally, to amplify the price mapping, this tool plots the average Time at which its manipulation and distribution phases should complete. This feature allows traders to utilize historical Timings in conjunction with the price levels of manipulation and distribution.
As with any historical data driven tool, analysts should not expect past behaviour to match future performance. This tool was created with a data driven edge to bring attention to when candles are likely to turn after their manipulations, or retrace after completing set distributions.
Key Features:
Average Range Precision: Visualize candlestick data through a sophisticated line and label-based format, facilitating the identification of your manipulation, distribution, and time pivots. Enhance your comprehension of market volatility by graphing the average range of your selected candle timeframe. This metric acts as a compass, steering you towards potential support and resistance areas.
Tailored Timeframe Selection: Tailor your analysis by choosing a specific time frame that aligns with your trading strategy, enabling a focused exploration of the candle’s manipulation, distribution, and time in which both levels are hit.
Real-time Information Flow: Monitor market developments with instantaneous updates on candlestick statistics. Each candle updates the script with latest OHLC information providing continuous historical data computations, even on timeframes sub 1 minute.
Historical Mapping:
Easily backtest previous mappings by enabling the historical mapping feature. This feature allows traders to revisit and analyze past market scenarios, offering a valuable tool for refining and validating trading strategies. Choose to show historical labels or remove them, giving ultimate flexibility for journaling.
User-Intuitive Interface: Navigate effortlessly through the tool's interface, designed to accommodate advanced traders with keen passion for data driven precision. Effortlessly customize the display settings to match your preferences, ensuring a seamless and personalized experience.
Usage Guidance:
Add OHLC Statistical Mapping Pro to your Tradingview chart.
Choose up to 5 timeframes for the mapping to plot on your chart, be sure to adjust your style and visual preferences to differentiate the timeframes’ levels.
Observe how calculated manipulation, distributions, and delivery times align together with predetermined analysis.
Leverage this information with other models and insights to create a stronger narrative for your analysis
These tools are available ONLY on the TradingView platform.
Terms and Conditions
Our charting tools are products provided for informational and educational purposes only and do not constitute financial, investment, or trading advice. Our charting tools are not designed to predict market movements or provide specific recommendations. Users should be aware that past performance is not indicative of future results and should not be relied upon for making financial decisions. By using our charting tools, the purchaser agrees that the seller and the creator are not responsible for any decisions made based on the information provided by these charting tools. The purchaser assumes full responsibility and liability for any actions taken and the consequences thereof, including any loss of money or investments that may occur as a result of using these products. Hence, by purchasing these charting tools, the customer accepts and acknowledges that the seller and the creator are not liable nor responsible for any unwanted outcome that arises from the development, the sale, or the use of these products. Finally, the purchaser indemnifies the seller from any and all liability. If the purchaser was invited through the Friends and Family Program, they acknowledge that the provided discount code only applies to the first initial purchase of the Toodegrees Premium Suite subscription. The purchaser is therefore responsible for cancelling – or requesting to cancel – their subscription in the event that they do not wish to continue using the product at full retail price. If the purchaser no longer wishes to use the products, they must unsubscribe from the membership service, if applicable. We hold no reimbursement, refund, or chargeback policy. Once these Terms and Conditions are accepted by the Customer, before purchase, no reimbursements, refunds or chargebacks will be provided under any circumstances.
By continuing to use these charting tools, the user acknowledges and agrees to the Terms and Conditions outlined in this legal disclaimer.
Forever Model [Pro+] (Sniper) Introduction
Forever Model (Sniper) is a clean, structured framework for visualizing internal liquidity to external liquidity rotations. It identifies shifts in market delivery by combining internal liquidity zones (Fair Value Gaps), divergence between correlated markets (Smart Money Technique), and lower timeframe orderflow changes (Orderblocks).
Designed for repeatability, the model helps analysts build confidence through familiarity, not complexity.
Rather than attempting to forecast direction, this model focuses on recognizing recurring patterns in delivery behavior across Timeframes. It presents a structured visual logic that can support manual analysis, with the aid of alerts that prompt analysts to investigate and validate potential price rotations.
The model is non-repainting, thoughtfully built to highlight past rotations once formed. It offers flexibility across assets and Timeframes, adapting to analysts' preferences while remaining consistent in its components.
Description
The model is organized into a three-part sequence. These three conditions form the visual foundation of the model. All parameters can be customized to match your preferred timeframe, session, and market:
Internal Range Liquidity Tag (IRL)
Price must interact with a defined internal inefficiency—typically a Fair Value Gap (FVG), which is an area between a three candle structure where price moves rapidly, leaving an imbalance that may later be revisited to be filled for efficiency.
Smart Money Technique Divergence Detected (SMT)
SMT transpires as a crack in correlation between two assets – this divergence is used to indicate potential shifts in price delivery.
SMT can be observed between two correlated assets, where one makes a lower low while the other holds a higher low (or conversely, one makes a higher high while the other forms a lower high).
Similarly, SMT can also occur between inverse correlated assets, where one makes a lower low while the other holds a lower high (or conversely, one makes a higher high while the other forms a higher low).
Change in State of Delivery (CISD)
After SMT occurs, the model identifies a CISD—a strong close engulfing the body of a previous directional candle that sweeps a short-term high or low. This suggests that price may be shifting from one delivery regime to another. The candle is labelled as an Orderblock (OB) candidate, with optional projected measures for better range of opportunity estimation.
Key Features
Model History Control
Controls how many past model formations appear on the chart, with a maximum of 40. Analysts may use shorter history for live charting or increase the count when studying past performance or recurring conditions.
When History is equal to 0, it will only show only live models in development, or nothing if no models are currently active.
Note: historical invalidated rotations are visualized through small markers, and may not display the model's components unless reviewed in Replay Mode. This mechanism keeps the chart clean, and allows the analyst to focus on the confirmed rotations.
Directional Bias Filter
Filters whether the model shows formations in only one direction or both. For example, selecting “Bullish” displays only internal range zones and divergence setups that meet criteria for upside movement. This feature is crucial for allowing analysts to align with higher Timeframe bias or studying unidirectional structures.
SMT Pair Input
The model compares your active chart with a second asset to detect SMT Divergence. You may manually enter a symbol (e.g., ES1!, BTCUSD, NZDUSD) or use Automatic SMT Pair Detection , which selects the most relevant correlated market. Inverse SMT inverts the logic, useful for negatively correlated pairs (e.g., gold vs dollar).
For example, although the Automatic SMT Pair Detection for CME_MINI:NQ1! is CME_MINI:ES1! , one may decide to use a leading stock in the NASDAQ such as NASDAQ:NVDA :
Timeframe Alignment
Defines which higher Timeframe the IRL is drawn from, and which lower Timeframe is used to evaluate the Model's conditions. These Timeframe Alignments can be selected individually to only showcase a specific combination of IRL and LTF Conditions; for a more dynamic approach, the "Automatic" option adjusts these pairings based on the current chart Timeframe. By selecting the "Custom" option, analysts can define and monitor their own preferred Timeframe Alignment.
Example: 5m Conditions ➞ 1H IRL vs. 4H Conditions ➞ Weekly IRL
Fair Value Gap (FVG) Visualization
Fair Value Gaps are areas where price moved quickly between two candles without overlap—these areas represent the IRL of the model, and are often revisited before continuing. Optionally, the analyst can decide to showcase the Consequent Encroachment (CE), the midpoint where price begins to fill the imbalance. Further, the analyst can maintain a cleaner chart by only showing FVG where SMT occurs, substantially limiting the number of drawings on the chart.
SMT Visualization
Draws visual lines connecting SMT points between the HTF reference points of the current chart's asset, and the SMT Pair asset. Helps analysts confirm divergence location and relationship at a glance, especially when reviewing multiple correlated pairs.
Liquidity Sweep Visualization
Most recent short-term liquidity swept, which resulted in a CISD. Marking this liquidity pool—a high or low that has been taken out—provides context and can give additional insight to evaluate the current market rotation.
Orderblock + Projections (OB)
When a CISD is recognized, an OB candidate is plotted. Projections from the OB can be displayed at customizable distances, serving as measurements for better range of opportunity estimation.
External Range Liquidity (ERL)
External Range Liquidity refers to price levels that sit beyond internal structures—typically local highs or lows that may be revisited after a retracement, for continuation.
Session Filters + Timezone Control
Define up to four time blocks (e.g., London Open, NY AM, PM session, Asia) for when the model is active. Timezones are fully customizable, supporting global use cases and precise filtering of formations to sessions with expected volume or cleaner structure.
Information Table
A compact, floating panel is available to display key model parameters in real time: Timeframe Alignment, Bias Direction, Active SMT Pair, Time Filter Conditions, Date.
This feature provides immediate context under which the model is operating — especially useful during active chart review or multi-pair monitoring. The table can be repositioned, resized, or disabled entirely depending on visual preference.
Model Markers & Backtest Support
The model includes a visual marker system to support chart review and backtesting. These overlays provide reference points for past structure, showcasing the following:
Reaching an OB Projection after revisiting the OB
Reaching the External Range Liquidity after revisiting the OB
Reaching an OB Projection without revisiting the OB
Reaching the External Range Liquidity without revisiting the OB
Invalidating the detected OB
Fully Automated Framework: all these components, when put together in the Forever Model ($niper), yield a clean and simple approach to studying and observing market rotations, empowering analysts in seeing the market through $niper's point of view. Each component is customizable to the analyst's liking to match their unique visual and technical preferences.
Usage Guidance:
Add Forever Model ($niper) to your TradingView chart.
Select your preferred SMT Pair, Timeframe Alignments, Model Style, and Time Filters.
Automate your analysis process with Forever Model (Sniper) and leverage it into your existing strategies to fine-tune your view through Sniper's point of view.
Terms and Conditions
Our charting tools are products provided for informational and educational purposes only and do not constitute financial, investment, or trading advice. Our charting tools are not designed to predict market movements or provide specific recommendations. Users should be aware that past performance is not indicative of future results and should not be relied upon for making financial decisions. By using our charting tools, the purchaser agrees that the seller and the creator are not responsible for any decisions made based on the information provided by these charting tools. The purchaser assumes full responsibility and liability for any actions taken and the consequences thereof, including any loss of money or investments that may occur as a result of using these products. Hence, by purchasing these charting tools, the customer accepts and acknowledges that the seller and the creator are not liable nor responsible for any unwanted outcome that arises from the development, the sale, or the use of these products. Finally, the purchaser indemnifies the seller from any and all liability. If the purchaser was invited through the Friends and Family Program, they acknowledge that the provided discount code only applies to the first initial purchase of the Toodegrees Premium Suite subscription. The purchaser is therefore responsible for cancelling – or requesting to cancel – their subscription in the event that they do not wish to continue using the product at full retail price. If the purchaser no longer wishes to use the products, they must unsubscribe from the membership service, if applicable. We hold no reimbursement, refund, or chargeback policy. Once these Terms and Conditions are accepted by the Customer, before purchase, no reimbursements, refunds or chargebacks will be provided under any circumstances.
By continuing to use these charting tools, the user acknowledges and agrees to the Terms and Conditions outlined in this legal disclaimer.
Inverse Fair Value Gap [Pro+] Introduction
Inverse Fair Value Gap° is a fully customizable charting tool built to track inversion fair value gap logic that occur after displacement events—specifically when Fair Value Gaps (FVGs) are closed through, and effectively flipping their original state. The tool is inspired by Inner Circle Trader (ICT) concepts, offering a clean visual interface to support traders studying price behaviour after liquidity sweeps, FVG closures, and highlighting mechanical swings targets.
This indicator does not draw zones or suggest direction. It operates entirely on confirmed price events and produces logic-bound visuals designed for traders who already understand IFVG-based reasoning and seek visual consistency across sessions, Timeframe on any instrument.
Key Terms and Definitions
Swing High / Swing Low: A swing high is a local price peak with lower highs on either side. A swing low is a local trough with higher lows on either side. These are used to detect where liquidity may rest and are required for confirming the initial raid condition in the IFVG model.
Liquidity Raid: This occurs when price trades through a prior swing high or low, effectively “sweeping” a level where orders may be clustered around. The raid is a required precursor to inversion logic in this model. The tool will not evaluate a potential Fair Value Gap or Inversion Fair Value Gap unless a swing high or low has been taken first.
Fair Value Gap (FVG): A Fair Value Gap is a price imbalance that occurs when a strong move leaves a gap between candles—specifically, when the high of one candle and the low of a later candle do not overlap. FVGs often emerge during displacement and are commonly studied as inefficiencies within a price leg.
Inversion Fair Value Gap: An inversion happens when price fully closes through an existing Fair Value Gap that raided liquidity, suggesting the original imbalance rebalanced, and looks to reverse its original role. For example, when a bearish FVG is closed above after raiding a swing low, it may present a shift in orderflow (bullish inversion). The tool recognizes IFVGs as “inverted” after a candle body candle closes through the gap post raid.
Displacement: A strong directional price move, typically with momentum, that leaves a Fair Value Gap behind. Displacement is important in inversion logic, as it creates the context and confidence in comparing and contrasting FVGs and Inversions for obvious flips in market behaviour.
IFVG Line: Once inversion occurs, the indicator draws a single horizontal array on the candle's close. It marks the start of model activation. This is not a prediction level or a support/resistance area, as it merely serves as a reference for when model logic is sequentially active.
Opposing Swing: The swing high or low opposite the one that was swept during the initial raid. This becomes the model’s first target for mechanical delivery and is automatically drawn once the IFVG line is plotted. When price reaches this swing, the model has reached its mechanical objective and could offer opportunities for further continuation to additional liquidity pools if orderflow continues to be present.
Invalidation: The Inversion Fair Value Gap is considered invalid in one of two scenarios, which the user can toggle individually: a body print back above/below the inversion in bearish/bullish conditions, or trading above/below the most recent swing high/low after the liquidity raid. The IFVG line will continue extending until the setup is invalidated by the chosen toggle, or when the Opposing Swing is reached.
Consequent Encroachment (CE): The midpoint (50%) of the FVG or IFVG. This line can be optionally displayed for users who use the midpoint of imbalances for reference of imbalance respect. It is not required by the model’s internal logic but may assist with discretionary interpretation.
Description
At its core, IFVG° follows a structured three-step logic sequence: a FVG is created, liquidity is taken, and the Fair Value Gap (FVG) inside of the leg of the raid is closed through, signally a potential orderflow shift. Once inversion is confirmed, an IFVG line is plotted at the close of the candle that caused the inversion, making it the structural anchor for the model.
The tool does not account for partial fills or candle wicks for FVGs or IFVGs. Only full-body closures through a qualifying FVG are recognized. When this occurs, a bullish or bearish inversion is plotted and the model becomes active. From there, the opposing swing (the unswept high or low from the displacement leg) is automatically drawn as the target for the model.
The model remains active until either the opposing swing is tagged (completion) or Invalidation Condition is triggered (close through IFVG, or price violating the liquidity raid swing). Upon invalidation, the IFVG line turns gray, signaling that the structure is no longer valid for ongoing tracking.
Key Features
The Bias allows traders to define whether to track bullish inversions (closing above bearish FVGs), bearish inversions (closing below bullish FVGs), or neutral to see both. This allows isolated directional focus as well as the ability to display all models.
The Liquidity Timeframe defines the Timeframe for swing highs and lows that are identified for the required liquidity raid. The Chart mode allows analysts to use the active chart Timeframe. Auto enables a pre-defined Timeframe Alignment, explained inside of the setting tooltip. Custom allows for user-defined Timeframe alignment, which is helpful when syncing with specific higher-Timeframe structures. Session allows the user to use session highs and lows for the liquidity raid. Observe the difference in the IFVG' model activations based on different Liquidity Timeframe configurations:
Chart:
Automatic:
Custom (4H):
Session:
The FVG Filter Timeframe requires the IFVG setup to trade into a FVG before qualifying the raid filter. For instance, setting this to 4H ensures that only setups that form within a 4-hour FVG. This gives analysts an additional filter to qualify the start of the mechanical model.
The Session Filter enables traders to define up to four specific Time blocks when the model is permitted to trigger. The Macros Only toggle filters setups further by limiting activation to the first and last 10 minutes of each hour, a filter inspired for intraday traders and scalpers.
The Invalidation Condition determines when a IFVG is considered no longer valid. The Close option will maintain the inversion as active until price prints a body past the IFVG. Swing will maintain the inversion as active until the most recent swing from the liquidity raid is traded through; in this case a warning icon will appear once price prints a candle body past the IFVG.
Model Style includes customizable controls for the IFVG line, the opposing swing marker, and invalidated states. Label appearance, line styles, and extension behaviour are fully user-controlled. Traders can also enable the Consequent Encroachment (CE) line, which marks the 50% midpoint of the FVG.
An Info Table is available to display the charts Timeframe, current model state, toggled bias, active Timeframes, asset, and Time filter. Its position is fully customizable and can be moved to match chart preferences.
How Traders Can Use the Indicator Effectively
IFVG° is not meant to identify trade signals, entries, or exits. It is best used as a visual tracker and confluence for structure-based delivery. The tool excels as a companion for:
Journaling and reviewing IFVG-based setups across Timeframes and sessions
Studying structural completion or invalidation behaviour
Tracking delayed deliveries and retracement-based logic
Traders using the tool should be familiar with FVG formations, inversion criterias, and the importance of orderflow once an opposing swing is reached.
Usage Guidance
Add the IFVG° to a TradingView chart. This is a fractal script and can be applied across any Timeframe or asset pairing.
Use the IFVG line to track inversion structure, monitor when inversions are created and negated, and reference the opposing swing to determine whether structural delivery has completed.
Use the IFVG in combination with your own discretion and narrative to assess when the model has flipped, held, or broken.
Terms and Conditions
Our charting tools are products provided for informational and educational purposes only and do not constitute financial, investment, or trading advice. Our charting tools are not designed to predict market movements or provide specific recommendations. Users should be aware that past performance is not indicative of future results and should not be relied upon for making financial decisions. By using our charting tools, the purchaser agrees that the seller and the creator are not responsible for any decisions made based on the information provided by these charting tools. The purchaser assumes full responsibility and liability for any actions taken and the consequences thereof, including any loss of money or investments that may occur as a result of using these products. Hence, by purchasing these charting tools, the customer accepts and acknowledges that the seller and the creator are not liable nor responsible for any unwanted outcome that arises from the development, the sale, or the use of these products. Finally, the purchaser indemnifies the seller from any and all liability. If the purchaser was invited through the Friends and Family Program, they acknowledge that the provided discount code only applies to the first initial purchase of any Toodegrees product. The purchaser is therefore responsible for cancelling – or requesting to cancel – their subscription in the event that they do not wish to continue using the product at full retail price. If the purchaser no longer wishes to use the products, they must unsubscribe from the membership service, if applicable. We hold no reimbursement, refund, or chargeback policy. Once these Terms and Conditions are accepted by the Customer, before purchase, no reimbursements, refunds or chargebacks will be provided under any circumstances.
By continuing to use these charting tools, the user acknowledges and agrees to the Terms and Conditions outlined in this legal disclaimer.
Session Statistical Mapping° [Pro+] (Joshuuu) Introduction:
Dive into the dynamic world of statistical market analysis with Session Statistical Mapping Pro+, an advanced tool designed for intraday traders of all asset classes.
Description:
This indicator offers a detailed algorithmic statistical measurement of Time and price, integrating the principles of Inner Circle Trader (ICT) to analyze the market behaviours such as Manipulation, and Distribution. This tool supercharges your trading strategies with data-driven insights.
ICT traders classify manipulation as a movement to trap market participants in the "wrong" direction. This allows analysts to anticipate the intended real direction of the distribution phase.
On the other hand, when price distributes, it's looking to expand for higher – or lower – prices. Analysts can therefore note distribution levels for a draw on liquidity, retracement, or reversal.
These levels and the Time at which they are reached during the selected session, will provide important information about orderflow when price trades through them and the sequence in which the delivery occurs.
Additionally, to amplify the price mapping, this tool plots the average Time at which its manipulation and distribution phases should complete. This feature allows traders to utilize historical Timings in conjunction with the price levels of manipulation and distribution.
As with any historical data driven tool, analysts should not expect past behaviour to match future performance. This tool was created with a data driven edge to bring attention to when sessions are likely to turn after their manipulations, or retrace after completing set distributions.
Key Features:
Algorithmic Measurement of Price: Leverage algorithmic theory to measure price movements with precision. This tool calculates average session manipulation and distribution price levels, providing traders with actionable insights based on historical data – key manipulation and distribution levels.
Algorithmic Measurement of Time: Utilize algorithmic theory to measure time-based movements within specific sessions. This tool calculates the projected average Time at which the manipulation and distribution phases are completed during a given session. This feature enhances traders' ability to interpret market movements and align their strategies with Time data.
Four Sessions Times: Customize up to four Time ranges to focus on specific trading sessions, such as the European, US, or Asian market sessions. This allows traders to align their analysis with the operational hours of major market participants, capturing the most relevant price movements. Traders can also create unique sessions based on their trading Time to study market behaviour when they usually operate in the markets – unlocking a level of understanding towards their personal backtested model and strategies.
Flexible Calculation: The sample size of the sessions can be set to a specific number – the default is 1000. This allows traders to adjust the depth of historical data used in their analysis, balancing detail and performance.
Further Customization:
Custom Appearance: Adjust the style of session lines with options like dotted, solid, and various colors. This helps traders visually distinguish between different types of market activities (e.g., Open, Manipulation, Distribution) on their charts.
Lookback Periods: Option to show available lookback periods for a deeper historical analysis, providing context and historical benchmarks for current market conditions.
Extended Visualization: Pre-extend lines until session close for better visualization of market phases. This helps traders see the continuation of trends and market behaviours beyond the immediate session.
Clean Chart Layout: Options to delete old labels and abbreviate labels maintain a clean and organized chart, enhancing readability and focus.
Conclusion
By incorporating algorithmic theory Time and price measurements, historical data insights, and the principles of Inner Circle Trader (ICT), this indicator offers a comprehensive approach to understanding market behaviour. Whether you're analyzing price patterns, timing market movements, or combining both, Session Statistical Mapping Pro+ equips you with the potential roadmap of an asset, allowing you to navigate the complexities of the market’s volatility.
Usage Guidance:
Add Session Statistical Mapping Pro to your Tradingview chart.
Choose up to 4 sessions for the mapping to plot on your chart, be sure to adjust your style and visual preferences to differentiate the sessions’ levels.
Observe how calculated manipulation, distributions, and delivery times align together with predetermined analysis.
Leverage this information with other models and insights to create a stronger narrative for your analysis.
These tools are available ONLY on the TradingView platform.
Terms and Conditions
Our charting tools are products provided for informational and educational purposes only and do not constitute financial, investment, or trading advice. Our charting tools are not designed to predict market movements or provide specific recommendations. Users should be aware that past performance is not indicative of future results and should not be relied upon for making financial decisions. By using our charting tools, the purchaser agrees that the seller and the creator are not responsible for any decisions made based on the information provided by these charting tools. The purchaser assumes full responsibility and liability for any actions taken and the consequences thereof, including any loss of money or investments that may occur as a result of using these products. Hence, by purchasing these charting tools, the customer accepts and acknowledges that the seller and the creator are not liable nor responsible for any unwanted outcome that arises from the development, the sale, or the use of these products. Finally, the purchaser indemnifies the seller from any and all liability. If the purchaser was invited through the Friends and Family Program, they acknowledge that the provided discount code only applies to the first initial purchase of the Toodegrees Premium Suite subscription. The purchaser is therefore responsible for cancelling – or requesting to cancel – their subscription in the event that they do not wish to continue using the product at full retail price. If the purchaser no longer wishes to use the products, they must unsubscribe from the membership service, if applicable. We hold no reimbursement, refund, or chargeback policy. Once these Terms and Conditions are accepted by the Customer, before purchase, no reimbursements, refunds or chargebacks will be provided under any circumstances.
By continuing to use these charting tools, the user acknowledges and agrees to the Terms and Conditions outlined in this legal disclaimer.
Average Range Levels [Pro+] Description:
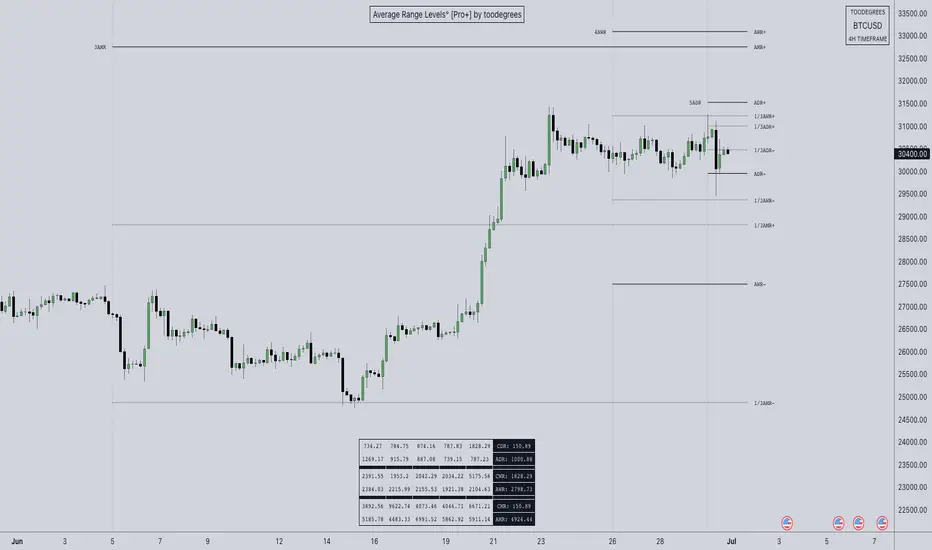
The Average Range Levels builds on the concepts of ADR projections showcased in its lite version.
Average Daily Range (ADR) is a common metric used to measure volatility in an asset. It calculates the average difference between the highest and lowest price over a time interval – normally five days.
The Inner Circle Trader teaches the importance of this metric from an algorithmic point of view; in particular the 1/3ADR price level is deemed to be a threshold used to determine the area at which a Judas Swing – false move to trick market participants, protraction, manipulation – might exhaust.
Another key difference in the ICT-use of this metric compared to the classic approach is that the average range is calculated from New York midnight Time, rather than the daily candle's open.
This exact concept was upscaled to higher Timeframe fractals obtaining the Average Weekly Range (AWR) and the Average Monthly Range (AMR). The latter two metrics are anchored at the first Monday’s midnight (New York Time) of the respective interval – however they also have the option to be anchored at the True Week Open (Tuesday’s Daily Open) and True Month Open (Second Week Open).
It is crucial to remember that the elements of Time are key when it comes to interpreting how price action will, or won't, react to these levels: what Time of the day is it? what day of the week? what week of the month?
If one thinks about the Power of Three of a candle (Accumulation, Manipulation Distribution), it is highly unlikely that a Manipulation event will happen later in the candle’s development – seeing the 1/3ADR hold in London session or New York open, seeing the 1/3AWR hold on Tuesday or Wednesday, or seeing price race to the 1/3AMR early on in the month gives undeniable edge to an Analyst.
Apart from the 1/3 level seen from a Judas perspective, the opposing 1/3 level, and the full AR projections, are excellent algorithmic levels at which we will see orderflow or reactions worth studying. These can be take profit targets, reversal opportunities, pyramid entries, …
Last but not least, the tool is equipped with a Data Table. You have a clear narrative but you are unsure of when price will expand? Track the previous 5 ARs and the current Range for Daily, Weekly, and Monthly – the smaller the AR the higher the chance for an expansion, the larger the AR the higher the chance for a consolidation.
Tool Features:
Auto Color the drawings based on your chart’s background or choose your own
Decide whether to consider daily candles, or New York (00:00 to 00:00 NY Time) for the basis of the calculation
Show the last 10 Historical Levels
– See the AR Range, the AR price levels and 1/3AR price levels by hovering over the text labels
Plot the AR levels from their Time Anchor, or as offset markers on the side for a cleaner look
Show/Hide all elements individually
In the Idea below, you can see how INDEX:BTCUSD hit the 1/3AMR level at the end of the second week of the month. The subsequent rejection from this level suggests we might have witnessed a Judas Swing, hence we flip to bullish bias.
In the more recent AWR levels, we can see how price did not touch any level until friday – this is a consolidation week with low probability setups. This was expected, if one looks at the precious two week's ranges and respective average ranges in the Data Table: both breached the AR value, due to to the great expansion higher.
Lastly for the ADR levels we can see how the Judas higher got beautifully stopped at the 1/3 level, and the full ADR level on the opposite side catches price while it falls.
To Get Access, and Level Up see the Author's Instructions below!
This indicator is available only on the TradingView platform.
⚠️ Intellectual Property Rights ⚠️
While this tool's base concepts are public, its interpretation, code, and presentation are protected intellectual property. Unauthorized copying or distribution is prohibited.
⚠️ Terms and Conditions ⚠️
This financial tool is for educational purposes only and not financial advice. Users assume responsibility for decisions made based on the tool's information. Past performance doesn't guarantee future results. By using this tool, users agree to these terms. London Intraday Protraction (Normal + Delayed) [Pro+] The London Intraday Protraction° is an automatic market profiling tool designed from ICT Time and price parameters projected for London Session studies:
Time:
Central Bank Dealers Range (CBDR)
Asian Range (AR)
London Session
Price:
Central Bank Dealers Range Size (CBDR)
Central Bank Dealers Range (CBDR) Standard Deviations
Asian Range Size (AR)
Protraction (fake move, trap)
This tool allows you to keep your attention dialled into the Session harnessing the concepts listed above through historical data (statistics + previous sessions), and live visuals.
This tool automatically annotates your CBDR and AR reference points, and prints range values in pips as a label above the CBDR and AR; it also projects the CBDR deviations encompassed in London's Time opportunity – up to three standard deviations.
The range values for the Time-based ranges, and price action are filtered into conditional statements as taught in the Core Content from the Inner Circle Trader (ICT).
There are three profile types:
1) Normal Protraction – the high/low of the Day is anticipated in early London Session.
2) Delayed Protraction – due to invalid Price Parameters (Range Sizes) the Protraction is expected in the later stages of the London Session (this protraction may, or may not be, the high/low of the Day).
3) Normal Protraction Negated – due to invalid Time Parameters, the Protraction is expected in the later stages of the London Session (this protraction may, or may not be, the high/low of the Day).
Notice the color coding of the specific scenarios, as it always repeats – it will aid pattern recognition.
The statistical table shows the total number of viewable London Sessions on chart; it provides the total number of filtered Normal Protraction Sessions, and Delayed Protractions Sessions. It also indicates a percentage of how many filtered conditions held true and provided clean price action or narrative.
The true power of this tool lies in its specific window of Time opportunity, and solid conditional logic provided by ICT's teachings; having the London Session analysis automated, allows you to focus on price, and bias, rather than drawing predetermined ICT parameters.
Additional Features:
Customizable Colors
Auto-adapting Colors
Customizable Stat Table Position
Customizable Stat Table Size
These tools are available ONLY on the TradingView platform.
Terms and Conditions
These charting tools are products provided for informational and educational purposes only and do not constitute financial, investment, or trading advice. They are not designed to predict market movements or provide specific recommendations. Users should be aware that past performance is not indicative of future results and should not be relied upon for making financial decisions. By using these tools, the purchaser agrees that the seller and the creator are not responsible for any decisions made based on the information provided by these charting tools. The purchaser assumes full responsibility and liability for any actions taken and the consequences thereof, including any loss of money or investments that may occur as a result of using these products. Hence, by purchasing these charting tools, the customer accepts and acknowledges that the seller and the creator are not liable nor responsible for any unwanted outcome that arises from the development, the sale, or the use of these products. Finally, the purchaser indemnifies the seller from any and all liability.
By continuing to use these financial tools, the user acknowledges and agrees to the terms outlined in this legal disclaimer. Automatic OTE (FX4LIVING) [Pro+] Description:
Unlock the precision of your trading endeavors with our cutting-edge Automatic OTE Fibonacci Tool. This advanced indicator not only simplifies the intricate world of Fibonacci retracements but also introduces a unique time-based anchoring feature.
Thanks to the Timeframe feature, analysts can anchor Fibonacci High and Low values to any selected timeframe. While many find Monthly, Weekly, Daily, 4H, and 1H ranges effective, our tool offers unparalleled flexibility, allowing custom Tradingview times for 90-minute candle ranges and other bespoke intervals.
In collaboration with FX4_LIVING, key levels are thoughtfully grouped for enhanced ease and organization. These include the High, Low, Equilibrium (EQ), and the Optimal Trade Entry (OTE).
Optimal Trade Entry is a concept taught by the Inner Circle Trader utilizing fibonacci retracements to gauge when price is considered in Premium or Discount. When price reaches 62% retracement of the anchored swings, price enters an area considered for an optimal trade entry.
This said, these levels can act as much more than a simple retracement tool, showing continuous levels that price refers back to based on Premium and Discount prices of the previous interval.
15s Chart + 15m Automatic OTE:
5m Chart + 4H Automatic OTE:
This tool provides analysts the flexibility to input various Fibonacci Levels, with default settings aligned to FX4_LIVING's Trading Models. The integrated data table offers a distilled view of price action, enabling easy tracking where price is trading compared to the previous selected interval in percentage – where the High and the Low represent 0% and 100% interchangeably. This feature allows you to quickly know where price is, even if you decide to hide the Fibonacci Levels.
Key Features:
Versatility Across Assets: Auto OTE Pro+ is meticulously designed for futures, forex, and bond markets, offering a comprehensive solution for a wide range of financial instruments.
Timeframe Customization: Auto OTE Pro+ allows users to anchor timeframes, providing analysts with the flexibility to explore various ranges.
Adaptive Table Colors: witness the data table adapt its colors when price approaches OTE levels, aligning seamlessly with Fibonacci levels.
Other Features:
Customize Fibonacci and Key Level Line Style.
Personalize Fibonacci and Key Level Line Color.
Adjust Fibonacci and Key Level Line Width.
Tailor Table Size and Location.
Usage Guidance:
Add Auto OTE to your Tradingview chart.
Observe where and when Fibonacci Levels are traded. Leverage this invaluable information to shape your narrative, whether you choose to explore internal range liquidity or capitalize on post-purge reversals.
Customize your desired Timeframe and Fibonacci Levels according to your preferences.
These tools are available ONLY on the TradingView platform.
Terms and Conditions
Our charting tools are products provided for informational and educational purposes only and do not constitute financial, investment, or trading advice. Our charting tools are not designed to predict market movements or provide specific recommendations. Users should be aware that past performance is not indicative of future results and should not be relied upon for making financial decisions. By using our charting tools, the purchaser agrees that the seller and the creator are not responsible for any decisions made based on the information provided by these charting tools. The purchaser assumes full responsibility and liability for any actions taken and the consequences thereof, including any loss of money or investments that may occur as a result of using these products. Hence, by purchasing these charting tools, the customer accepts and acknowledges that the seller and the creator are not liable nor responsible for any unwanted outcome that arises from the development, the sale, or the use of these products.
Finally, the purchaser indemnifies the seller from any and all liability. If the purchaser was invited through the Friends and Family Program, they acknowledge that the provided discount code only applies to the first initial purchase of the Toodegrees Premium Suite subscription. The purchaser is therefore responsible for cancelling – or requesting to cancel – their subscription in the event that they do not wish to continue using the product at full retail price. If the purchaser no longer wishes to use the products, they must unsubscribe from the membership service, if applicable. We hold no reimbursement, refund, or chargeback policy. Once these Terms and Conditions are accepted by the Customer, before purchase, no reimbursements, refunds or chargebacks will be provided under any circumstances.
By continuing to use these charting tools, the user acknowledges and agrees to the Terms and Conditions outlined in this legal disclaimer.
Seasonal Tendency° [Pro+] by toodegrees TRADINGVIEW IMAGE IS NOT DISPLAYING THE TOOL CORRECTLY, CHECK OUT THE IMAGES BELOW!
Description:
A Seasonal Tendency is a historical pattern or roadmap that reflects how price action has behaved in the past during specific time periods, usually on a monthly basis. It is not an absolute guarantee of future price movements, but rather a general rule of thumb to identify potential high-probability long-term trades. Seasonal tendencies can be used to analyze various pairs and asset classes, and when combined with the underlying market trends or conditions, they can help traders narrow down specific times of the year when big moves are more likely to occur.
Keep in mind that while these seasonal tendencies have been successfully compared with the Inner Circle Trader's go-to seasonal third-party provider and are based on sound statistical logic, their reliability is dependent on the data available on TradingView. This means that the accuracy and relevance of these tendencies may vary, but they still serve as valuable tools for identifying potential high-probability trading opportunities when used in conjunction with other market analysis techniques. Pay attention to the Years of Data used to determine the significance of the information for your trading hypotheses.
Tool Features:
Discover the power of our innovative tool that seamlessly integrates all available TradingView data to create a dynamic on-chart seasonal display:
– Monitor the 5, 10, 15, 30, and All Time Seasonal graphs with ease
– Effortlessly visualize and align the seasonal graphs with real-time prices for a holistic view
– Align the seasonal graph with the annual timeline, pinpointing precise moments for potential trading setups, keeping Months and Quarters in mind
– Read into the seasonality thanks to the Seasonal Lows and Highs Matrix
– Auto-detect the underlying Futures Contract's Asset Class
– Monitor the entire Asset Class' Seasonal Tendencies with a tailored Seasonal Lows and Highs Matrix
Find a Video Preview and the User Manual here .
Templates:
Dark Mode
Table+Overlay
Holy Seasonal
Collection of all Asset Classes for Commodity Futures in one place. Note: the number of dashboards depends on your Tradingview Plan.
To Get Access, and Level Up see the Author's Instructions below!
This indicator is available only on the TradingView platform.
⚠️ Intellectual Property Rights ⚠️
While this tool's base concepts are public, its interpretation, code, and presentation are protected intellectual property. Unauthorized copying or distribution is prohibited.
⚠️ Terms and Conditions ⚠️
This financial tool is for educational purposes only and not financial advice. Users assume responsibility for decisions made based on the tool's information. Past performance doesn't guarantee future results. By using this tool, users agree to these terms. Fractal Consolidations [Pro+] Introduction:
Fractal Consolidations Pro+ pushes the boundaries of Algorithmic Price Delivery Analysis. Tailored for traders seeking precision and efficiency to unlock hidden insights, this tool empowers you to dissect market Consolidations on your terms, live, in all asset classes.
What is a Fractal Consolidation?
Consolidations occur when price is trading in a range. Normally, Consolidation scripts use a static number of "lookback candles", checking whether price is continuously trading inside the highest and lowest price points of said Time window.
After years spent studying price action and numerous programming attempts, this tool succeeds in veering away from the lookback candle approach. This Consolidation script harnesses the delivery mechanisms and Time principles of the Interbank Price Delivery Algorithm (IPDA) to define Fractal Consolidations – solely based on a Timeframe Input used for context.
Description:
This concept was engineered around price delivery principles taught by the Inner Circle Trader (ICT). As per ICT, it's integral for an Analyst to understand the four phases of price delivery: Consolidation , Expansion , Retracement , and Reversal .
According to ICT, any market movement originates from a Consolidation, followed by an Expansion .
When Consolidation ranges begin to break and resting liquidity is available, cleaner Expansions will take place. This tool's value is to visually aid Analysts and save Time in finding Consolidations in live market conditions, to take advantage of Expansion moves.
CME_MINI:ES1! 15-Minute Consolidation setting up an Expansion move, on the 10 Minute Chart:
Fractal Consolidations Pro+ doesn't only assist in confirming Higher Timeframe trend continuations and exposing opportunities on Lower Timeframes. It's also designed for both advanced traders and new traders to save Time and energy in navigating choppy or rangebound environments.
CME_MINI:ES1! 30 Minute Consolidation forming Live, on the 5 Minute Chart:
By analyzing past price action, traders will find algorithmic signatures when Consolidations are taking place, therefore providing a clearer view of where and when price is likely to contract, continue consolidating, breakout, retrace, or reverse. A prominent signature to consider when using this script is ICT's Market Maker Buy/Sell Models. These signatures revolve around the engineering of Consolidations to manipulate price in a specific direction, to then reverse at the appropriate Time. Each stage of the Market Maker Model can be identified and taken advantage of using Fractal Consolidations.
CME_MINI:NQ1! shift of the Delivery Curve from a Sell Program to a Buy Program, Market Maker Buy Model
Key Features:
Tailored Timeframes: choose the Timeframe that suits your model. Whether you're a short-term enthusiast eyeing 1 Hour Consolidations or a long-term trend follower analyzing 4 Hour Consolidations, this tool gives you the freedom to choose.
FOREXCOM:EURUSD Fractal Consolidations on a 15 Minute Chart:
Auto-Timeframe Convenience: for those who prefer a more dynamic and adaptive approach, our Auto Timeframe feature effortlessly adjusts to the most relevant Timeframe, ensuring you stay on top of market consolidations without manually adjusting settings.
Consolidation Types: define consolidations as contractions of price based on either its wick range or its body range.
COMEX:GC1! 4 Hour Consolidation differences between Wick-based and Body-based on a 1 Hour Chart:
Filtering Methods: combine previous overlapping Consolidations, merging them into one uniform Consolidation. This feature is subject to repainting only while a larger Consolidation is forming , as smaller Consolidations are confirmed. However once established, the larger Consolidation will not repaint .
FOREXCOM:GBPUSD 15 Minute Consolidation Differences between Filter Consolidations ON and OFF:
IPDA Data Range Filtering: this feature gives the Analyst control for selective visibility of Consolidations in the IPDA Data Range Lookback . The Analyst can choose between 20, 40, and 60 days as per ICT teachings, or manually adjust through Override.
INDEX:BTCUSD IPDA40 Data Range vs. IPDA20 Data Range:
Extreme Float: this feature provides reference points when the price is outside the highest or lowest liquidity levels in the chosen IPDA Data Range Lookback. These Open Float Extremes offer critical insights when the market extends beyond the Lookback Consolidation Liquidity Levels . This feature helps identify liquidity extremes of interest that IPDA will consider, which is crucial for traders in understanding market movements beyond the IPDA Data Ranges.
INDEX:ETHUSD Extreme Float vs. Non-Extreme Float Liquidity:
IPDA Override: the Analyst can manually override the default settings of the IPDA Data Range Lookback, enabling more flexible and customized analysis of market data. This is particularly useful for focusing on recent price actions in Lower Timeframes (like viewing the last 3 days on a 1-minute timeframe) or for incorporating a broader data range in Higher Timeframes (like using 365 days to analyze Weekly Consolidations on a daily timeframe).
Liquidity Insight: gain a deeper understanding of market liquidity through customizable High Resistance Liquidity Run (HRLR) and Low Resistance Liquidity Run (LRLR) Consolidation colors. This feature helps distinguishing between HRLR (high resistance, delayed price movement) and LRLR (low resistance, smooth price movement) Consolidations, aiding in quick assessment of market liquidity types.
TVC:DXY Low Resistance vs. High Resistance Consolidation Liquidity Behaviour and Narrative:
Liquidity Raid Type: decide whether to categorize a Consolidation liquidity raid by a wick or body trading through a level.
CBOT:ZB1! Wick vs. Body Liquidity Raid Type:
Customizable User Interface: tailor the visual representation to align with your preferences. Personalize your trading experience by adjusting the colors of consolidation liquidity (highs and lows) and equilibrium, as well as line styles.
DTT Volatility Grid [Pro+] (NINE/ANARR) Introduction:
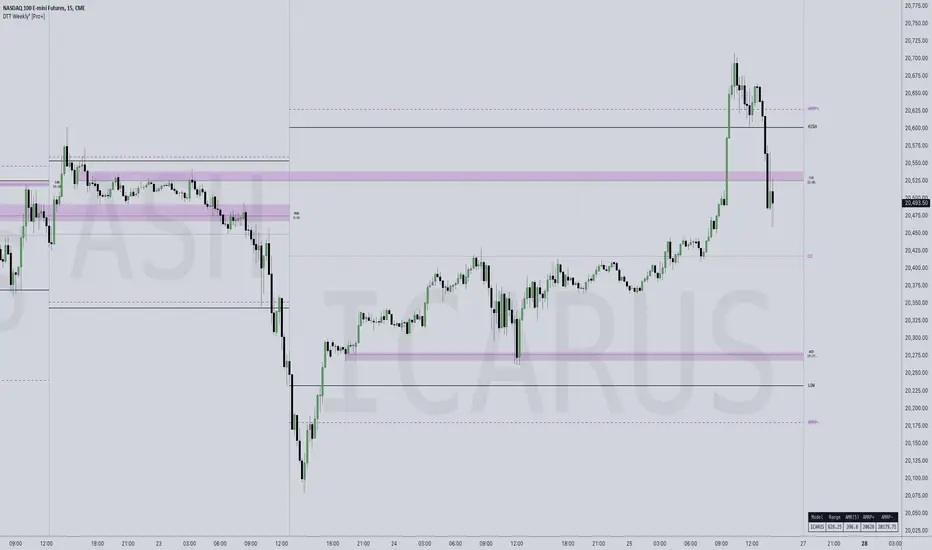
This tool is designed to automate the Digital Time Theory (DTT) framework created by Ivan and Anarr, and leverage the DTT Volatility Grid to navigate the advanced realm of Time-based statistical trading.
Description:
Built upon the proprietary Digital Time Theory (DTT), this script equips traders with an edge in analyzing Time and price-based market behaviour. It is designed for intraday traders of all asset classes, and breaks down the entire Daily range into Time Models and Inner Time Intervals. This tool is powered by data-driven insights, helping traders anticipate expansions, understand Time distortions, and assess market volatility at specific Times of the trading day.
Key Features:
Time-Based Models and Volatility Awareness: The indicator automatically populates the chart with DTT's Time Models. These Time Models, represented by specific Time Intervals, are engineered to highlight volatility injections within key sessions, offering traders clear insights into market dynamics and potential shifts.
Average Model Range Probability (AMRP): Know the average volatility expected for specific Time Models and use AMRP Levels (and Standard Deviation) to gauge the probability of a range break or failure, based on historical price action and Time data.
Root Candles and Liquidity Draws: Visualize Root Candles as draws on liquidity, showcasing premium and discount areas, and the starting point of a Time based price movement. Understand how the opening price and equilibrium of each Root Candle can serve as a framework for your trade executions. Distribution or accumulation above or below Root Candles can also be observed and utilized.
Extended Visualization: Observe prior Model Ranges into the current Time Model, including the High, Low, and Equilibrium from the previous Time Models, helping traders visualize potential support or resistance areas.
Lookback Periods and Model Count: Use customizable lookback periods to adjust the number of past models, providing further insight into market behaviour over a chosen historical range. This can help to keep charts clean and organized with one model displayed or multiple for backtesting purposes.
Detailed Data Table: The real-Time data table allows traders to view the AMRP and range data for selected models, providing an easy reference for model behaviour and volatility dynamics. The table can depict all Time Model average ranges for reference and study, providing insights to whether the previous models have exceeded their historical range volatility, or not.
Customization Options: Customize Time Intervals with various styles (solid, dashed, dotted) and choose different colors for each model or interval. You can also select which historical models to display, alongside customizable labels.
How Traders Can Use DTT Volatility Grid Effectively:
Understand Premium and Discount Areas: By tracking Time-based ranges and using DTT's Root Candles and Previous Model Equilibrium, traders can quickly assess whether price is trading in premium or discount territory during intraday sessions.
Expecting Volatility and Time-Sensitive Trades: Knowing when a move is nearing exhaustion or when Time-based distortions are likely to cause an expansion allows traders to stay ahead of sudden market shifts. The Inner Intervals and Root Candles in combination, highlight the volatility ranges across various Timeframes, giving traders insights into which Times of the day are likely to experience heightened market activity as per DTT.
Avoiding Low Volatility Periods: The AMRP system helps traders identify times of the day where price action is likely to slow down or become choppy, encouraging traders to step aside or reduce risk during these times. If the AMRP was extended above the average of the previous Time model and the current model depicts an average range probability of low volatility, then traders can sit out in anticipation for a model with higher volatility.
Usage Guidance:
Add DTT Volatility Grid (NINE/ANARR) to your TradingView chart.
Customize your preferred time intervals, model history, and visual settings for your session.
Use the data table to track average model ranges and probabilities, ensuring you align your trades with key levels.
Incorporate DTT Volatility Grid (NINE/ANARR) into your existing strategies to fine-tune your entries and exits based on data-driven insights into volatility and price behaviour.
These tools are available ONLY on the TradingView platform.
Terms and Conditions
Our charting tools are products provided for informational and educational purposes only and do not constitute financial, investment, or trading advice. Our charting tools are not designed to predict market movements or provide specific recommendations. Users should be aware that past performance is not indicative of future results and should not be relied upon for making financial decisions. By using our charting tools, the purchaser agrees that the seller and the creator are not responsible for any decisions made based on the information provided by these charting tools. The purchaser assumes full responsibility and liability for any actions taken and the consequences thereof, including any loss of money or investments that may occur as a result of using these products. Hence, by purchasing these charting tools, the customer accepts and acknowledges that the seller and the creator are not liable nor responsible for any unwanted outcome that arises from the development, the sale, or the use of these products. Finally, the purchaser indemnifies the seller from any and all liability. If the purchaser was invited through the Friends and Family Program, they acknowledge that the provided discount code only applies to the first initial purchase of the Toodegrees Premium Suite subscription. The purchaser is therefore responsible for cancelling – or requesting to cancel – their subscription in the event that they do not wish to continue using the product at full retail price. If the purchaser no longer wishes to use the products, they must unsubscribe from the membership service, if applicable. We hold no reimbursement, refund, or chargeback policy. Once these Terms and Conditions are accepted by the Customer, before purchase, no reimbursements, refunds or chargebacks will be provided under any circumstances.
By continuing to use these charting tools, the user acknowledges and agrees to the Terms and Conditions outlined in this legal disclaimer.
Statistical Volatility° [Pro+] (Joshuuu) Introduction:
Statistical Volatility is a custom-built indicator designed to help traders track the historical range volatility of each individual candle of a given Timeframe. Compared to traditional volatility metrics, or lookback-based volatility calculations, this indicator is focused on the idea of Time-based volatility.
Description:
Whether you are looking at intraday price movements or weekly trends, this tool provides a clear, visual representation of the average range each candle typically covers. By understanding these volatility patterns, traders can observe when markets are likely to expand or consolidate, based on Time.
To obtain this insightful metrics, all available candle range data is normalized; values are therefore represented as a percentage of the maximum historical Time volatility, indicating how each candle range compares relative to the highest value. This allows for an easy comparison of volatility across different Time periods.
Key Features:
Detailed Volatility Tracking: The Statistical Volatility indicator enables traders to track the volatility of each candle throughout the day, week, or month, depending on the selected Timeframe. It helps to identify statistical Times of expansion or consolidation, beyond what current price data may showcase.
Timeframe Adaptability: On lower timeframes such as the 5 Minute Timeframe, the indicator calculates and plots the statistical range for each 5 Minute candle of the day, respectively. On higher timeframes, such as 1 Hour Timeframe or above, the ranges are plotted for each candle of the week, respectively. This adaptability ensures the indicator is versatile enough for day traders, scalpers, and swing traders alike; maintaining a highly granular yet versatile statistical edge.
Flexible Display Options: Traders can choose between different visualization methods, in form of a Heatmap or a Barchart, to display the volatility calculations. The heatmap offers a simple visualization of the data, relying entirely on the color gradient to display volatility. On the other hand, the Barchart gives more flexibility to the analyst by providing a more detailed visual analysis, with the ability of overlaying and comparing the current Time-based volatility.
How Traders Can Use Statistical Volatility (Joshuuu) Effectively:
Data-Based Optimization: By understanding when the market typically experiences its largest or smallest moves, traders can better frame the current narrative. Especially when backtesting, this information can help optimize analysts' entry mechanisms thanks to the introduction of a Time-based statistical component.
Asset-Specific Insights: Currencies like Forex pairs (i.e. FOREXCOM:EURUSD , FOREXCOM:AUDUSD ) or other Asset Classes tied to a particular geographical location (i.e. CME_MINI:NQ1! in the United States, XETR:DAX in Germany), experience volatility spikes during the operational hours of major banks. Each asset has its own “active” Time when liquidity and volatility are higher, tied to when their corresponding markets are open. This makes Statistical Volatility particularly useful for traders who focus on multiple assets across different time zones.
Usage Guidance:
Add Statistical Volatility (Joshuuu) to your TradingView chart.
Customize your preferred volatility calculation type, gradient colors, and plot styles.
Use the volatility graphic to monitor current and upcoming shifts in volatility.
Incorporate Statistical Volatility (Joshuuu) into your existing statistical strategies to fine-tune your interpretation of market behaviour.
These tools are available ONLY on the TradingView platform.
Terms and Conditions
Our charting tools are products provided for informational and educational purposes only and do not constitute financial, investment, or trading advice. Our charting tools are not designed to predict market movements or provide specific recommendations. Users should be aware that past performance is not indicative of future results and should not be relied upon for making financial decisions. By using our charting tools, the purchaser agrees that the seller and the creator are not responsible for any decisions made based on the information provided by these charting tools. The purchaser assumes full responsibility and liability for any actions taken and the consequences thereof, including any loss of money or investments that may occur as a result of using these products. Hence, by purchasing these charting tools, the customer accepts and acknowledges that the seller and the creator are not liable nor responsible for any unwanted outcome that arises from the development, the sale, or the use of these products. Finally, the purchaser indemnifies the seller from any and all liability. If the purchaser was invited through the Friends and Family Program, they acknowledge that the provided discount code only applies to the first initial purchase of the Toodegrees Premium Suite subscription. The purchaser is therefore responsible for cancelling – or requesting to cancel – their subscription in the event that they do not wish to continue using the product at full retail price. If the purchaser no longer wishes to use the products, they must unsubscribe from the membership service, if applicable. We hold no reimbursement, refund, or chargeback policy. Once these Terms and Conditions are accepted by the Customer, before purchase, no reimbursements, refunds or chargebacks will be provided under any circumstances.
By continuing to use these charting tools, the user acknowledges and agrees to the Terms and Conditions outlined in this legal disclaimer.
Liquidity Depth [Pro+] Description:
Liquidity Depth Pro+ is a trading tool with a remarkable adaptability and perfectly aligned with the intricate demands of the futures, forex, and bond markets. This indicator is based on a concept taught by the Inner Circle Trader (ICT), who explains that institutions tend to dig deeper into Liquidity Pools above highs and below lows. Specifically, ICT mentions how in Forex these Liquidity Depths are classically manifested as 10-20-30 pips respectively.
This tool allows the Analyst to adapt this concept based on their understanding of price. It delves into the essence of institutional trading, exposing deeper liquidity depth pursued by institutional giants and astute bank traders that lay further than the mere extremities of price.
CME_MINI:NQ1! Example (Tuesday):
Price raids Monday's low
Price raids Friday's low
Price digs deeper into one of Friday's Deep Liquidity Pools
Low of the Day Reversal
Note: the Depths used in this example are 30-60-90 points.
Key Features:
Versatility Across Assets: Liquidity Depth Pro+ is finely tailored for futures, forex, and bond markets, making it an all-encompassing solution suitable for a broad range of financial instruments.
Timeframe Customization: Liquidity Depth Pro+ allows users to decide Timeframe Liquidity empowering the analyst with flexibility.
Historical Pools: Choose up to the last 20 highs and lows to mark liquidity pools from the User Selected Timeframe.
Universal Trading Style: Regardless of your trading approach, be it trend-following or reversal models, this indicator embraces all styles. It offers a holistic perspective to navigating liquidity zones above highs and below lows of the chosen Timeframe.
Visual Precision: This indicator visualizes the liquidity depth with a customizable style, allowing the analyst to frame the position of deeper liquidity pools above highs and below lows.
Liquidity Table: Keep track of liquidity levels and unlock faster decision making by taking advantage of the visual Liquidity Table cues.
Adaptive Table Colors: When price is above your desired liquidity pool high, the table will match the liquidity high color to indicate a current liquidity raid or deeper pool being attacked. Vice versa, when price is below your desired liquidity pool low, the table will match the liquidity low color.
Real-Time Alerts: Save Time with live alerts that provide valuable insights into potential opportunities and liquidity purges at your desired liquidity levels.
Other Features:
Choose the Depth Type ("Auto", "Value", "Ticks", "Pips"). The “Auto” feature will select the best unit of measurement for the depths based on the current market on chart.
Choose to show up to Three Liquidity Depths.
Customize the Liquidity Line Style.
Customize the Liquidity Line Color.
Customize the Liquidity Line Width.
Customize Table Size and Location
Usage Guidance:
Add Liquidity Depth to your Tradingview chart.
Customize your desired Timeframe and Liquidity Depths to align with your personal preference.
Observe where the Liquidity Lines manifest above and below your chosen Timeframe’s highs and lows respectively, once they are raided.
Leverage this invaluable information to frame the narrative, whether you opt to pursue liquidity or capitalize on post-purge reversals.
These tools are available ONLY on the TradingView platform.
Terms and Conditions
Our charting tools are products provided for informational and educational purposes only and do not constitute financial, investment, or trading advice. Our charting tools are not designed to predict market movements or provide specific recommendations. Users should be aware that past performance is not indicative of future results and should not be relied upon for making financial decisions. By using our charting tools, the purchaser agrees that the seller and the creator are not responsible for any decisions made based on the information provided by these charting tools. The purchaser assumes full responsibility and liability for any actions taken and the consequences thereof, including any loss of money or investments that may occur as a result of using these products. Hence, by purchasing these charting tools, the customer accepts and acknowledges that the seller and the creator are not liable nor responsible for any unwanted outcome that arises from the development, the sale, or the use of these products.
Finally, the purchaser indemnifies the seller from any and all liability. If the purchaser was invited through the Friends and Family Program, they acknowledge that the provided discount code only applies to the first initial purchase of the Toodegrees Premium Suite subscription. The purchaser is therefore responsible for cancelling – or requesting to cancel – their subscription in the event that they do not wish to continue using the product at full retail price. If the purchaser no longer wishes to use the products, they must unsubscribe from the membership service, if applicable. We hold no reimbursement, refund, or chargeback policy. Once these Terms and Conditions are accepted by the Customer, before purchase, no reimbursements, refunds or chargebacks will be provided under any circumstances.
By continuing to use these charting tools, the user acknowledges and agrees to the Terms and Conditions outlined in this legal disclaimer.
Dynamic RTH Gap [Pro+] (TheEngineer) Description:
Elevate your trading expertise with the Dynamic RTH Gap , specifically designed for day traders and intraday analysts. Built to serve functionality, it enables traders to dissect and leverage Regular Trading Hour gaps with unparalleled precision and customization. This tool is built based on the methods and experience of TheEngineer who has refined these concepts over Time, creating a stronger framework for intraday analysis.
The difference between the price at market close and the open price at market open defines the RTH gap. These Times vary across different markets and countries, for example for US markets, the gap is defined between 16:15 and 9:30 of the following day.
In futures contracts, traders can use Electronic Trading Hours (ETH), or Regular Trading Hours (RTH). ETH includes the overnight session and pre-market, where majority of market participants are inactive.
When the new day RTH Opens, the Inner Circle Trader teaches how influential the gap created from the previous day's close and the next day's open is to futures contract analysis. Using RTH gap midpoints and projections can aid day traders in interpreting price action with higher context, contributing to higher probability ideas.
Key Features:
Selective Day Analysis: Optimize your trading strategy and templates by focusing on specific days of the week. This tool provides checkboxes for Monday through Friday, allowing for granular analysis on the days that matter most to your trading regimen.
Tuesday Gap extended throughout the week serves as a compass and, in this case, supports price:
RTH Gap Visualization: Engage with the markets through a dynamic visual display of RTH gaps. Benefit from our 'Show RTH Gap' option with an 'Auto Color' feature that automatically adjusts to reflect the bullish or bearish significance of the gap, enhancing your chart analysis with an intuitive color scheme.
Historical CE: This feature is a dedicated component of the Dynamic RTH Gap that integrates the concept of Consequent Encroachment (CE) from the ICT Inner Circle Trader methodology. CE is noted as the 50% of the RTH Gap. Historical CEs may act as key market pivots and or display imbalances away from such level.
Gap Grades Flexibility: Choose from various styles such as 'Dashed', 'Solid', or 'Dotted' to categorize gap grades. An additional option to 'Show Quarters' divides the Regular Trading Hours Gap into quarters for more detailed analysis.
Proactive Gap Projections: Activate 'Show Projections' to display standard deviations of the Regular Trading Hours Gap with an 'Auto' or manual setting. This is complimented with a a visual selection for projection style, providing clearer lines per Tradingview layouts.
Projection Gap Threshold: The 'Proj. Gap Threshold' slider is an innovative feature within the Dynamic RTH Gap , designed to empower traders’ control for gap projections. This feature allows one to display larger or smaller gaps to their back tested values.
Smaller RTH Gaps are less insightful, notice this small gap's projections being hit in the first few candles after the gap is established:
Data Table Integration: With the 'Show Data Table' toggle, access a neatly organized table that compiles and presents relevant gap data. Enhance your data analysis with 'Color Coding', distinguishing data points for quick identification and comparison. Lastly, monitor the % fill of the RTH gaps, up to five gaps in the past.
Automated Gap and Deviation Alerts: This tool is equipped with real-time alerts for immediate notification when gaps fill or when specific deviation levels are reached. Tailor your alerts to your strategy, and stay informed with minimizing chart time. With this feature, traders can maintain a competitive edge on multiple instruments by setting alerts, providing additional trading opportunities.
These tools are available ONLY on the TradingView platform.
Terms and Conditions
Our charting tools are products provided for informational and educational purposes only and do not constitute financial, investment, or trading advice. Our charting tools are not designed to predict market movements or provide specific recommendations. Users should be aware that past performance is not indicative of future results and should not be relied upon for making financial decisions. By using our charting tools, the purchaser agrees that the seller and the creator are not responsible for any decisions made based on the information provided by these charting tools. The purchaser assumes full responsibility and liability for any actions taken and the consequences thereof, including any loss of money or investments that may occur as a result of using these products. Hence, by purchasing these charting tools, the customer accepts and acknowledges that the seller and the creator are not liable nor responsible for any unwanted outcome that arises from the development, the sale, or the use of these products. Finally, the purchaser indemnifies the seller from any and all liability. If the purchaser was invited through the Friends and Family Program, they acknowledge that the provided discount code only applies to the first initial purchase of the Toodegrees Premium Suite subscription. The purchaser is therefore responsible for cancelling – or requesting to cancel – their subscription in the event that they do not wish to continue using the product at full retail price. If the purchaser no longer wishes to use the products, they must unsubscribe from the membership service, if applicable. We hold no reimbursement, refund, or chargeback policy. Once these Terms and Conditions are accepted by the Customer, before purchase, no reimbursements, refunds or chargebacks will be provided under any circumstances.
By continuing to use these charting tools, the user acknowledges and agrees to the Terms and Conditions outlined in this legal disclaimer.
DTT Weekly Volatility Grid [Pro+] (NINE/ANARR) Introduction:
Automate Digital Time Theory (DTT) Weekly Models with the DTT Weekly Volatility Grid , leveraging the proprietary framework developed by Nine and Anarr. This tool allows to navigate the advanced landscape of Time-based statistical trading for futures, crypto, and forex markets.
Description:
Built on the Digital Time Theory (DTT), this script provides traders with a structured view of time and price interactions, ideal for swing insights. It divides the weekly range into Time models and inner intervals, empowering traders with data-driven insights to anticipate market expansions, detect Time-based distortions, and understand volatility fluctuations at specific Times during the trading week.
Key Features:
Time-Based Weekly Models and Volatility Awareness: The DTT Weekly Time Models automatically map onto your chart, highlighting critical volatility points in weekly sessions. These models help traders recognize potential shifts in the market, ideal for identifying larger, swing-oriented moves.
Average Model Range Probability (AMRP): The AMRP feature calculates the historical probability of reaching previous DTT Weekly Model Ranges. With AMRP and Standard Deviation metrics, traders can evaluate the likelihood of DTT model continuations or breaks, aligning their strategy with higher Timeframe volatility trends.
Root Candles and Liquidity Draws: Visualize Root Candles as liquidity draws, emphasizing premium and discount areas and marking the origin of a Time-based price movement. The tool allows traders to toggle features like opening prices and equilibrium points of each Root Candle. Observing accumulation or distribution zones around these candles provides crucial reference points for strategic swing entries and exits.
Extended Visualization of Weekly Model Ranges: Leverage previous weekly model ranges within the current Time model to observe historical high, low, and equilibrium levels. This feature aids traders in visualizing premium and discount ranges of prior models, pinpointing areas of liquidity and imbalance to watch.
Customization Options: Tailor Time intervals with a variety of line styles (solid, dashed, dotted) and colours to customize each model. Adjust settings to display specific historical weekly models, apply custom labels, and create a personalized view that suits your trading style and focus.
Lookback Periods and Model Count: Select customizable lookback periods to display past models, offering insights into market behaviour over a chosen historical range. This feature enables clean, organized charts and allows analysts to add more models for detailed backtesting and analysis.
Detailed Real-Time Data Table: The live data table provides easy access to AMRP and range data for selected models. This table highlights model targets and anticipated ranges, offering insights into whether previous models have exceeded historical volatility expectations or remained within them.
How Traders Can Use The DTT Weekly Volatility Grid Effectively:
Identifying Premium and Discount Zones: Track weekly ranges using Root Candles and previous model equilibrium levels to assess if prices are trading in premium or discount areas. This information helps framing the broader swing outlook.
Timing Trades Based on Volatility: Recognize potential exhaustion points through AMRP insights or completed model distortions that may signal new expansions. By observing inner intervals and Root Candles, traders can identify periods of high market activity, assisting in Timing weekly entries and exits.
Avoiding Low Volatility Phases: AMRP calculations can indicate periods when price action may slow or become choppy. If price remains within AMRP deviations or near them, traders can adjust risk or step aside, awaiting more favourable conditions for volatility-driven trades as new inner intervals or model roots appear.
Designed for Swing Traders and Higher Timeframes: The Weekly DTT Models are suited for those looking to study higher timeframe trends across futures, forex, and crypto markets. This tool equips traders with volatility-aware, and data-driven insights during extended market cycles.
Usage Guidance:
Add DTT Weekly Volatility Grid (NINE/ANARR) to your TradingView chart.
Customize your preferred time intervals, model history, and visual settings for your session.
Use the data table to track average model ranges and probabilities, ensuring you align your trades with key levels.
Incorporate DTT Weekly Volatility Grid (NINE/ANARR) into your existing strategies to fine-tune your view through based on data-driven insights into volatility and price behaviour.
Terms and Conditions
Our charting tools are products provided for informational and educational purposes only and do not constitute financial, investment, or trading advice. Our charting tools are not designed to predict market movements or provide specific recommendations. Users should be aware that past performance is not indicative of future results and should not be relied upon for making financial decisions. By using our charting tools, the purchaser agrees that the seller and the creator are not responsible for any decisions made based on the information provided by these charting tools. The purchaser assumes full responsibility and liability for any actions taken and the consequences thereof, including any loss of money or investments that may occur as a result of using these products. Hence, by purchasing these charting tools, the customer accepts and acknowledges that the seller and the creator are not liable nor responsible for any unwanted outcome that arises from the development, the sale, or the use of these products. Finally, the purchaser indemnifies the seller from any and all liability. If the purchaser was invited through the Friends and Family Program, they acknowledge that the provided discount code only applies to the first initial purchase of the Toodegrees Premium Suite subscription. The purchaser is therefore responsible for cancelling – or requesting to cancel – their subscription in the event that they do not wish to continue using the product at full retail price. If the purchaser no longer wishes to use the products, they must unsubscribe from the membership service, if applicable. We hold no reimbursement, refund, or chargeback policy. Once these Terms and Conditions are accepted by the Customer, before purchase, no reimbursements, refunds or chargebacks will be provided under any circumstances.
By continuing to use these charting tools, the user acknowledges and agrees to the Terms and Conditions outlined in this legal disclaimer.
Unicorn Model [Pro+] (Juno) Introduction
Unicorn Model° (Juno) is a fully customizable charting tool designed to track ICT Breaker Block formations that occur after liquidity sweeps and structural failure, paired with displacement signatures. Built in collaboration with Juno, who has spent hundreds of hours trading this model, the tool encompasses his methods for qualification and detection of both Breaker Blocks, as well as Unicorn Setups (Breaker Block + Fair Value Gap).
The model focuses on moments where price violates prior highs or lows which qualify as relevant liquidity pools, to then track a potential reversal signature that causes a shift in orderflow, and establishes a new point of reference for continuations and reversals.
Inspired by ICT-based concepts, this tool provides a clean, rules-based framework for identifying confirmed breaker structures, projecting mechanical targets, and tracking model invalidation. It is designed for traders who already understand liquidity, displacement, structural failure, and want consistent visual plotting across sessions, timeframes, and assets.
This indicator does not predict direction or generate trade signals. It operates strictly on confirmed, mechanical, and deterministic price events to produce logic-bound visuals for studying model behaviour and understanding the engineering of price pivots.
Key Terms and Definitions
Swing High / Swing Low
A swing high is a local peak with lower highs on both sides of the highest high, and a swing low is a local trough with higher lows on both sides of the lowest low. These levels represent resting liquidity and are part of confirming the initial raid condition.
OHLC Liquidity
A candle’s points of reference, with a special focus on the candle’s high and low. These levels represent resting liquidity points, which can be categorized as a type of liquidity raid, or initial raid condition.
Liquidity Sweep (Raid)
Occurs when price trades through a prior swing high or low (or OHLC Liquidity), triggering resting liquidity. This is the first requirement for breaker formation. The model will not evaluate a breaker unless liquidity has been swept.
Breaker Blocks (BB)
They form when price takes out liquidity at a previous swing high or low and then reverses, using the area of that move as a new structural anchor. In a bearish scenario, the breaker block is the last down-close or series of down closes at the most recent swing low before price pushes above an old high. When the breakout above the high triggers buy stops and price then reverses lower, the down closed candle or candles become the breaker block. In a bullish scenario, it is the last up-close candle or series of up-closes at the most recent swing high before price pushes below an old low. When sell stops are triggered and price reverses higher, that up candle or series of up candles becomes the breaker block.
Fair Value Gap (FVG)
A form of price delivery imbalance, which leaves behind an area of one-sided delivery, manifested as a candle creating a gap between the previous and following candle's wicks.
Displacement
A strong directional move that creates imbalances in the form of FVGs, confirms intent, and displays a willingness to move away from a key level. Displacement provides the context for both the initial structure and its failure.
Breaker Confirmation
A breaker is only confirmed when a candle body fully closes through the originating structure’s range after a liquidity sweep. Wick interaction alone is not sufficient.
Risk Range (R)
The distance between the breaker zone and its invalidation point. This range is used to calculate projected targets (R multiples).
Target Projections (R Multiples)
Predefined extensions (e.g., 1R, 1.5R, 2R, 3R) are derived from the breaker’s risk range. These act as mechanical delivery objectives.
Invalidation
A breaker is invalidated when price violates either of the user defined conditions: Trading back past the breaker range in the opposite direction of its confirmation; or trading beyond the swing formed between the sweep and the activation.
Description
Unicorn Model° follows a structured three-step logic sequence:
Liquidity is taken (high/low is swept)
Structure fails (prior structure is closed through)
Breaker is confirmed and plotted
Consider the following example on CME_MINI:NQ1!
The tool does not rely on wick interaction alone for activation. Only full-body closures through qualifying structures are recognized. Once active, the model begins tracking price delivery using a predefined risk-to-reward framework:
Target projections are automatically plotted based on the user-defined invalidation, R:R, and additional projection multiples. These serve as mechanical objectives, allowing traders to observe whether price delivers efficiently, stalls, or fails:
The breaker or unicorn remains active until either the main R:R target is reached (completion) or invalidation conditions are met. The script also has an additional mechanic which checks for a retest of the breaker’s zone before reaching the R:R target; this showcases the difference between violent displacements through breaker areas, and breakers which actually hold price and display a more tangible orderflow shift:
Upon invalidation, the breaker transitions into an inactive state, visually indicating that the structure is no longer valid for tracking:
Key Features
Unicorn Model Alerts
Enable Alerts? to receive TradingView alerts for key Unicorn Model events, including early breaker interaction, setup activation, target delivery, invalidation warnings, and full invalidation. Available alert conditions:
‣ Potential Breaker: Alerts when Price first wicks beyond a breaker level before the close as confirmation/activation.
‣ Activation: Alerts when a Unicorn or Breaker setup becomes fully active upon candle close confirmation.
‣ Target Reached: Alerts when an active Unicorn or Breaker reaches its projected R:R target.
‣ Invalidation Warning: Alerts when an active Unicorn or Breaker is approaching invalidation.
‣ Invalidation Hit: Alerts when an active Unicorn or Breaker is fully invalidated.
Alerts are managed from the indicator settings and must be selected before creating the TradingView alert.
Bias Control
This setting allows traders to display:
‣ Bullish models only
‣ Bearish models only
‣ Neutral (Bullish and Bearish)
‣ Automatic (Higher Timeframe Trend Filtering)
This enables analysts to focus their analysis directionally and filters setups that are not aligned to their higher timeframe bias.
OANDA:EURUSD on a downtrend, difference of Bullish vs. Bearish Bias:
R:R and Target Projection System
‣ Define a base R:R (e.g., 2R)
‣ Customize any projection multiples (e.g., 1, 1.5, 2, 3)
‣ Automatically plot mechanical delivery targets
These projections provide a consistent framework for evaluating price delivery.
CME_MINI:NQ1! with multiple R Projections:
Breaker Filtering & Quality Control
‣ History: limits the number of previous and currently active breaker structures displayed to reduce chart clutter or to increase the model visibility for backtesting.
‣ Unicorn Mode: traders can enable stricter internal conditions to filter for higher-quality breaker formations. This mode detects Breaker Blocks that overlap with FVGs, prioritizing cleaner, displacement-driven setups.
CME_MINI:ES1! difference of Breaker and Unicorn Model (without and with FVG overlap):
‣ Use Swing as Invalidation: instead of invalidating breakers at the zone extreme, this mode switches invalidation logic to the swing created post liquidity raid. This allows the model to remain active until deeper structural retracement occurs.
CME:6A1! showcase of how Swing As Invalidation visually changes Projections and Breakers:
‣ Discard Invalidated Setups: To keep charts cleaner, this setting deletes invalidated setups that were plotted, allowing for a more focused and active view.
NYMEX:CL1! cleaner chart for tape reading or journaling:
Liquidity Source Configuration
The model can use multiple data inputs for identifying liquidity. Choose to track Single or Multiple liquidity sources in three forms: Swing Liquidity and OHLC Liquidity, or both.
The Source A/B/C customization is gated by the master Sources settings.
‣ Automatic Mode: pre-defined Single or Multiple liquidity sources based on Juno’s studies and model refinement over the years. Users can decide to bypass this with Manual mode and set their own liquidity preferences.
CBOT_MINI:YM1! OHLC Liquidity vs Swing Liquidity:
Breaker Size Filter
Traders can choose from a pre-tuned set of options to only show Small, Medium and Large breakers. The sizes are dynamic between per asset volatility, and specific to their innate characteristics.
Users can also filter breaker zones based on Custom size constraints:
‣ Min Zone Size in points or pips
‣ Max Zone Size in points or pips
This helps refine setups and maintain consistency across different market conditions, as well as discarding unwanted setups and refining them into smaller/larger ranges.
CME:BTC1! Daily chart with and without a $5000 Minimum Breaker Size Filter:
Time Filter
Users have the option to display model activations up to three customizable sessions in their own custom timezone. Time filters are defaulted to New York EST.
This is particularly useful for intraday traders focusing on specific market windows and eliminating setups that plot outside their trading hours.
OANDA:GBPUSD Time Filter set to London Session at 02:00 - 05:00:
Info Table
Users will find two modes for the Info Table: Simple retains the most important elements of the model while Detailed introduces more active settings enabled filters. You can customize the table position and size for optimal chart style preferences.
The table provides a structured overview of:
‣ Asset
‣ Chart Timeframe
‣ Current Active Setup Liquidity
‣ Bias Mode
‣ Invalidation Type
‣ Breaker Size Filter (if enabled)
‣ Time Filter (if enabled)
How Traders Can Use the Indicator Effectively
Unicorn Model° (Juno) is not designed for blindly following entries or signals. It is best used as a structural tracking and confluence tool coupled with user’s discernment.
The indicator is particularly effective for:
Studying failed structure and orderflow shifts
Tracking liquidity-driven continuation setups
Reviewing breaker performance across sessions
Aligning execution with higher-timeframe narrative
Usage Guidance
Add Unicorn Model° (Juno) to any TradingView chart. The model is fractal and functions across all timeframes and instruments.
Use breaker zones to identify potential structural flips.
Monitor projected targets for delivery behaviour.
Observe invalidation to understand failed setups.
For best results, combine with your own narrative, liquidity model, and execution framework.
Terms and Conditions
Our charting tools are products provided for informational and educational purposes only and do not constitute financial, investment, or trading advice. Our charting tools are not designed to predict market movements or provide specific recommendations. Users should be aware that past performance is not indicative of future results and should not be relied upon for making financial decisions. By using our charting tools, the purchaser agrees that the seller and the creator are not responsible for any decisions made based on the information provided by these charting tools. The purchaser assumes full responsibility and liability for any actions taken and the consequences thereof, including any loss of money or investments that may occur as a result of using these products. Hence, by purchasing these charting tools, the customer accepts and acknowledges that the seller and the creator are not liable nor responsible for any unwanted outcome that arises from the development, the sale, or the use of these products. Finally, the purchaser indemnifies the seller from any and all liability. If the purchaser was invited through the Friends and Family Program, they acknowledge that the provided discount code only applies to the first initial purchase of any Toodegrees product. The purchaser is therefore responsible for cancelling – or requesting to cancel – their subscription in the event that they do not wish to continue using the product at full retail price. If the purchaser no longer wishes to use the products, they must unsubscribe from the membership service, if applicable. We hold no reimbursement, refund, or chargeback policy. Once these Terms and Conditions are accepted by the Customer, before purchase, no reimbursements, refunds or chargebacks will be provided under any circumstances.
By continuing to use these charting tools, the user acknowledges and agrees to the Terms and Conditions outlined in this legal disclaimer. DTT Yearly Volatility Grid [Pro+] (NINE/ANARR) Introduction :
This tool is designed to automate the Digital Time Theory (DTT) framework created by Ivan and Anarr and applies the DTT Yearly Volatility Grid to uncover swing trading opportunities by analyzing Time-based statistical market behavior across the 4H to Daily chart.
Description:
Built upon the proprietary Digital Time Theory (DTT) , this advanced version is tailored for traders seeking multi-day to multi-week moves . It equips swing traders with an edge by analyzing macro Time intervals and volatility behavior across higher Timeframes. Applicable to all major asset classes, including stocks, crypto, forex, and futures , this script breaks down the entire yearly range into Higher-Time Frame Time Models and statistical zones .
This version uses daily intervals to track broader volatility waves, highlight the DTT framework, and pinpoint premium/discount areas across swing cycles. Powered by Time-driven data insights, this tool assists traders in anticipating expansions, understanding long-range Time distortions, and positioning around statistically significant zones in the higher-Time frame narrative.
Key Features:
Time-Based Models and Macro Volatility Awareness:
Automatically populates the chart with DTT Yearly Time Models (4H, Daily), engineered to spotlight macro volatility events across broader market sessions. Helps swing traders identify potential inflection points, reversals, or trend continuation zones.
Average Model Range Probability (AMRP):
Measure the average volatility expected over higher Time-based models. Use AMRP Levels and Projections to assess the range potential of each Yearly Model Time window—vital for monitoring reversals, breakouts, or continuation plays across several sessions or weeks.
Digital Root Candles and HTF Liquidity Draws:
For DTT Yearly Models, the Digital Root Candles are calculated as a specific Daily candle, and can be viewed on the Daily or 4H Timeframe. Analysts can frame premium and discount zones, based on where price is trading in relation to the current or previous model's Digital Roots. These areas also act as anchors for institutional price movement, often serving as bases for accumulation/distribution periods or large impulse moves.
Extended Visualization:
Track and project prior model ranges (high, low, equilibrium) into the current swing window. This helps visualize macro support/resistance , range expansion, failure zones, and price gravitation levels for longer-term trade planning.
Lookback Periods and Model Count
Utilize adjustable lookback periods to control the number of past DTT Yearly Models displayed—ideal for swing traders and quarterly outlooks. Whether you’re reviewing one yearly model to focus on the present range or several months’ worth of data for backtesting and confluence, this feature keeps charts clean, structured, and aligned with your preferred historical perspective.
By tailoring how many previous Time-based models appear on the chart, traders can better visualize and backtest repeated behaviors, major volatility clusters, and how key levels evolve over Time.
Detailed Data Table:
View statistical AMRP data for multiple DTT Yearly Models in real-Time. The data table helps confirm whether current price movement exceeds, respects, or fails to reach historical volatility ranges—key for analyzing market compression or expansion phases.
Customization Options:
Toggle inner Time interval, calculate AMRP utilizing a custom model lookback, and display styles (solid/dotted lines), including color coordination per drawing. Easily customize your charts and settings to fit your swing trading system or macro analysis.
How Swing Traders Can Use DTT Yearly Volatility Grid Effectively
Identify Swing Premium and Discount Zones:
Use Root Candles and Yearly Time Model AMRP Zones to evaluate where price is positioned in the current Time Model. Using this tool, traders can plan trades with a longer term horizon for a minimum of 1 to 2-weeks or manage entries/exits around market structure shifts and liquidity pools
Expect Macro Volatility Shifts:
Use the HTF models to forecast when and which volatility models are historically known to create larger market impulses . These tools help spot periods of potential exhaustion or breakout, especially near key economic releases, quarterly closes , or macro liquidity zones .
Avoid Low Volatility Consolidations:
AMRP helps you detect when the market is compressing or coiling within a DTT Yearly Model. If price is trading between Digital Root Candles or the AMRP zones, analysts are likely to notice periods of consolidation, and the inability to reach their historical volatility averages.
Usage Guidance:
Add DTT Yearly Volatility Grid (NINE/ANARR) to your TradingView chart.
Make sure to be on the 4H, or Daily Timeframes depending on your asset class and analysis.
Use the DTT Model elements and the Data Table to track expansion zones, premium/discount extremes, and model range behavior.
Terms and Conditions
Our charting tools are products provided for informational and educational purposes only and do not constitute financial, investment, or trading advice. Our charting tools are not designed to predict market movements or provide specific recommendations. Users should be aware that past performance is not indicative of future results and should not be relied upon for making financial decisions. By using our charting tools, the purchaser agrees that the seller and the creator are not responsible for any decisions made based on the information provided by these charting tools. The purchaser assumes full responsibility and liability for any actions taken and the consequences thereof, including any loss of money or investments that may occur as a result of using these products. Hence, by purchasing these charting tools, the customer accepts and acknowledges that the seller and the creator are not liable nor responsible for any unwanted outcome that arises from the development, the sale, or the use of these products. Finally, the purchaser indemnifies the seller from any and all liability. If the purchaser was invited through the Friends and Family Program, they acknowledge that the provided discount code only applies to the first initial purchase of the Toodegrees Premium Suite subscription. The purchaser is therefore responsible for cancelling – or requesting to cancel – their subscription in the event that they do not wish to continue using the product at full retail price. If the purchaser no longer wishes to use the products, they must unsubscribe from the membership service, if applicable. We hold no reimbursement, refund, or chargeback policy. Once these Terms and Conditions are accepted by the Customer, before purchase, no reimbursements, refunds or chargebacks will be provided under any circumstances.
By continuing to use these charting tools, the user acknowledges and agrees to the Terms and Conditions outlined in this legal disclaimer.