
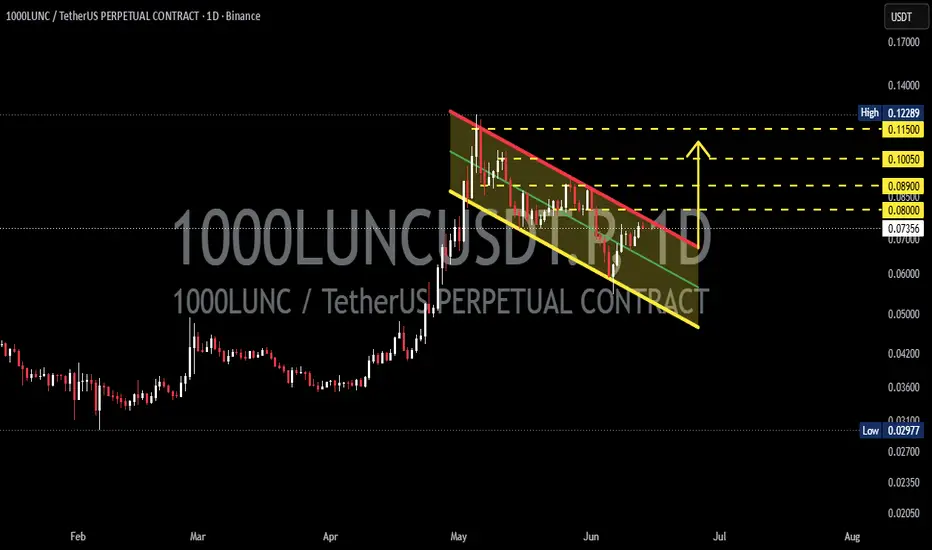
On the daily (1D) chart, 1000LUNC/USDT appears to be forming a Bullish Flag Pattern 🏳️📈, one of the most popular bullish continuation patterns that typically develops after a strong upward impulse.
Price previously experienced an aggressive rally from around 0.04500 to a peak near 0.12289 🚀, followed by a healthy correction phase that formed a descending channel (flag) characterized by a series of lower highs and lower lows.
At the moment, price is trading near the upper boundary of the pattern and is testing the descending resistance trendline 🔴, a crucial level that could determine the next major directional move.
---
🏳️📈 Pattern Overview: Bullish Flag
❓ What is a Bullish Flag?
A Bullish Flag is a continuation pattern that forms after a sharp upward move (flagpole) 🚀, followed by a temporary consolidation or pullback within a descending channel before the uptrend resumes.
🔍 Pattern Components
✅ Flagpole
- Strong impulsive rally from 0.04500 to 0.12289.
- Indicates significant buying pressure and bullish momentum 💪🐂.
✅ Flag
- A corrective phase contained within a descending channel defined by the red 🔴 and yellow 🟡 trendlines.
- Trading volume typically decreases during flag formation.
✅ Breakout Zone
- Located around the descending resistance trendline 🔴.
- A strong daily close above this level could confirm a bullish breakout 🚀.
---
🐂 Bullish Scenario
✅ Bullish Trigger
Price successfully breaks above the descending resistance trendline and maintains support around the 0.08000 area.
🎯 Bullish Targets
🎯 Target 1: 0.08900
🎯 Target 2: 0.10050
🎯 Target 3: 0.11500
🎯 Target 4: 0.12289 (Previous High)
🚀 If momentum continues to strengthen and volume expands significantly, price may extend higher in line with the Bullish Flag projection.
📈 Additional Confirmation Signals
✅ Breakout accompanied by strong volume
✅ Successful retest of the breakout trendline
✅ Formation of a new Higher High above 0.08900
✅ Buyers continue to dominate market structure
---
🐻 Bearish Scenario
Although the structure is becoming increasingly bullish, traders should still monitor the risk of a failed breakout ⚠️.
❌ Bearish Triggers
❌ Price fails to break the descending resistance trendline
❌ Strong rejection occurs within the 0.08000–0.08900 resistance zone
❌ Breakdown below the channel support (yellow trendline)
🎯 Bearish Targets
🎯 First Support: 0.06500
🎯 Second Support: 0.05800
🎯 Major Support: 0.05000
📉 A breakdown below the channel would invalidate the Bullish Flag structure and increase the probability of a deeper correction.
---
📋 Conclusion
Technically, 1000LUNC/USDT remains within a valid Bullish Flag structure 🏳️📈, suggesting that the current pullback may simply be a consolidation phase following the previous strong rally.
As long as price continues to hold channel support 🟡 and eventually breaks above the descending resistance trendline 🔴, the potential for a continuation toward 0.08900 – 0.12289 remains highly favorable 🚀.
🎯 The key focus for traders is the confirmation of a Bullish Flag breakout, as this area will likely determine whether the bullish trend resumes or a deeper correction unfolds.
#1000LUNC #LUNC #LUNCUSDT #1000LUNCUSDT #Crypto #Cryptocurrency #Altcoin #Binance #TradingView #TechnicalAnalysis #ChartAnalysis #PriceAction #BullishFlag #FlagPattern #BullishBreakout #BreakoutTrading #TrendContinuation #CryptoTrading #SwingTrading #Trader #Bullish #CryptoMarket #Altseason #SupportAndResistance #VolumeAnalysis
Price previously experienced an aggressive rally from around 0.04500 to a peak near 0.12289 🚀, followed by a healthy correction phase that formed a descending channel (flag) characterized by a series of lower highs and lower lows.
At the moment, price is trading near the upper boundary of the pattern and is testing the descending resistance trendline 🔴, a crucial level that could determine the next major directional move.
---
🏳️📈 Pattern Overview: Bullish Flag
❓ What is a Bullish Flag?
A Bullish Flag is a continuation pattern that forms after a sharp upward move (flagpole) 🚀, followed by a temporary consolidation or pullback within a descending channel before the uptrend resumes.
🔍 Pattern Components
✅ Flagpole
- Strong impulsive rally from 0.04500 to 0.12289.
- Indicates significant buying pressure and bullish momentum 💪🐂.
✅ Flag
- A corrective phase contained within a descending channel defined by the red 🔴 and yellow 🟡 trendlines.
- Trading volume typically decreases during flag formation.
✅ Breakout Zone
- Located around the descending resistance trendline 🔴.
- A strong daily close above this level could confirm a bullish breakout 🚀.
---
🐂 Bullish Scenario
✅ Bullish Trigger
Price successfully breaks above the descending resistance trendline and maintains support around the 0.08000 area.
🎯 Bullish Targets
🎯 Target 1: 0.08900
🎯 Target 2: 0.10050
🎯 Target 3: 0.11500
🎯 Target 4: 0.12289 (Previous High)
🚀 If momentum continues to strengthen and volume expands significantly, price may extend higher in line with the Bullish Flag projection.
📈 Additional Confirmation Signals
✅ Breakout accompanied by strong volume
✅ Successful retest of the breakout trendline
✅ Formation of a new Higher High above 0.08900
✅ Buyers continue to dominate market structure
---
🐻 Bearish Scenario
Although the structure is becoming increasingly bullish, traders should still monitor the risk of a failed breakout ⚠️.
❌ Bearish Triggers
❌ Price fails to break the descending resistance trendline
❌ Strong rejection occurs within the 0.08000–0.08900 resistance zone
❌ Breakdown below the channel support (yellow trendline)
🎯 Bearish Targets
🎯 First Support: 0.06500
🎯 Second Support: 0.05800
🎯 Major Support: 0.05000
📉 A breakdown below the channel would invalidate the Bullish Flag structure and increase the probability of a deeper correction.
---
📋 Conclusion
Technically, 1000LUNC/USDT remains within a valid Bullish Flag structure 🏳️📈, suggesting that the current pullback may simply be a consolidation phase following the previous strong rally.
As long as price continues to hold channel support 🟡 and eventually breaks above the descending resistance trendline 🔴, the potential for a continuation toward 0.08900 – 0.12289 remains highly favorable 🚀.
🎯 The key focus for traders is the confirmation of a Bullish Flag breakout, as this area will likely determine whether the bullish trend resumes or a deeper correction unfolds.
#1000LUNC #LUNC #LUNCUSDT #1000LUNCUSDT #Crypto #Cryptocurrency #Altcoin #Binance #TradingView #TechnicalAnalysis #ChartAnalysis #PriceAction #BullishFlag #FlagPattern #BullishBreakout #BreakoutTrading #TrendContinuation #CryptoTrading #SwingTrading #Trader #Bullish #CryptoMarket #Altseason #SupportAndResistance #VolumeAnalysis

✅ Get Free Signals! Join Our Telegram Channel Here: t.me/TheCryptoNuclear
✅ Twitter: twitter.com/crypto_nuclear
✅ Join Bybit : partner.bybit.com/b/nuclearvip
✅ Benefits : Lifetime Trading Fee Discount -50%
✅ Twitter: twitter.com/crypto_nuclear
✅ Join Bybit : partner.bybit.com/b/nuclearvip
✅ Benefits : Lifetime Trading Fee Discount -50%
Penafian
Maklumat dan penerbitan adalah tidak bertujuan, dan tidak membentuk, nasihat atau cadangan kewangan, pelaburan, dagangan atau jenis lain yang diberikan atau disahkan oleh TradingView. Baca lebih dalam Terma Penggunaan.
✅ Get Free Signals! Join Our Telegram Channel Here: t.me/TheCryptoNuclear
✅ Twitter: twitter.com/crypto_nuclear
✅ Join Bybit : partner.bybit.com/b/nuclearvip
✅ Benefits : Lifetime Trading Fee Discount -50%
✅ Twitter: twitter.com/crypto_nuclear
✅ Join Bybit : partner.bybit.com/b/nuclearvip
✅ Benefits : Lifetime Trading Fee Discount -50%
Penafian
Maklumat dan penerbitan adalah tidak bertujuan, dan tidak membentuk, nasihat atau cadangan kewangan, pelaburan, dagangan atau jenis lain yang diberikan atau disahkan oleh TradingView. Baca lebih dalam Terma Penggunaan.