
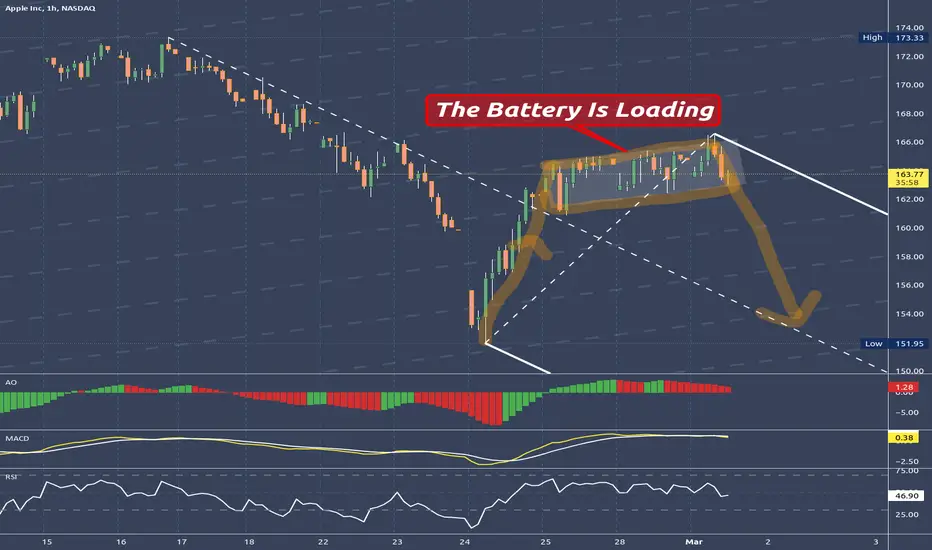
...and the unloading is near.
The dashed line just shows the frequency of Apple.
The white pitchfork shows the most probable path of price. The right leg down (orange) is about the same as the leg up.
If the down leg plays out, we will see price at least on the centerline of the white pitchfork.
I think this sideways trading has it's reason.
We will see soon.
BTW: I'm loaded too... §8-)
The dashed line just shows the frequency of Apple.
The white pitchfork shows the most probable path of price. The right leg down (orange) is about the same as the leg up.
If the down leg plays out, we will see price at least on the centerline of the white pitchfork.
I think this sideways trading has it's reason.
We will see soon.
BTW: I'm loaded too... §8-)
Nota
Shifting the pitchfork to the new C point.This is, because the Battery is loading even more.
Nota
Nota
Centerline OK4You? §8-)Nota
Until there is a open and close above the U-MLH, the target is the CL.
Remove subjective trading:
👉 Andrews Pitchforks applied by fixed rules
👉 Weekly structure maps for Indices, Futures, Energy and Crypto, plus the method behind them.
→ alphametrics.substack.com/?utm_source=tradingview
👉 Andrews Pitchforks applied by fixed rules
👉 Weekly structure maps for Indices, Futures, Energy and Crypto, plus the method behind them.
→ alphametrics.substack.com/?utm_source=tradingview
Penafian
Maklumat dan penerbitan adalah tidak bertujuan, dan tidak membentuk, nasihat atau cadangan kewangan, pelaburan, dagangan atau jenis lain yang diberikan atau disahkan oleh TradingView. Baca lebih dalam Terma Penggunaan.
Remove subjective trading:
👉 Andrews Pitchforks applied by fixed rules
👉 Weekly structure maps for Indices, Futures, Energy and Crypto, plus the method behind them.
→ alphametrics.substack.com/?utm_source=tradingview
👉 Andrews Pitchforks applied by fixed rules
👉 Weekly structure maps for Indices, Futures, Energy and Crypto, plus the method behind them.
→ alphametrics.substack.com/?utm_source=tradingview
Penafian
Maklumat dan penerbitan adalah tidak bertujuan, dan tidak membentuk, nasihat atau cadangan kewangan, pelaburan, dagangan atau jenis lain yang diberikan atau disahkan oleh TradingView. Baca lebih dalam Terma Penggunaan.